| Param | Original file | Final file |
|---|---|---|
| Filename | modeM0/AS1A03_120T01_9000001266_09103cztM0_level2.evt | modeM0/AS1A03_120T01_9000001266_09103cztM0_level2_quad_clean.evt |
| Size (bytes) | 492,828,480 | 86,895,360 |
| Size | 470.0 MB | 82.9 MB |
| Events in quadrant A | 3,688,695 | 547,396 |
| Events in quadrant B | 3,481,482 | 564,019 |
| Events in quadrant C | 3,354,037 | 536,127 |
| Events in quadrant D | 3,941,358 | 511,779 |
| Mode M9 | |||
|---|---|---|---|
| Quadrant | BADHDUFLAG | Total packets | Discarded packets |
| A | 0 | 16 | 0 |
| B | 0 | 16 | 0 |
| C | 0 | 16 | 0 |
| D | 0 | 16 | 0 |
| Mode M0 | |||
|---|---|---|---|
| Quadrant | BADHDUFLAG | Total packets | Discarded packets |
| A | 0 | 15096 | 19 |
| B | 0 | 14475 | 6 |
| C | 0 | 14380 | 12 |
| D | 0 | 16176 | 28 |
| Mode SS | |||
|---|---|---|---|
| Quadrant | BADHDUFLAG | Total packets | Discarded packets |
| A | 0 | 136 | 0 |
| B | 0 | 136 | 0 |
| C | 0 | 136 | 0 |
| D | 0 | 136 | 0 |
| Quadrant | Total seconds | Saturated seconds | Saturation percentage |
|---|---|---|---|
| A | 6777 | 62 | 0.914859% |
| B | 6781 | 71 | 1.047043% |
| C | 6779 | 78 | 1.150612% |
| D | 6775 | 168 | 2.479705% |
Noise dominated data is calculated using 1-second bins in cleaned event files. If a bin has >2000 counts, and if more than 50% of those come from <1% of pixels, then it is considered to be noise-dominated and hence unusable.
| Quadrant | # 1 sec bins | Bins with >0 counts | Bins with >2000 counts | High rate bins dominated by noise | Noise dominated (total time) | Noise dominated (detector-on time) | Marked lightcurve |
|---|---|---|---|---|---|---|---|
| A | 56367 | 6785 | 6 | 6 | 0.01% | 0.09% | 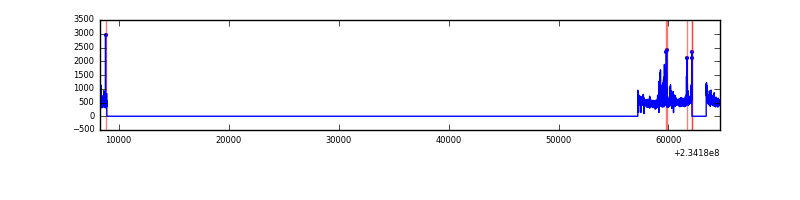 |
| B | 56367 | 6785 | 5 | 5 | 0.01% | 0.07% | 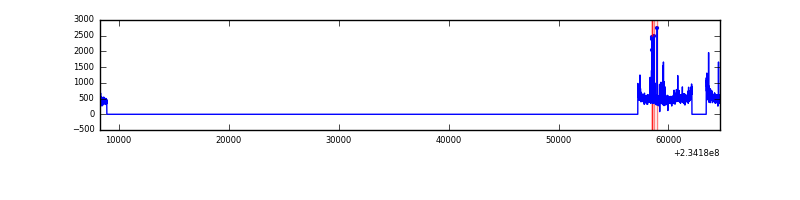 |
| C | 56367 | 6785 | 39 | 39 | 0.07% | 0.57% | 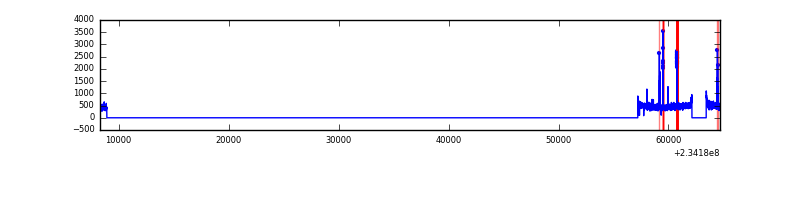 |
| D | 56367 | 6785 | 117 | 117 | 0.21% | 1.72% | 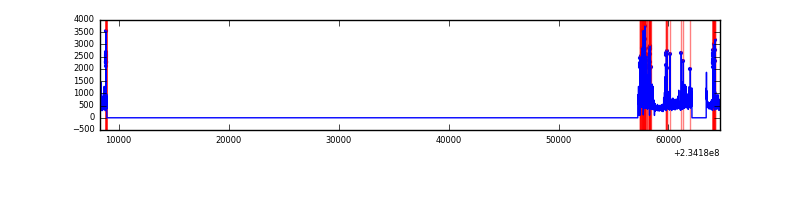 |
Top three noisy pixels from each quadrant. If the there are fewer than three noisy pixels in the level2.evt file, extra rows are filled as -1
| Pixel properties | Quadrant properties | ||||||
|---|---|---|---|---|---|---|---|
| Quadrant | DetID | PixID | Counts | Sigma | Mean | Median | Sigma |
| A | 8 | 5 | 360454 | 2086.13 | 848 | 833 | 172.4 |
| A | 4 | 2 | 27558 | 155.03 | 848 | 833 | 172.4 |
| A | 1 | 162 | 18927 | 104.96 | 848 | 833 | 172.4 |
| B | 0 | 198 | 69055 | 426.18 | 857 | 838 | 160.1 |
| B | 0 | 187 | 23427 | 141.12 | 857 | 838 | 160.1 |
| B | 0 | 214 | 19542 | 116.85 | 857 | 838 | 160.1 |
| C | 14 | 234 | 136152 | 719.35 | 817 | 825 | 188.1 |
| C | 9 | 68 | 17931 | 90.93 | 817 | 825 | 188.1 |
| C | 14 | 67 | 13812 | 69.03 | 817 | 825 | 188.1 |
| D | 2 | 14 | 241862 | 1169.86 | 803 | 783 | 206.1 |
| D | 13 | 104 | 179474 | 867.12 | 803 | 783 | 206.1 |
| D | 10 | 172 | 153660 | 741.85 | 803 | 783 | 206.1 |
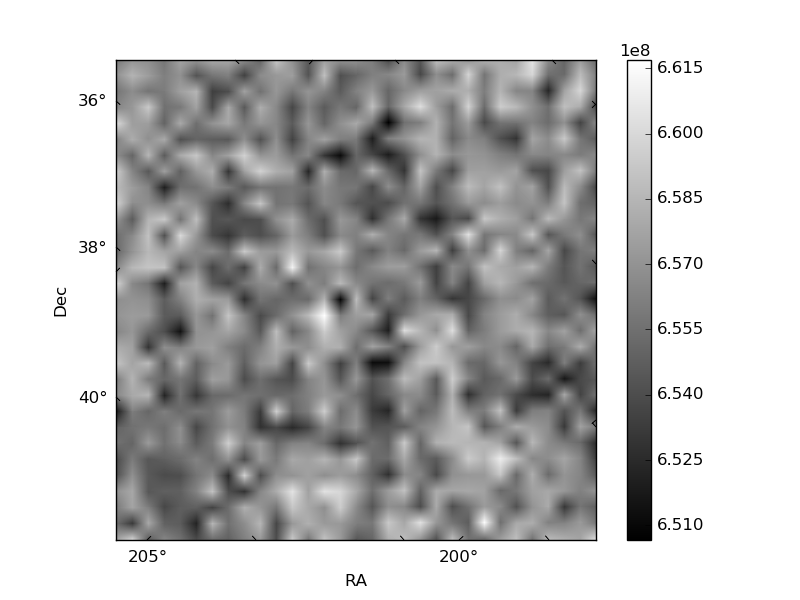
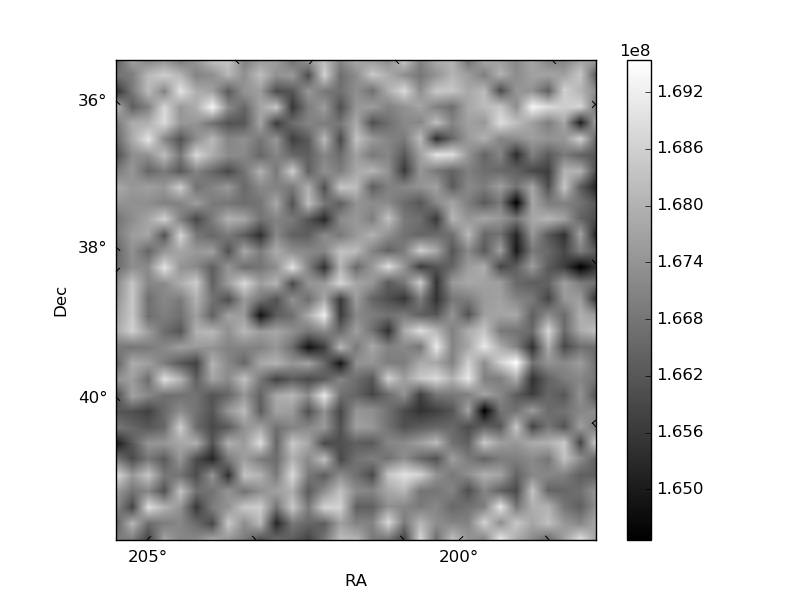
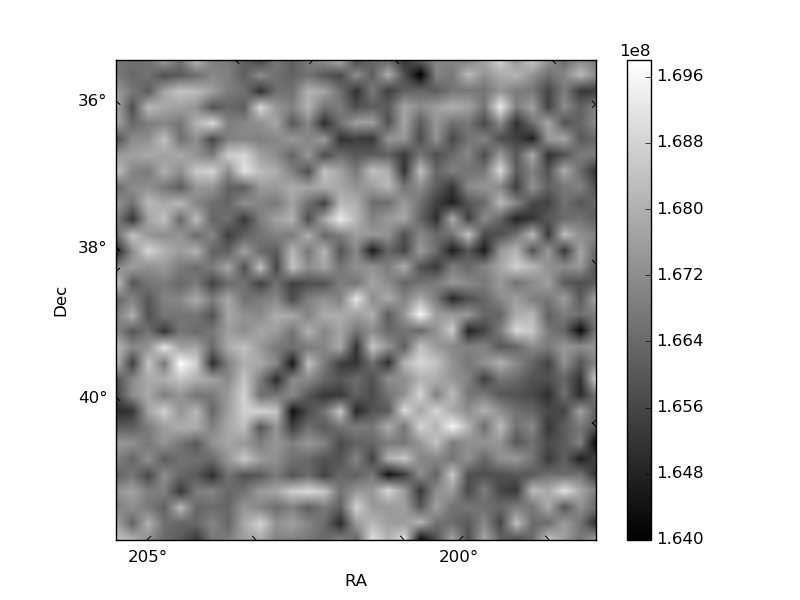
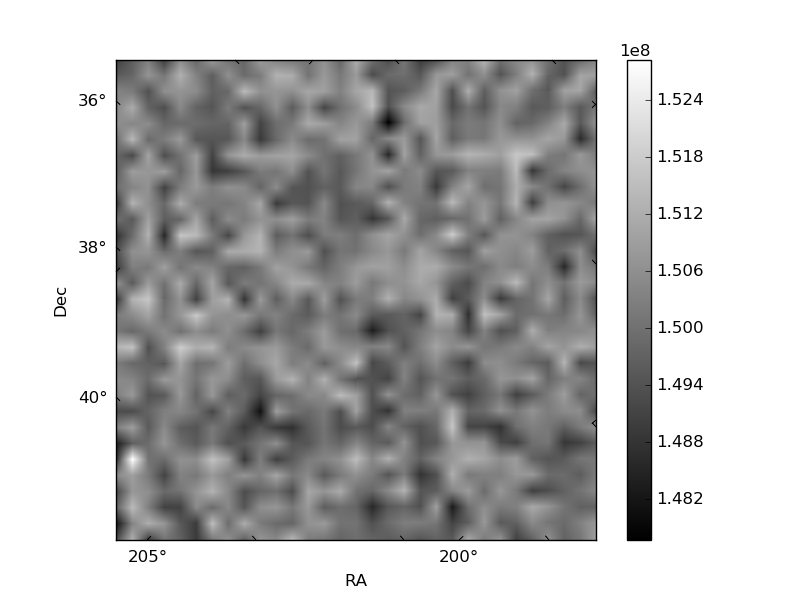
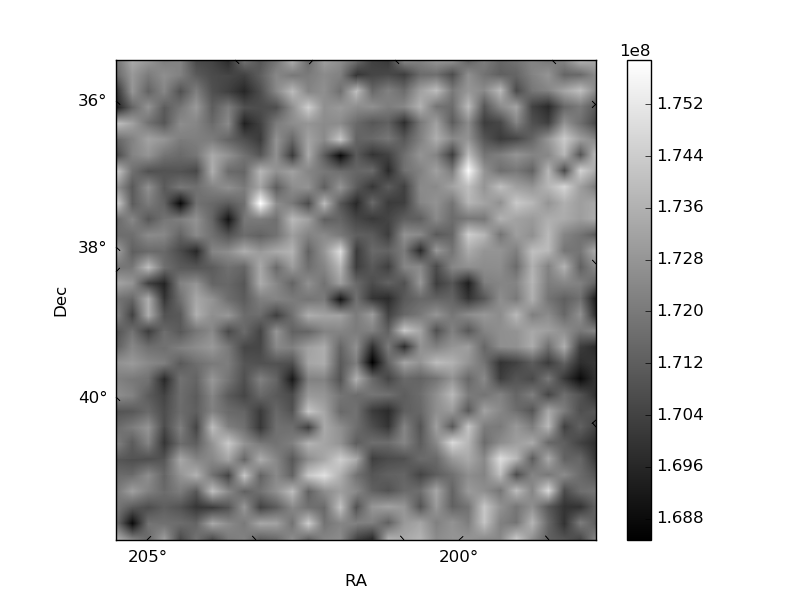
Histogram calculated using DETX and DETY for each event in the final _common_clean file
| Quadrant A | 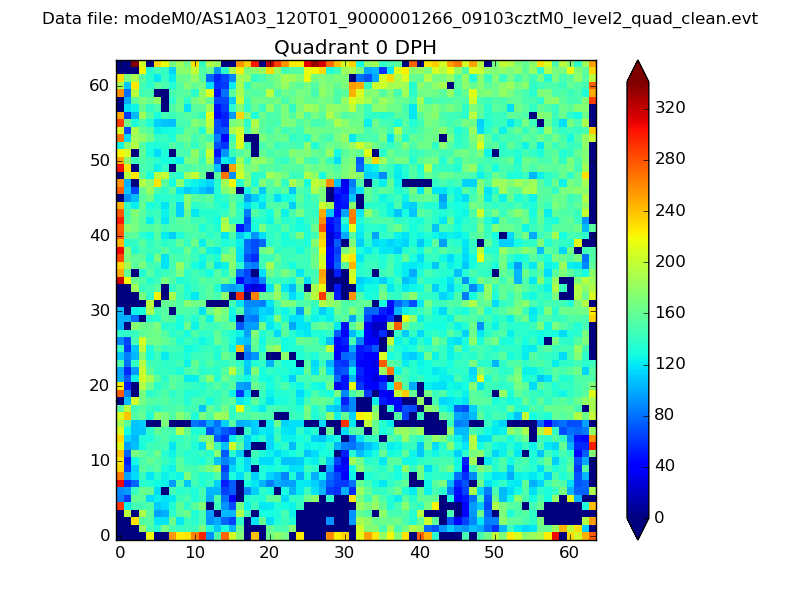 |
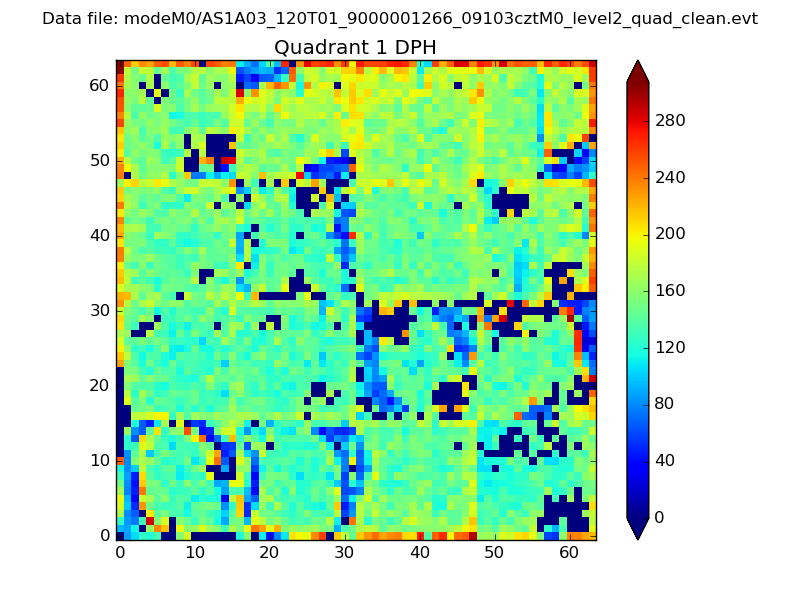 |
Quadrant B |
|---|---|---|---|
| Quadrant D | 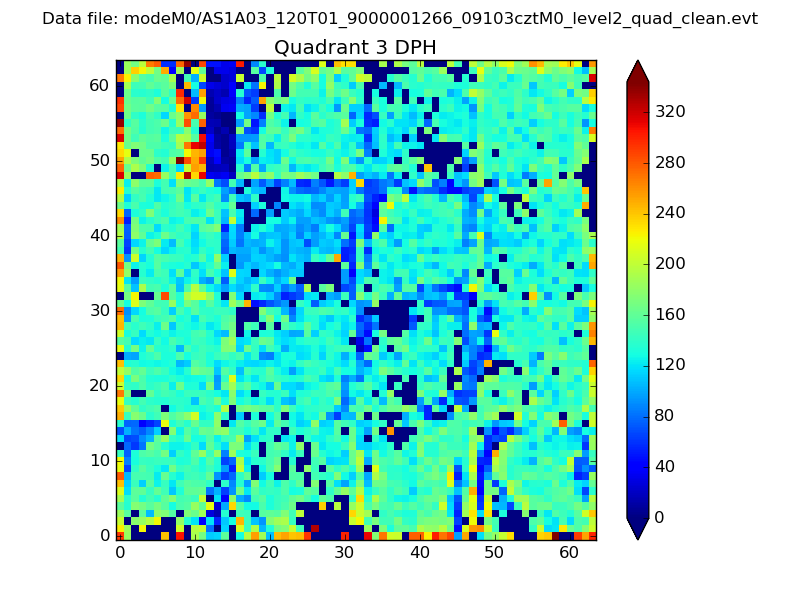 |
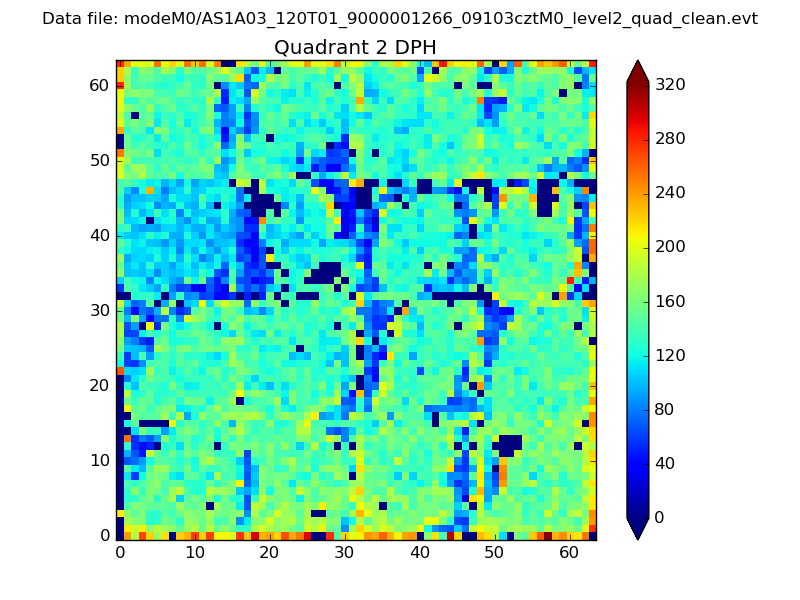 |
Quadrant C |
| Plot type | Count rate plots | Images |
|---|---|---|
| Comparison with Poisson distribution Blue bars denote a histogram of data divided into 1 sec bins. Red curve is a Poisson curve with rate = median count rate of data. |
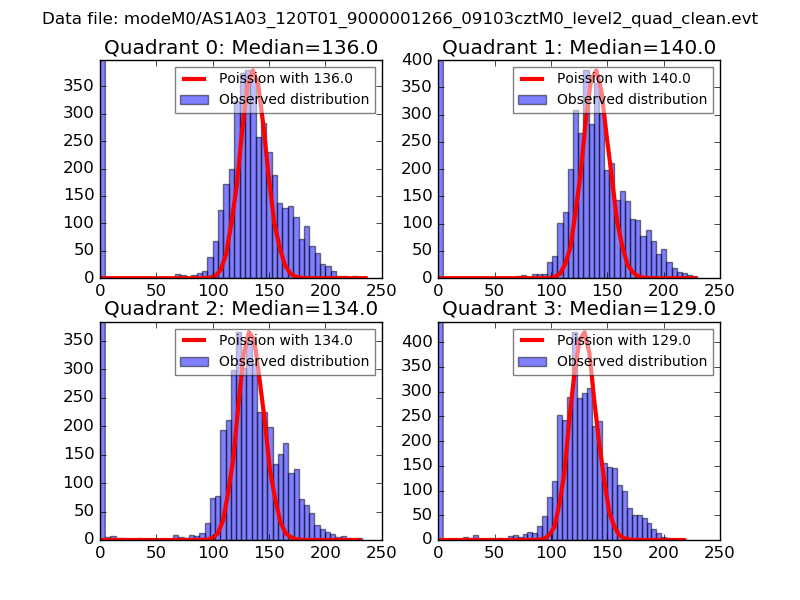 |
 |
| Quadrant-wise count rates Data is divided into 100 sec bins |
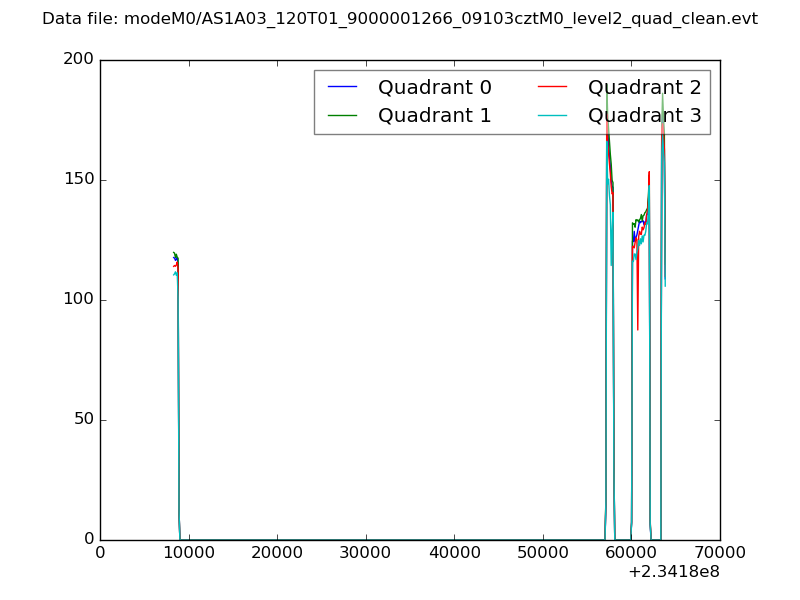 |
|
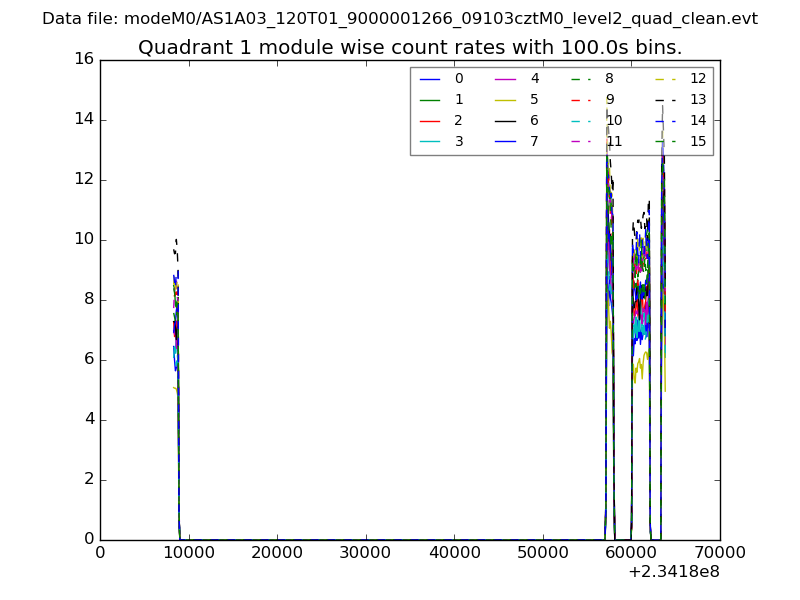
| Module-wise count rates for Quadrant A Data is divided into 100 sec bins |
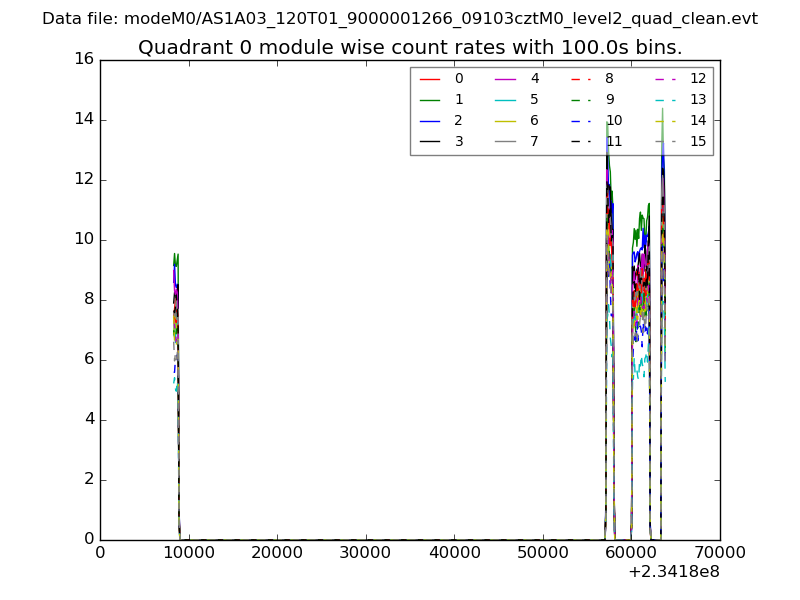 |
 |
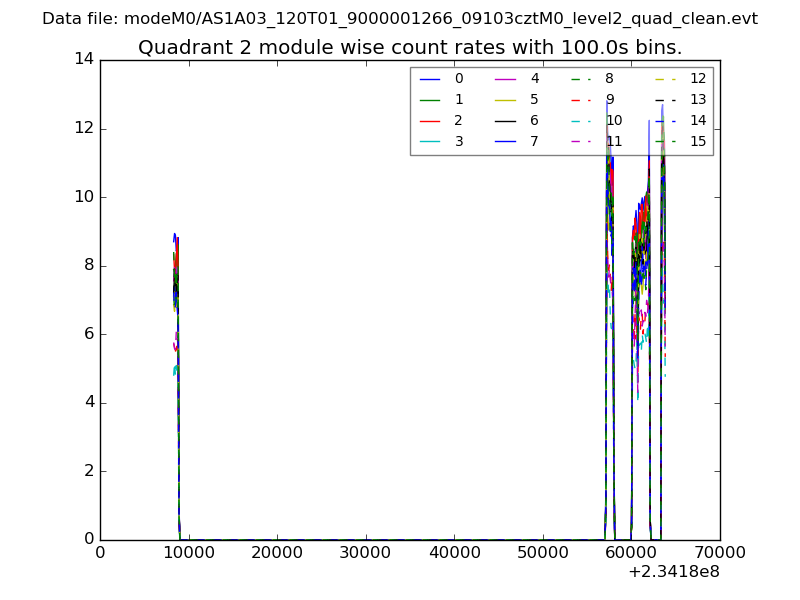
| Module-wise count rates for Quadrant B Data is divided into 100 sec bins |
 |
 |
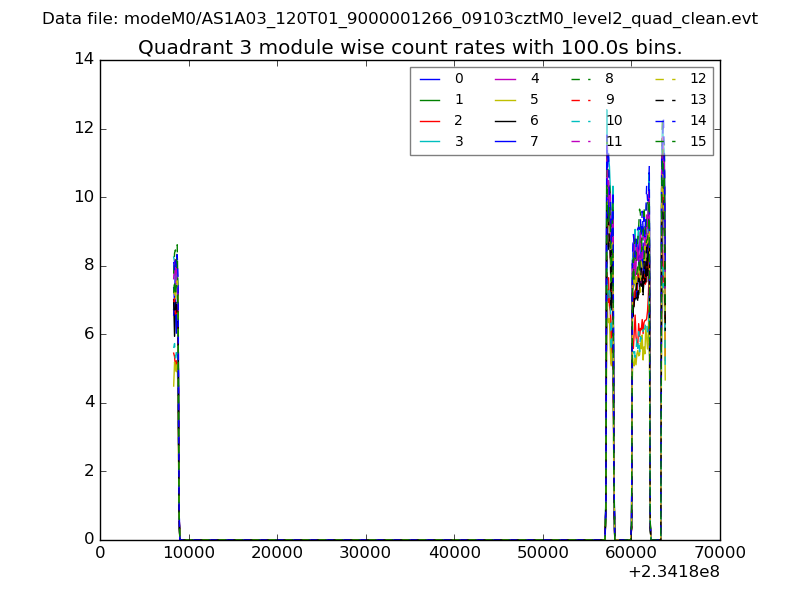
| Module-wise count rates for Quadrant C Data is divided into 100 sec bins |
 |
 |
| Module-wise count rates for Quadrant D Data is divided into 100 sec bins |
 |
 |
| Parameter | Plot |
|---|---|
| CZT HV Monitor | 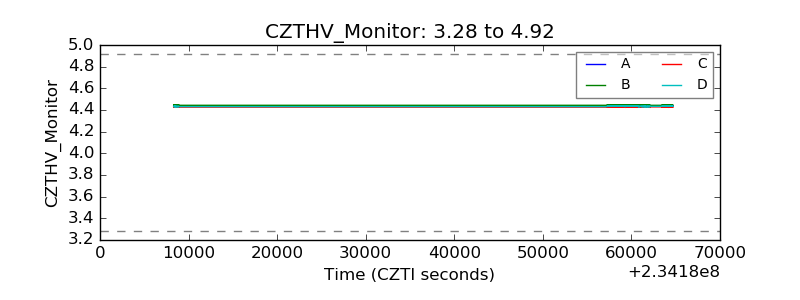 |
| D_VDD | 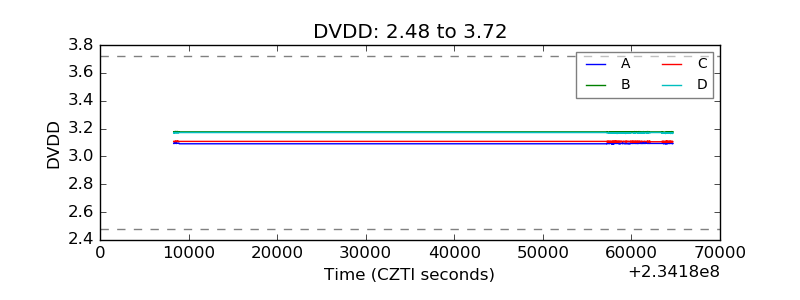 |
| Temperature 1 |  |
| Veto HV Monitor | 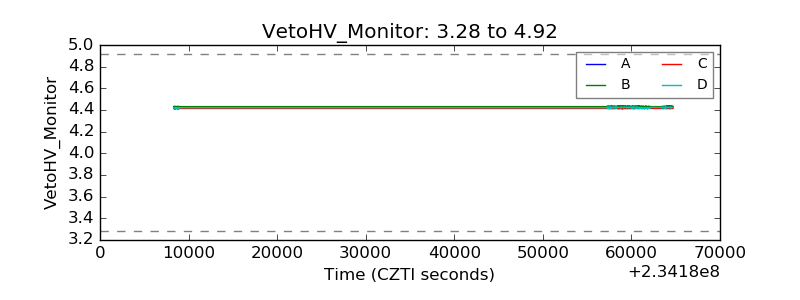 |
| Veto LLD | 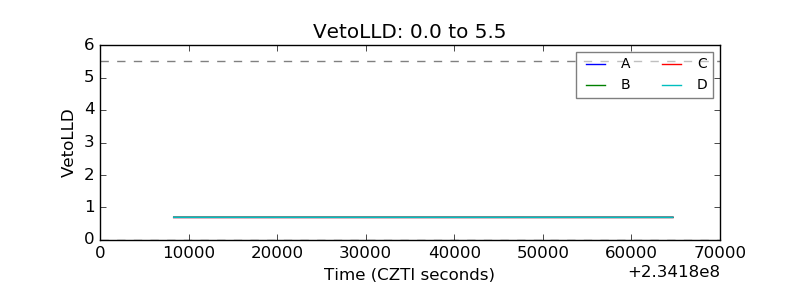 |
| Alpha Counter | 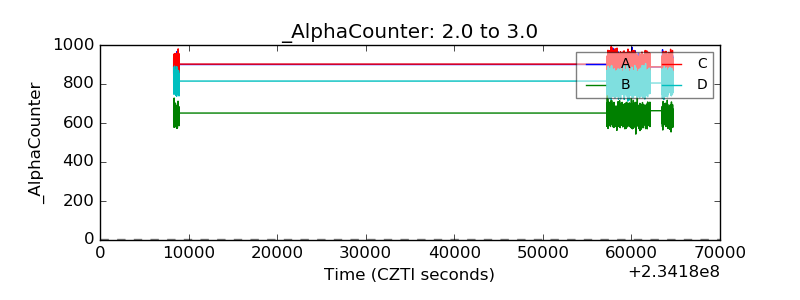 |
| _CPM_Rate | 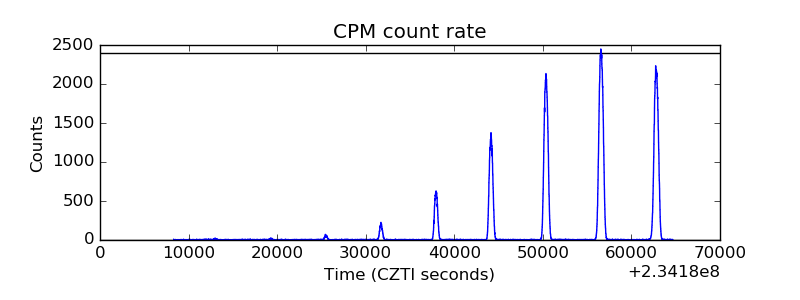 |
| CZT Counter | 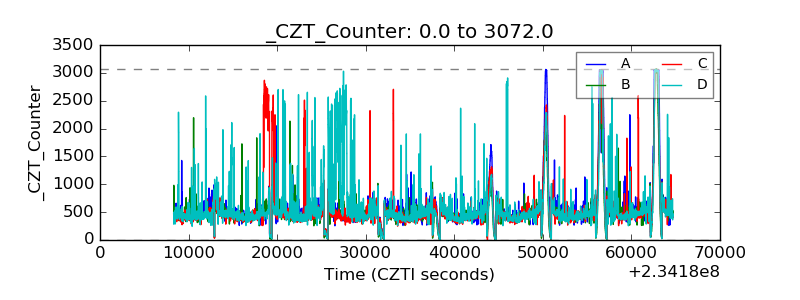 |
| +2.5 Volts monitor |  |
| +5 Volts monitor |  |
| _ROLL_ROT | 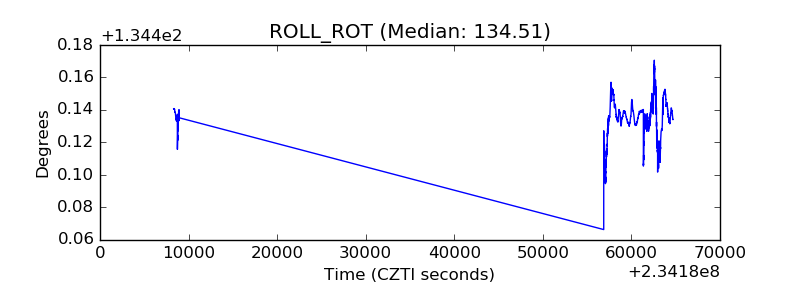 |
| _Roll_DEC | 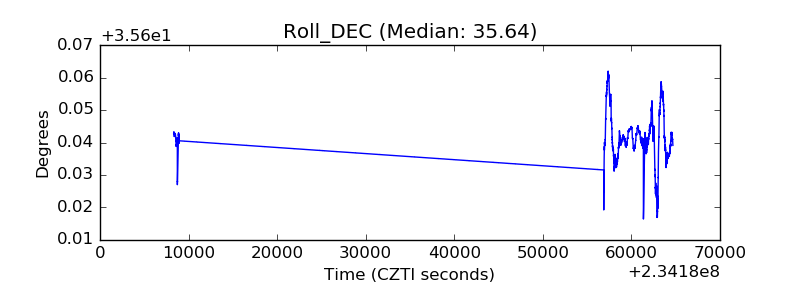 |
| _Roll_RA | 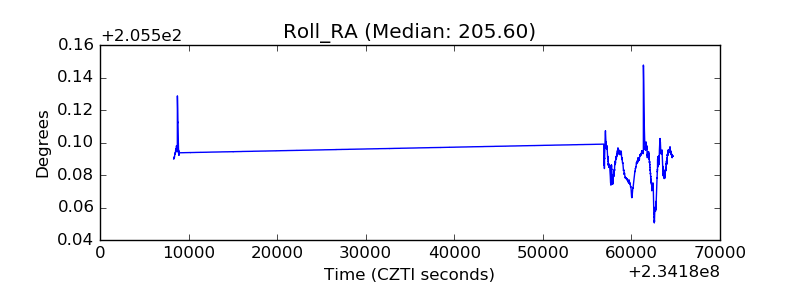 |
| Veto Counter | 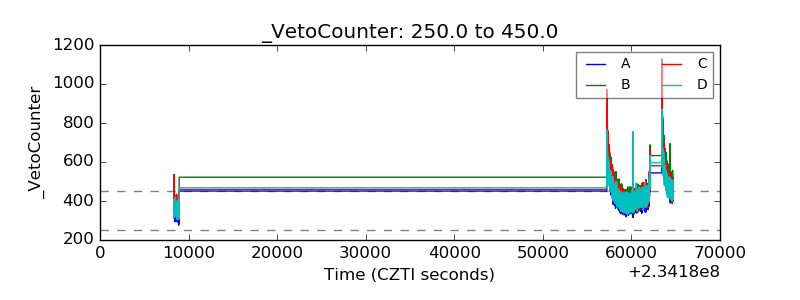 |