| Param | Original file | Final file |
|---|---|---|
| Filename | modeM0/AS1A03_120T01_9000001266_09104cztM0_level2.evt | modeM0/AS1A03_120T01_9000001266_09104cztM0_level2_quad_clean.evt |
| Size (bytes) | 639,118,080 | 76,697,280 |
| Size | 609.5 MB | 73.1 MB |
| Events in quadrant A | 4,859,786 | 433,181 |
| Events in quadrant B | 4,650,686 | 444,344 |
| Events in quadrant C | 4,381,050 | 427,669 |
| Events in quadrant D | 4,871,623 | 410,339 |
| Mode M9 | |||
|---|---|---|---|
| Quadrant | BADHDUFLAG | Total packets | Discarded packets |
| A | 0 | 15 | 0 |
| B | 0 | 15 | 0 |
| C | 0 | 15 | 0 |
| D | 0 | 15 | 0 |
| Mode M0 | |||
|---|---|---|---|
| Quadrant | BADHDUFLAG | Total packets | Discarded packets |
| A | 0 | 19843 | 127 |
| B | 0 | 19118 | 109 |
| C | 0 | 18689 | 98 |
| D | 0 | 20307 | 131 |
| Mode SS | |||
|---|---|---|---|
| Quadrant | BADHDUFLAG | Total packets | Discarded packets |
| A | 0 | 180 | 0 |
| B | 0 | 180 | 0 |
| C | 0 | 180 | 0 |
| D | 0 | 180 | 0 |
| Quadrant | Total seconds | Saturated seconds | Saturation percentage |
|---|---|---|---|
| A | 8731 | 262 | 3.000802% |
| B | 8732 | 267 | 3.057719% |
| C | 8739 | 158 | 1.807987% |
| D | 8737 | 226 | 2.586700% |
Noise dominated data is calculated using 1-second bins in cleaned event files. If a bin has >2000 counts, and if more than 50% of those come from <1% of pixels, then it is considered to be noise-dominated and hence unusable.
| Quadrant | # 1 sec bins | Bins with >0 counts | Bins with >2000 counts | High rate bins dominated by noise | Noise dominated (total time) | Noise dominated (detector-on time) | Marked lightcurve |
|---|---|---|---|---|---|---|---|
| A | 60116 | 8778 | 0 | 0 | 0.00% | 0.00% | 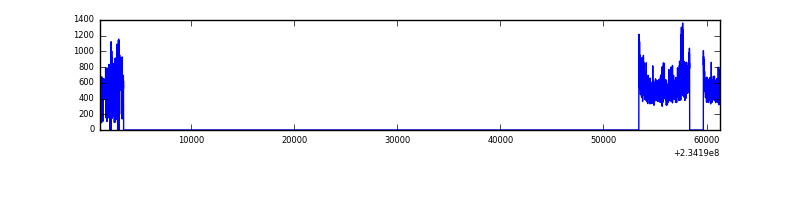 |
| B | 60116 | 8777 | 0 | 0 | 0.00% | 0.00% |  |
| C | 60116 | 8784 | 5 | 5 | 0.01% | 0.06% |  |
| D | 60116 | 8781 | 55 | 55 | 0.09% | 0.63% | 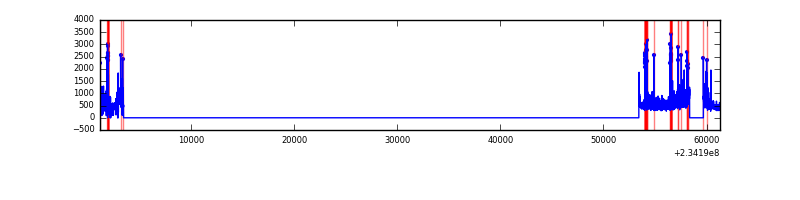 |
Top three noisy pixels from each quadrant. If the there are fewer than three noisy pixels in the level2.evt file, extra rows are filled as -1
| Pixel properties | Quadrant properties | ||||||
|---|---|---|---|---|---|---|---|
| Quadrant | DetID | PixID | Counts | Sigma | Mean | Median | Sigma |
| A | 8 | 5 | 428279 | 1845.29 | 1142 | 1116 | 231.5 |
| A | 1 | 162 | 28078 | 116.47 | 1142 | 1116 | 231.5 |
| A | 0 | 226 | 10662 | 41.24 | 1142 | 1116 | 231.5 |
| B | 0 | 214 | 112091 | 508.76 | 1150 | 1124 | 218.1 |
| B | 0 | 229 | 27054 | 118.88 | 1150 | 1124 | 218.1 |
| B | 10 | 252 | 25775 | 113.02 | 1150 | 1124 | 218.1 |
| C | 14 | 67 | 45402 | 173.84 | 1103 | 1108 | 254.8 |
| C | 14 | 234 | 30795 | 116.51 | 1103 | 1108 | 254.8 |
| C | 13 | 61 | 8276 | 28.13 | 1103 | 1108 | 254.8 |
| D | 1 | 52 | 166684 | 604.89 | 1087 | 1059 | 273.8 |
| D | 13 | 104 | 123736 | 448.04 | 1087 | 1059 | 273.8 |
| D | 10 | 199 | 114198 | 413.2 | 1087 | 1059 | 273.8 |
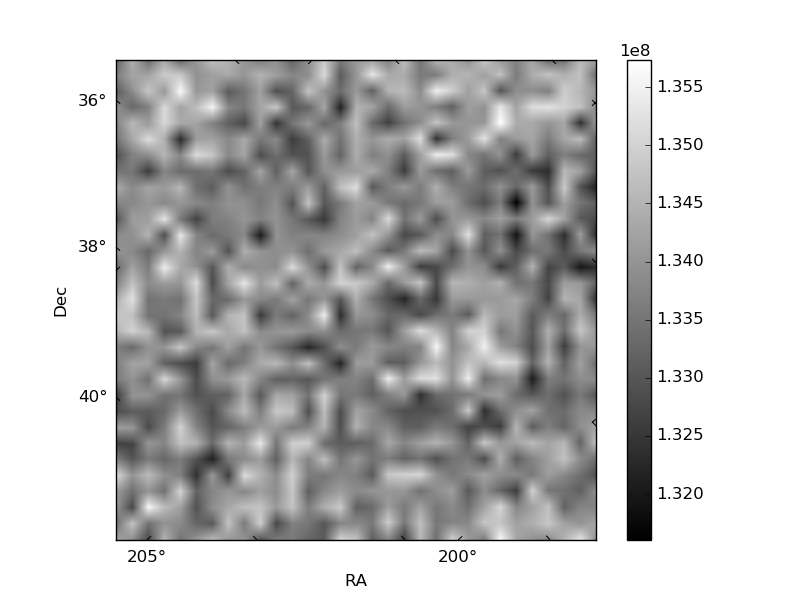
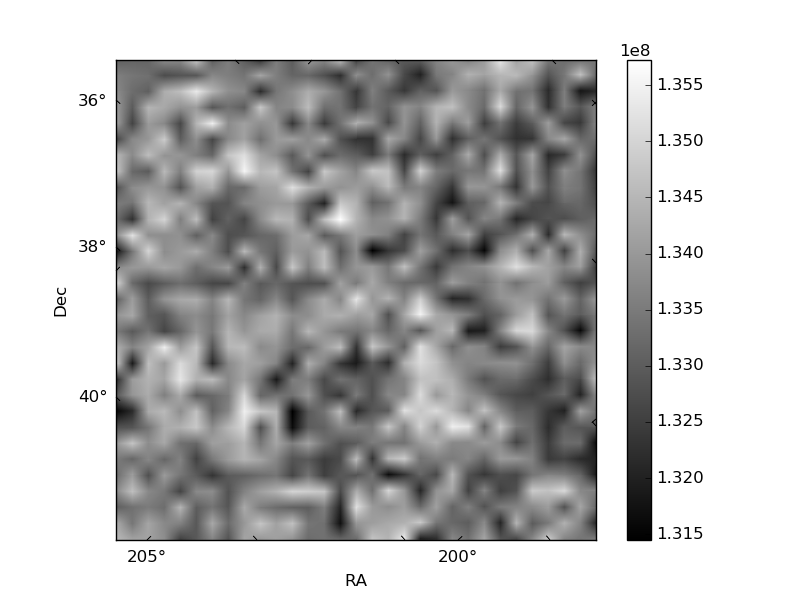
Histogram calculated using DETX and DETY for each event in the final _common_clean file
| Quadrant A | 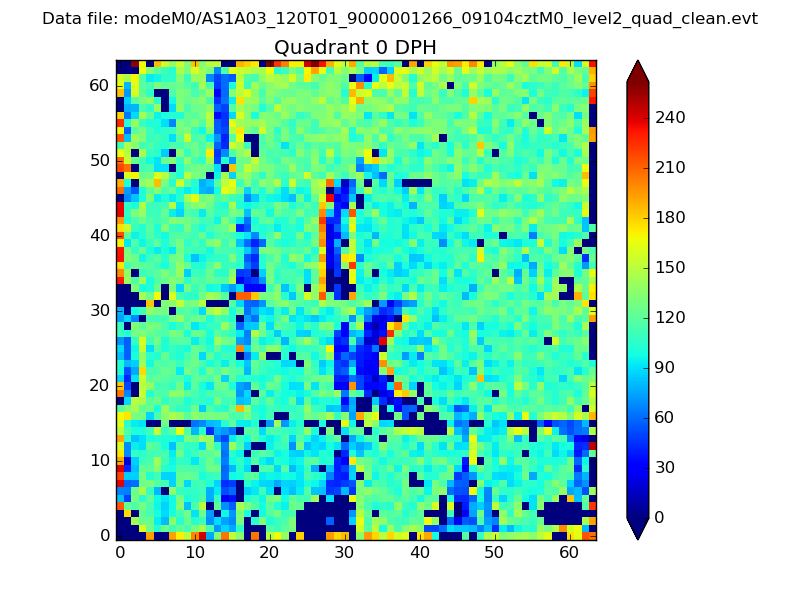 |
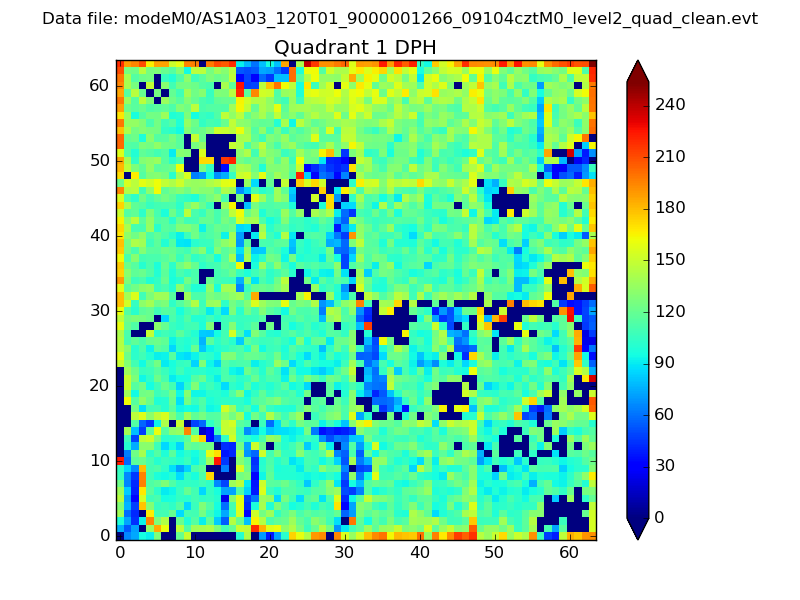 |
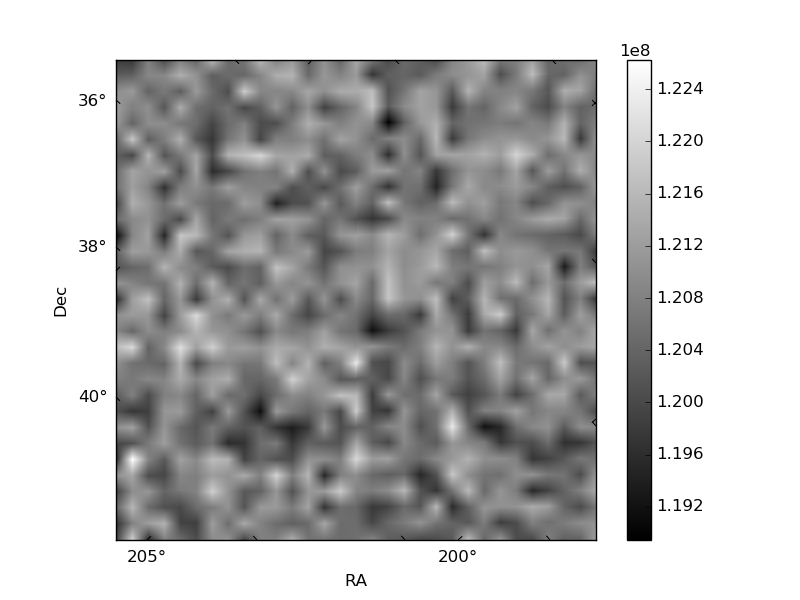
Quadrant B |
|---|---|---|---|
| Quadrant D |  |
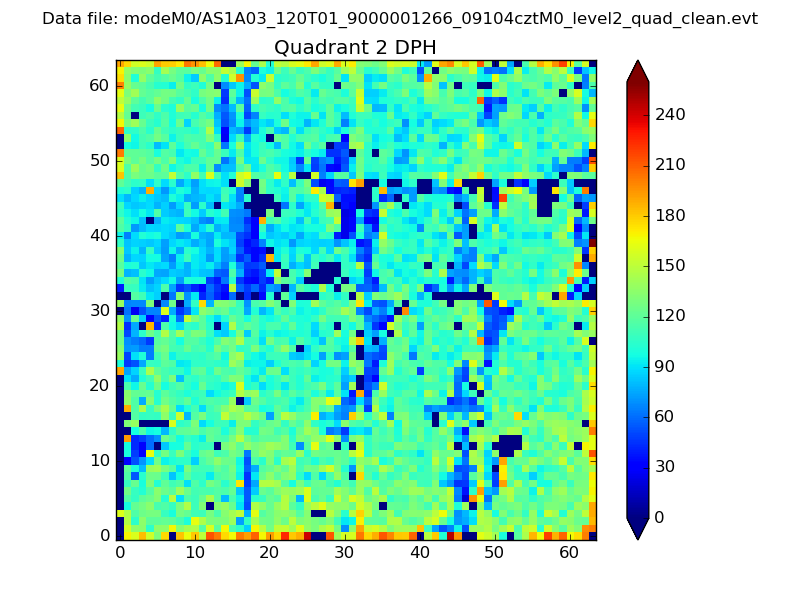 |
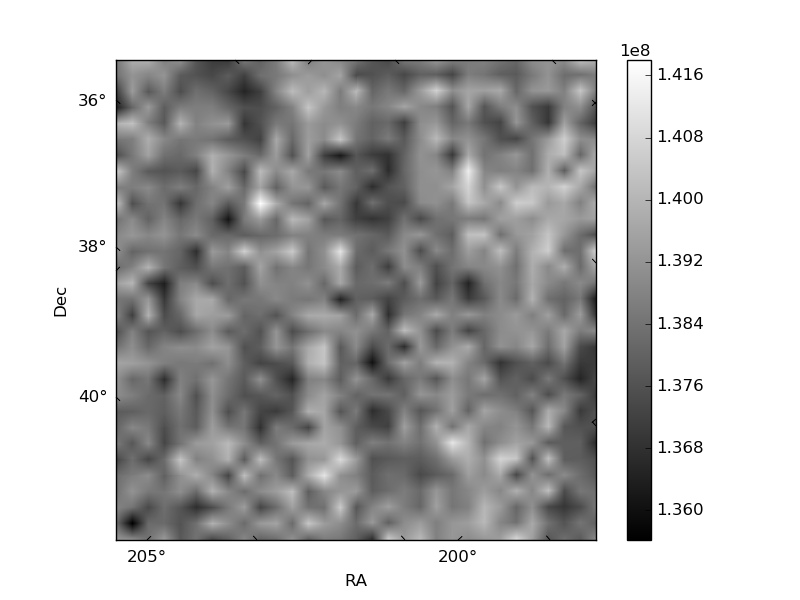
Quadrant C |
| Plot type | Count rate plots | Images |
|---|---|---|
| Comparison with Poisson distribution Blue bars denote a histogram of data divided into 1 sec bins. Red curve is a Poisson curve with rate = median count rate of data. |
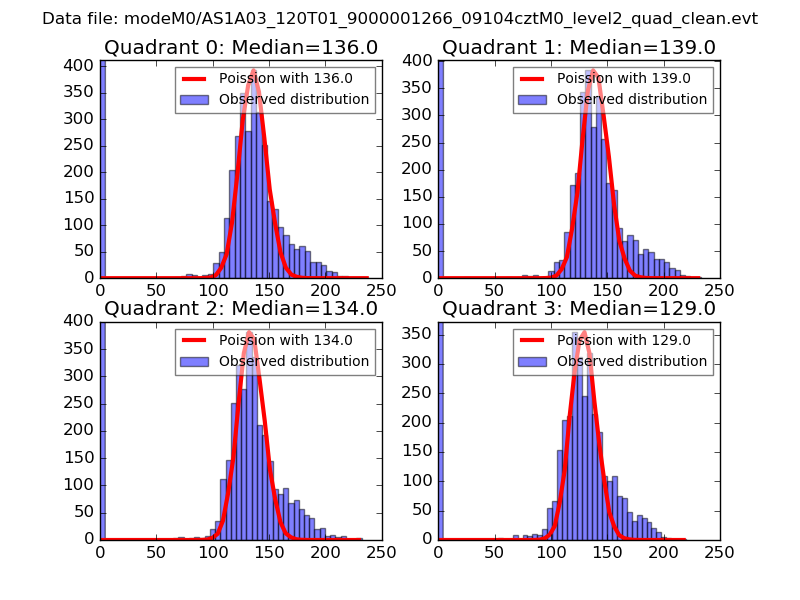 |
 |
| Quadrant-wise count rates Data is divided into 100 sec bins |
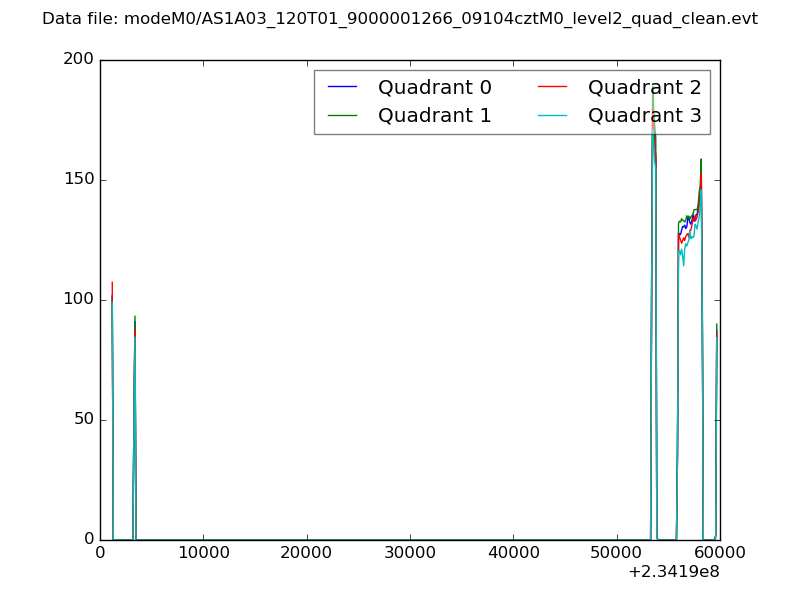 |
|
| Module-wise count rates for Quadrant A Data is divided into 100 sec bins |
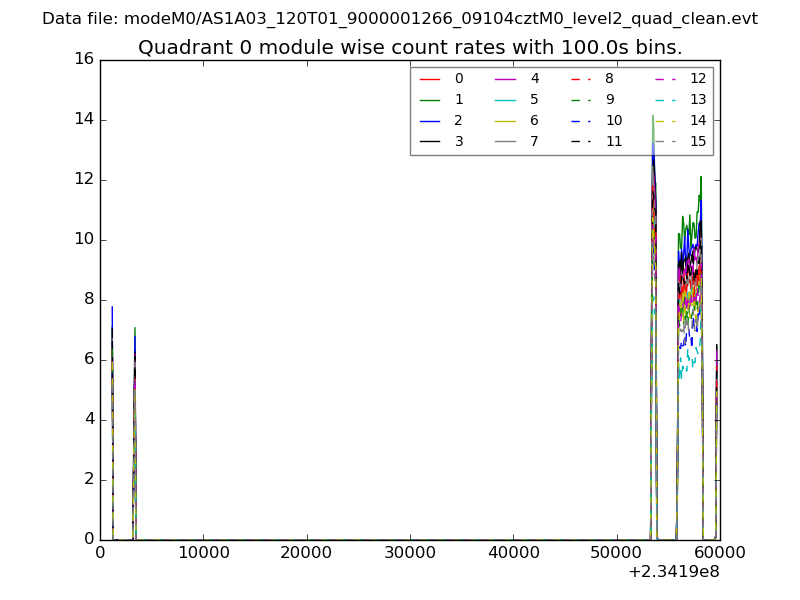 |
 |
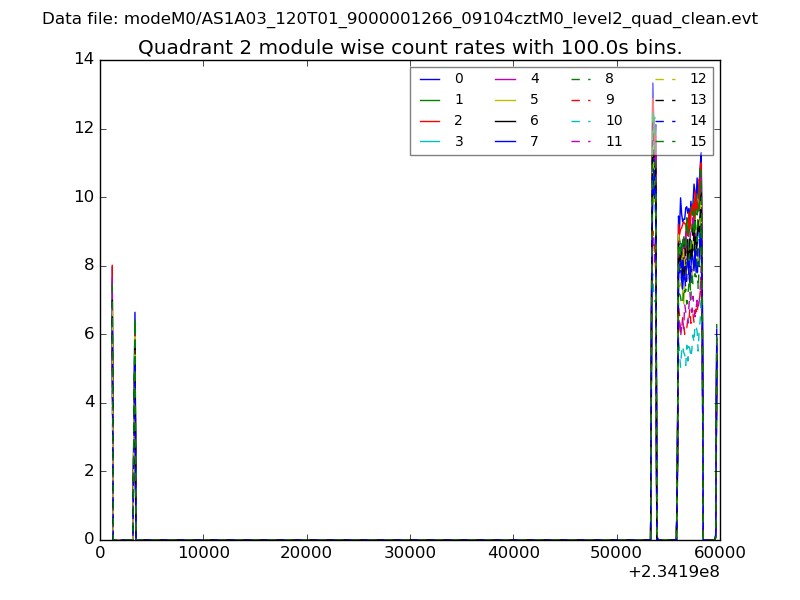
| Module-wise count rates for Quadrant B Data is divided into 100 sec bins |
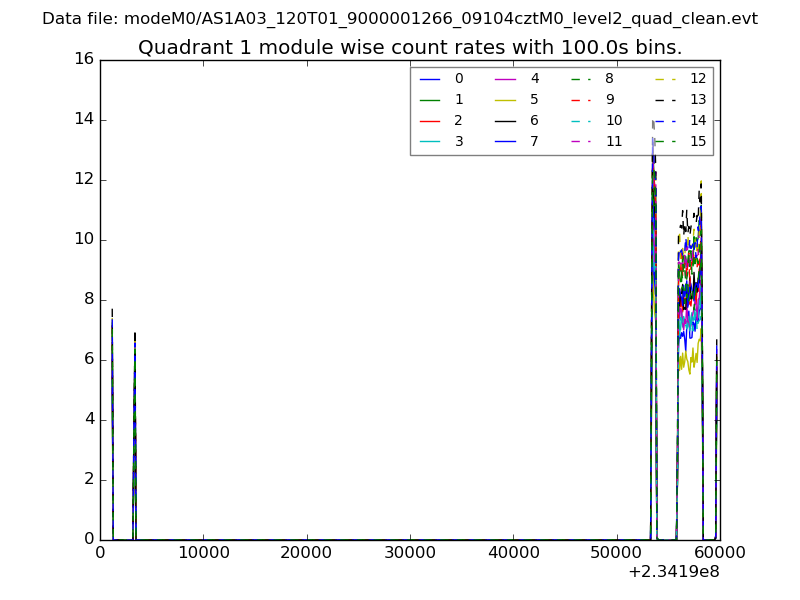 |
 |
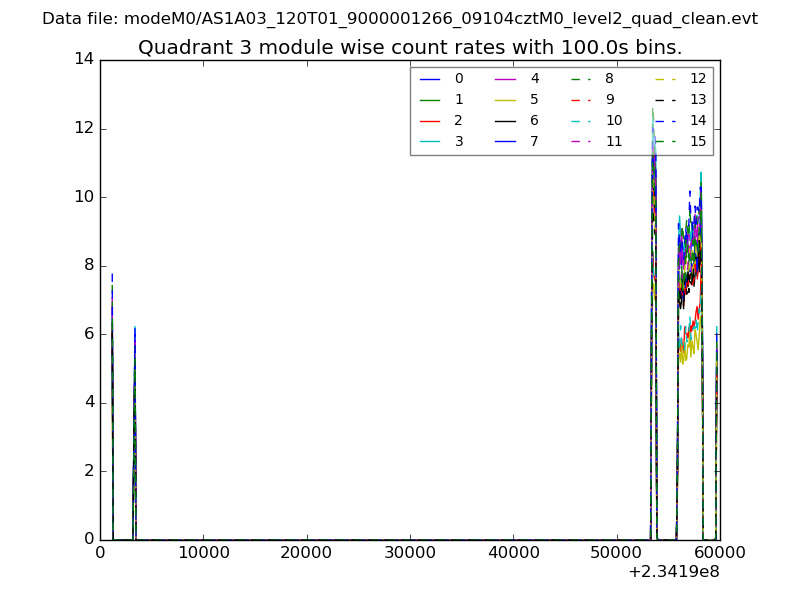
| Module-wise count rates for Quadrant C Data is divided into 100 sec bins |
 |
 |
| Module-wise count rates for Quadrant D Data is divided into 100 sec bins |
 |
 |
| Parameter | Plot |
|---|---|
| CZT HV Monitor | 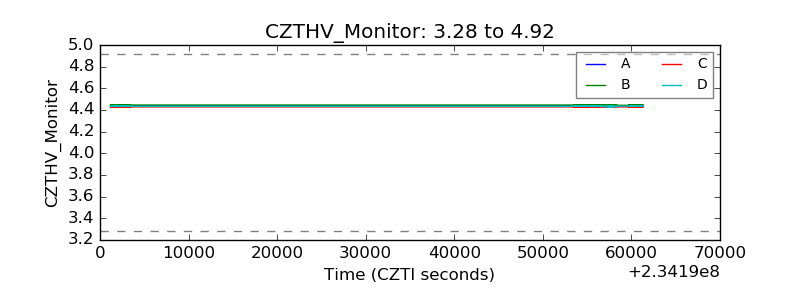 |
| D_VDD | 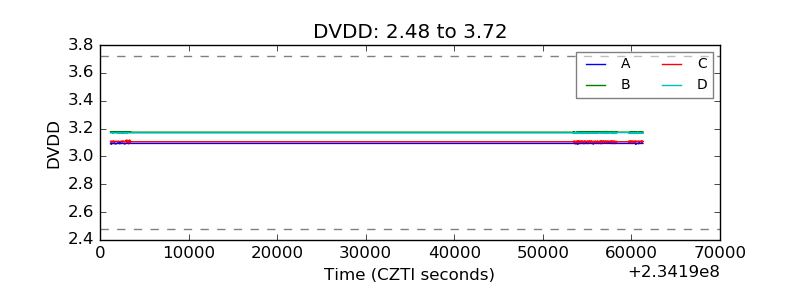 |
| Temperature 1 | 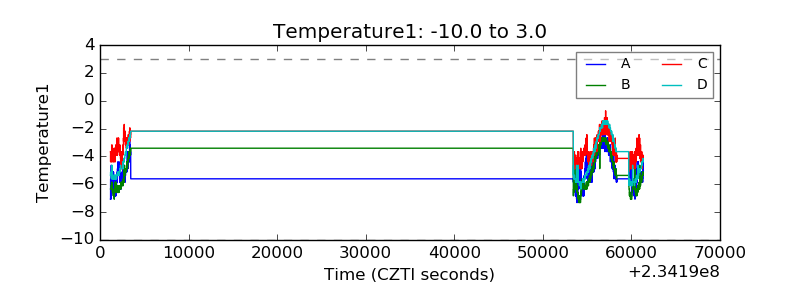 |
| Veto HV Monitor | 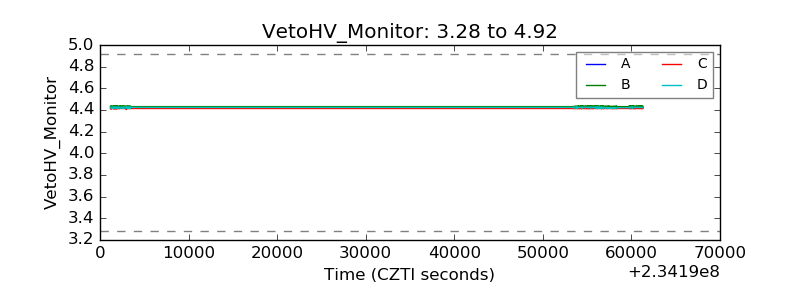 |
| Veto LLD | 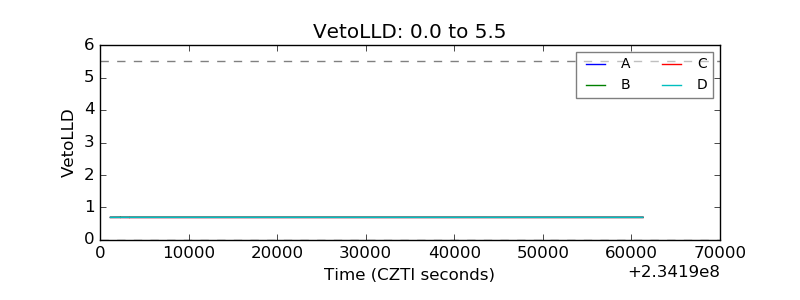 |
| Alpha Counter | 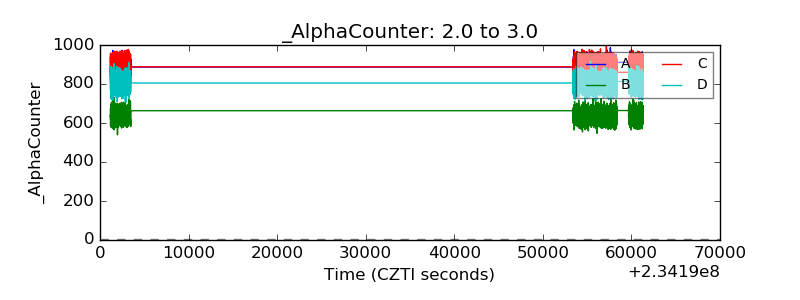 |
| _CPM_Rate | 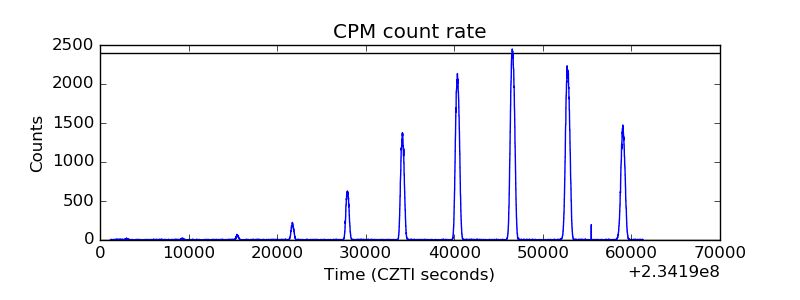 |
| CZT Counter | 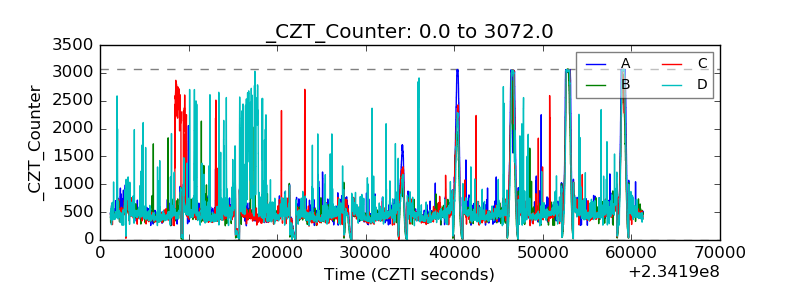 |
| +2.5 Volts monitor |  |
| +5 Volts monitor |  |
| _ROLL_ROT | 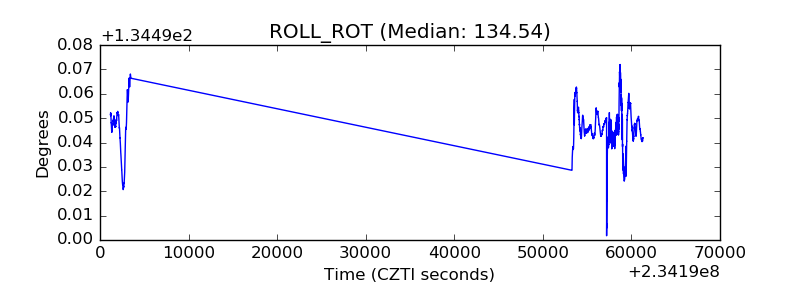 |
| _Roll_DEC | 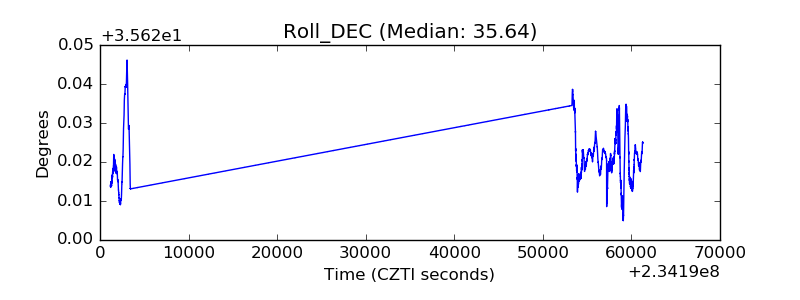 |
| _Roll_RA | 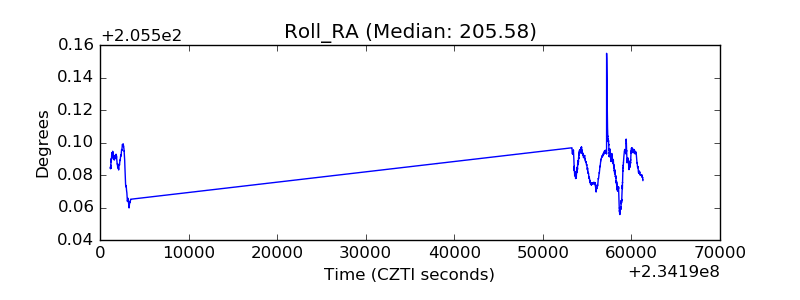 |
| Veto Counter | 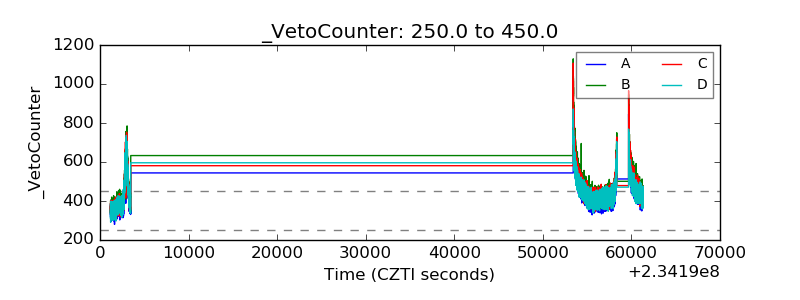 |