| Param | Original file | Final file |
|---|---|---|
| Filename | modeM0/AS1A03_120T01_9000001266_09106cztM0_level2.evt | modeM0/AS1A03_120T01_9000001266_09106cztM0_level2_quad_clean.evt |
| Size (bytes) | 302,048,640 | 44,475,840 |
| Size | 288.1 MB | 42.4 MB |
| Events in quadrant A | 2,060,725 | 274,325 |
| Events in quadrant B | 1,852,259 | 278,023 |
| Events in quadrant C | 1,740,543 | 268,572 |
| Events in quadrant D | 3,228,241 | 250,233 |
| Mode M9 | |||
|---|---|---|---|
| Quadrant | BADHDUFLAG | Total packets | Discarded packets |
| A | 0 | 13 | 0 |
| B | 0 | 13 | 0 |
| C | 0 | 13 | 0 |
| D | 0 | 13 | 0 |
| Mode M0 | |||
|---|---|---|---|
| Quadrant | BADHDUFLAG | Total packets | Discarded packets |
| A | 0 | 8570 | 1 |
| B | 0 | 7953 | 1 |
| C | 0 | 7876 | 1 |
| D | 0 | 12253 | 1 |
| Mode SS | |||
|---|---|---|---|
| Quadrant | BADHDUFLAG | Total packets | Discarded packets |
| A | 0 | 80 | 0 |
| B | 0 | 80 | 0 |
| C | 0 | 80 | 0 |
| D | 0 | 80 | 0 |
| Quadrant | Total seconds | Saturated seconds | Saturation percentage |
|---|---|---|---|
| A | 3894 | 58 | 1.489471% |
| B | 3894 | 31 | 0.796097% |
| C | 3894 | 24 | 0.616333% |
| D | 3894 | 218 | 5.598356% |
Noise dominated data is calculated using 1-second bins in cleaned event files. If a bin has >2000 counts, and if more than 50% of those come from <1% of pixels, then it is considered to be noise-dominated and hence unusable.
| Quadrant | # 1 sec bins | Bins with >0 counts | Bins with >2000 counts | High rate bins dominated by noise | Noise dominated (total time) | Noise dominated (detector-on time) | Marked lightcurve |
|---|---|---|---|---|---|---|---|
| A | 5164 | 3894 | 19 | 19 | 0.37% | 0.49% | 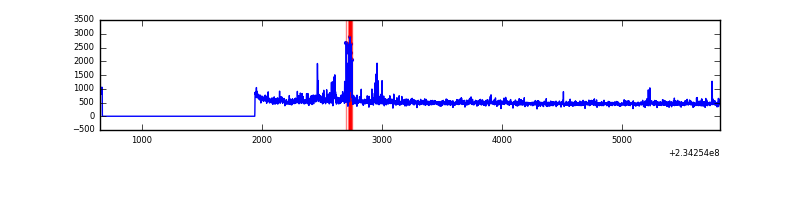 |
| B | 5164 | 3894 | 0 | 0 | 0.00% | 0.00% | 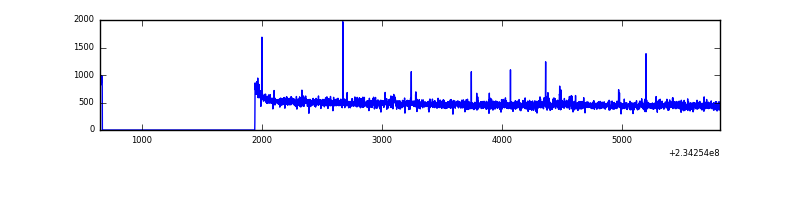 |
| C | 5164 | 3894 | 0 | 0 | 0.00% | 0.00% | 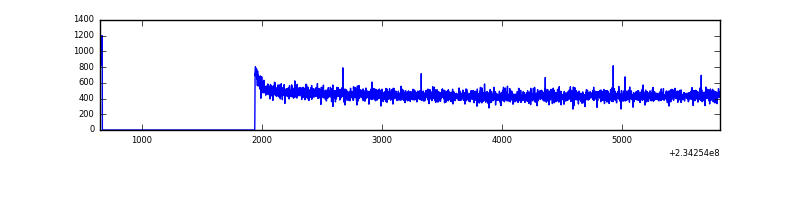 |
| D | 5164 | 3894 | 165 | 165 | 3.20% | 4.24% | 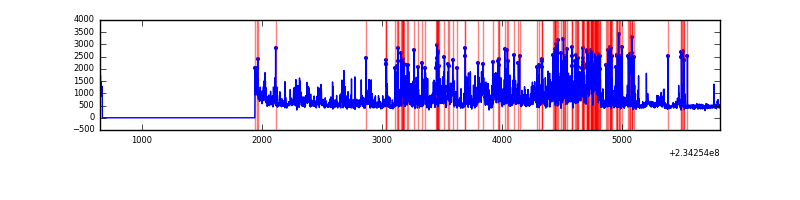 |
Top three noisy pixels from each quadrant. If the there are fewer than three noisy pixels in the level2.evt file, extra rows are filled as -1
| Pixel properties | Quadrant properties | ||||||
|---|---|---|---|---|---|---|---|
| Quadrant | DetID | PixID | Counts | Sigma | Mean | Median | Sigma |
| A | 8 | 5 | 244736 | 2581.23 | 464 | 454 | 94.6 |
| A | 1 | 162 | 12353 | 125.73 | 464 | 454 | 94.6 |
| A | 15 | 174 | 11173 | 113.26 | 464 | 454 | 94.6 |
| B | 0 | 219 | 17215 | 188.97 | 467 | 457 | 88.7 |
| B | 0 | 214 | 14657 | 160.13 | 467 | 457 | 88.7 |
| B | 12 | 111 | 9537 | 102.39 | 467 | 457 | 88.7 |
| C | 13 | 61 | 3346 | 28.37 | 445 | 447 | 102.2 |
| C | 8 | 222 | 1323 | 8.57 | 445 | 447 | 102.2 |
| C | 7 | 159 | 1163 | 7.01 | 445 | 447 | 102.2 |
| D | 1 | 52 | 1454699 | 13502.28 | 438 | 426 | 107.7 |
| D | 7 | 71 | 34650 | 317.75 | 438 | 426 | 107.7 |
| D | 12 | 233 | 27310 | 249.61 | 438 | 426 | 107.7 |
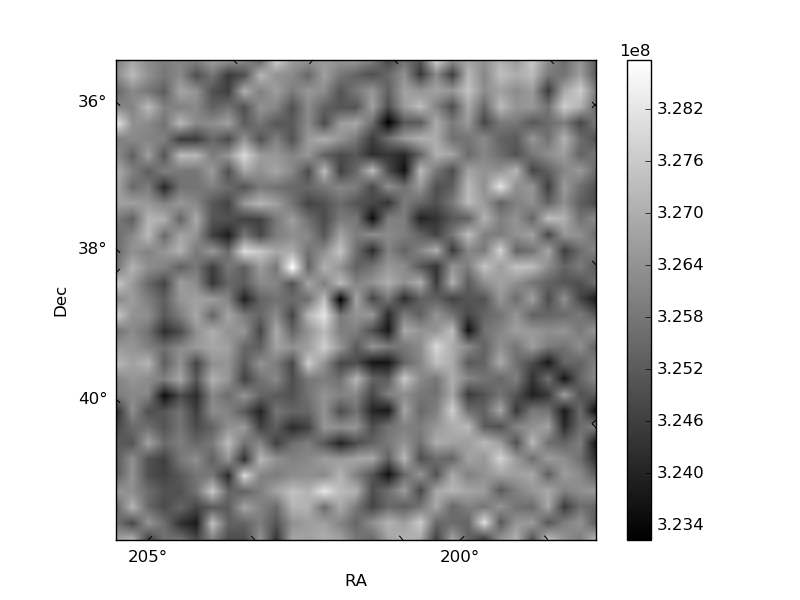
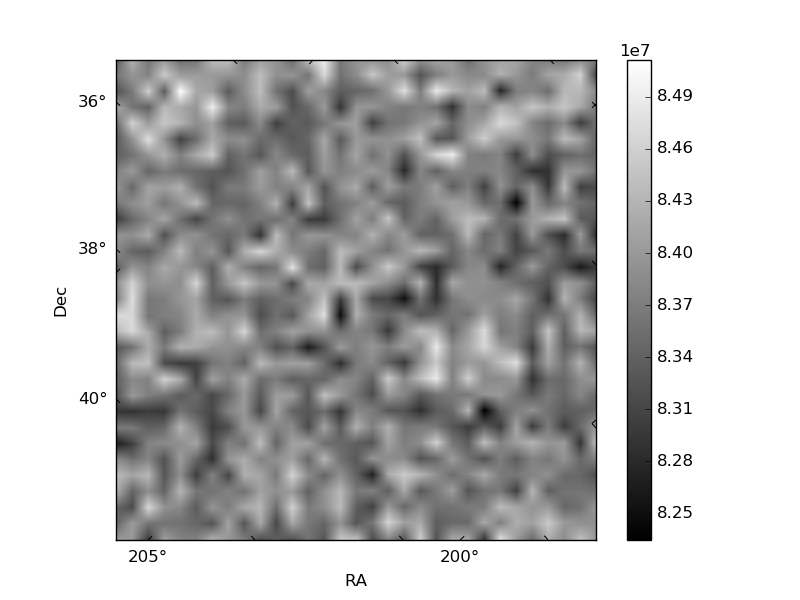
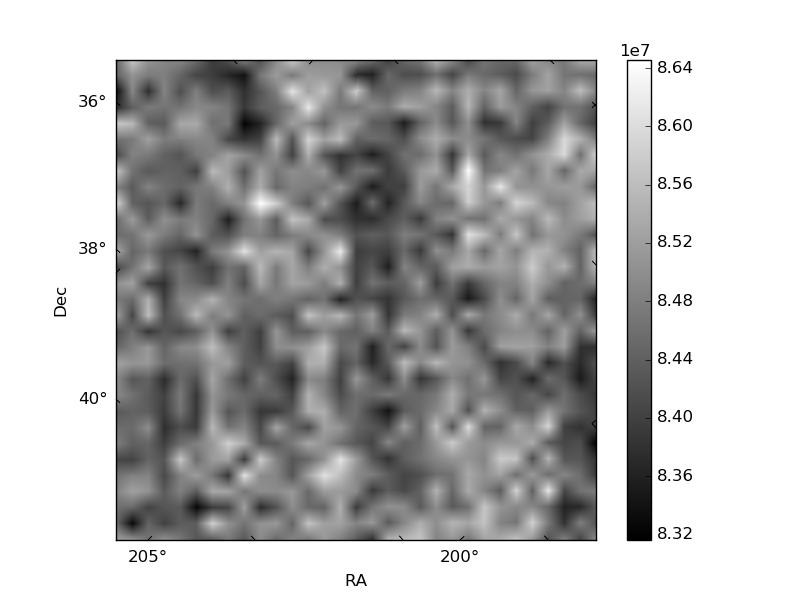
Histogram calculated using DETX and DETY for each event in the final _common_clean file
| Quadrant A | 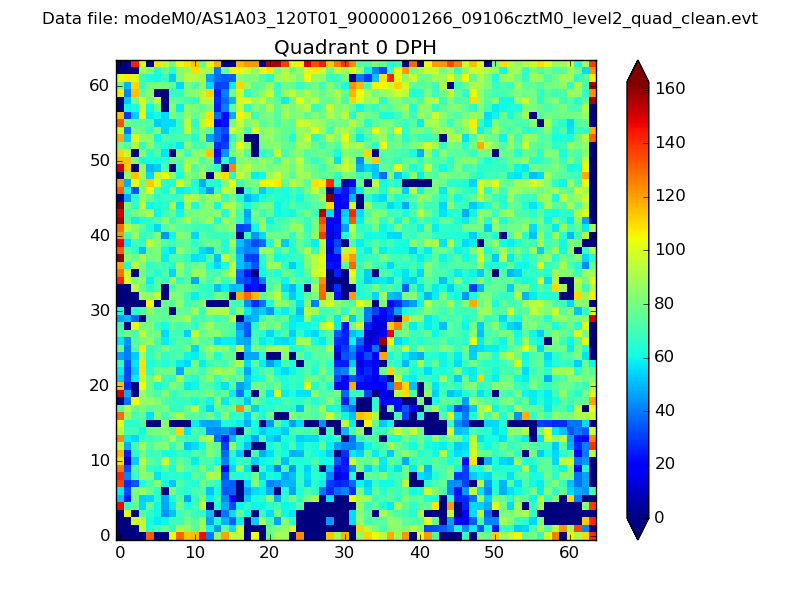 |
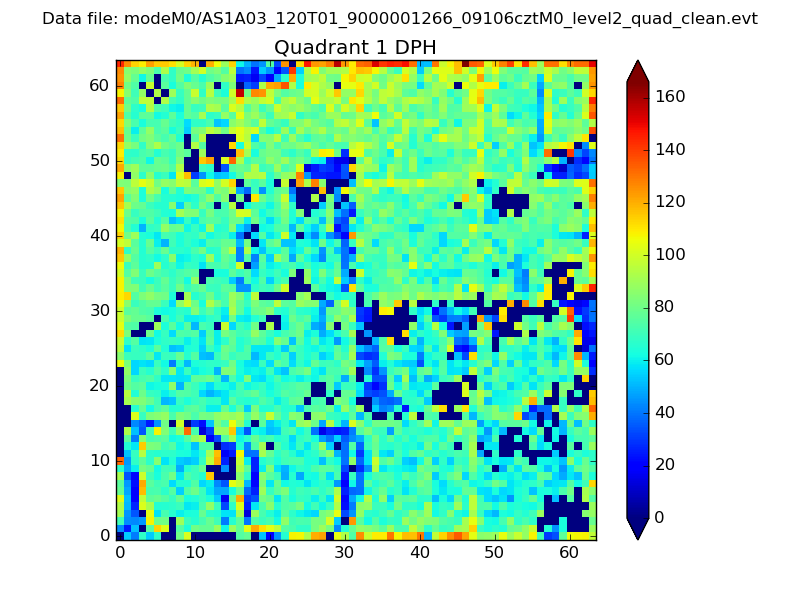 |
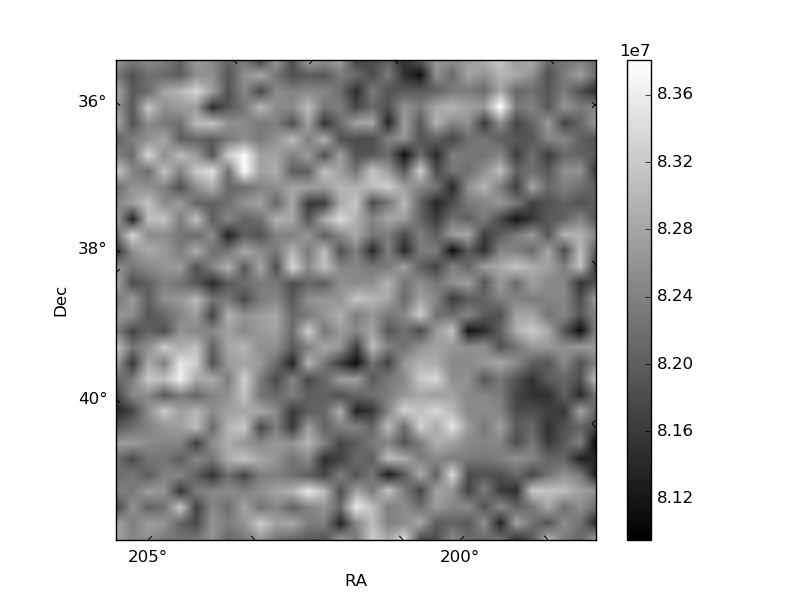
Quadrant B |
|---|---|---|---|
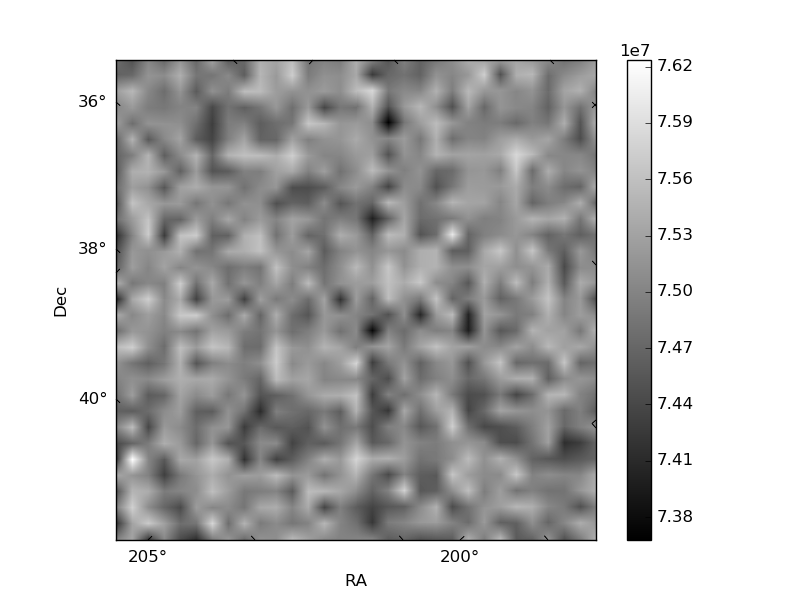
| Quadrant D | 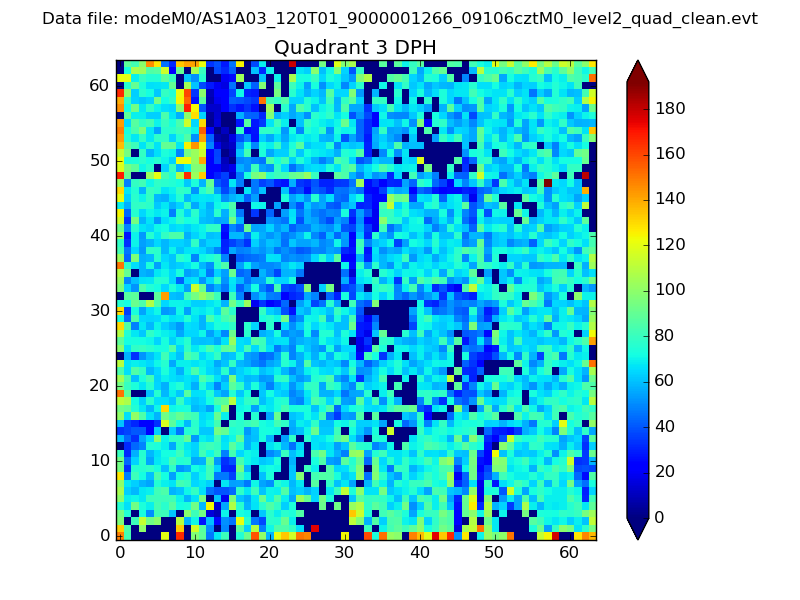 |
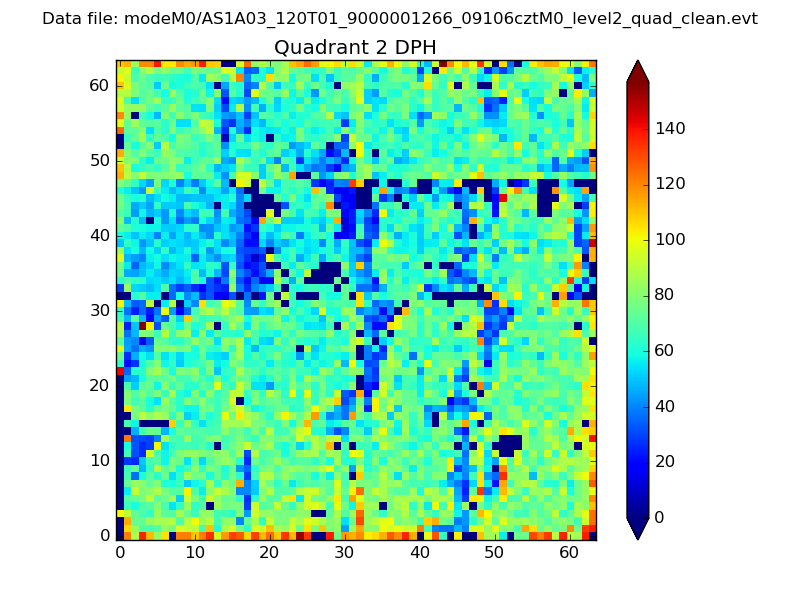 |
Quadrant C |
| Plot type | Count rate plots | Images |
|---|---|---|
| Comparison with Poisson distribution Blue bars denote a histogram of data divided into 1 sec bins. Red curve is a Poisson curve with rate = median count rate of data. |
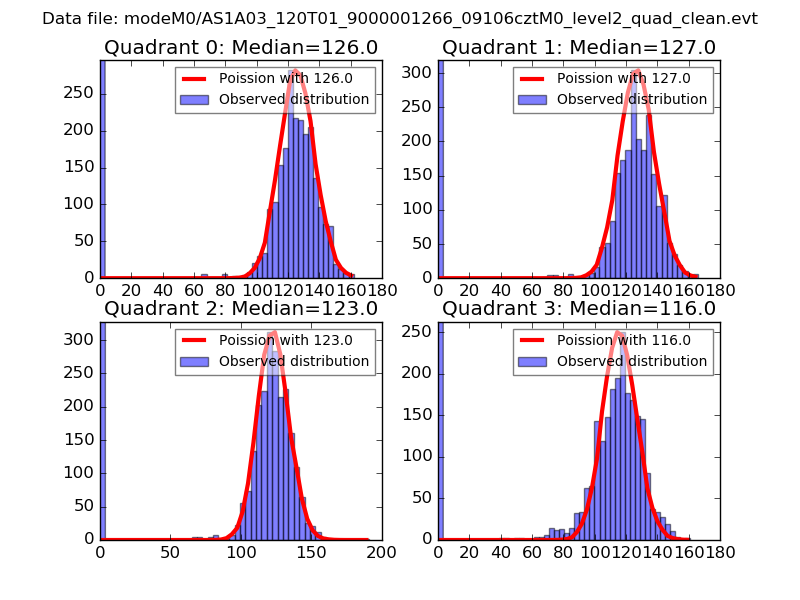 |
 |
| Quadrant-wise count rates Data is divided into 100 sec bins |
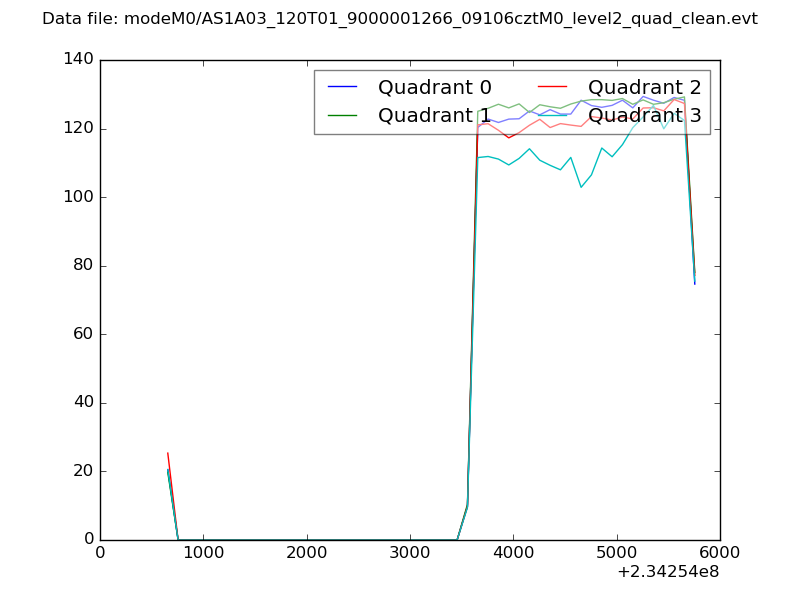 |
|
| Module-wise count rates for Quadrant A Data is divided into 100 sec bins |
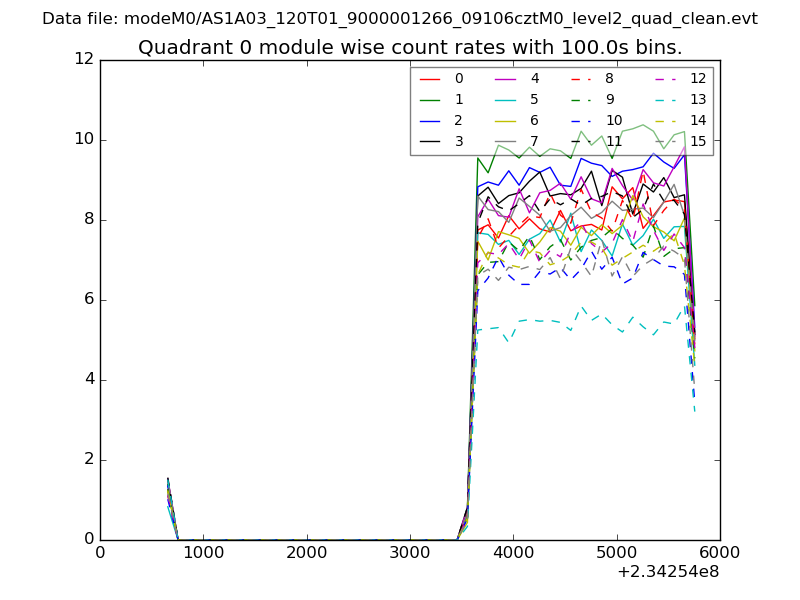 |
 |
| Module-wise count rates for Quadrant B Data is divided into 100 sec bins |
 |
 |
| Module-wise count rates for Quadrant C Data is divided into 100 sec bins |
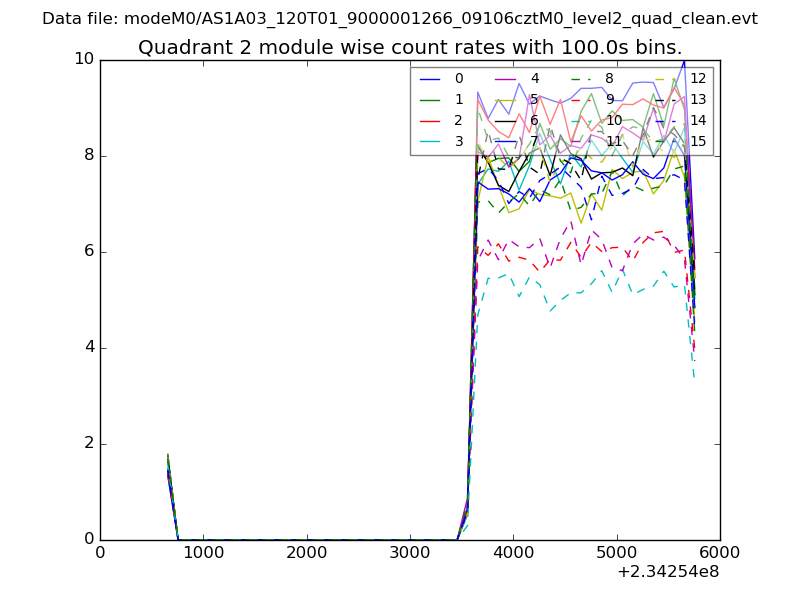 |
 |
| Module-wise count rates for Quadrant D Data is divided into 100 sec bins |
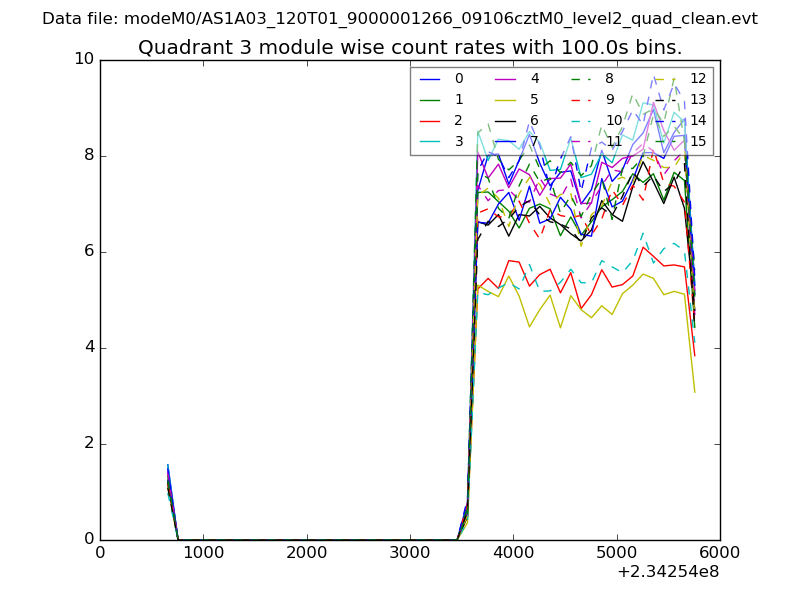 |
 |
| Parameter | Plot |
|---|---|
| CZT HV Monitor | 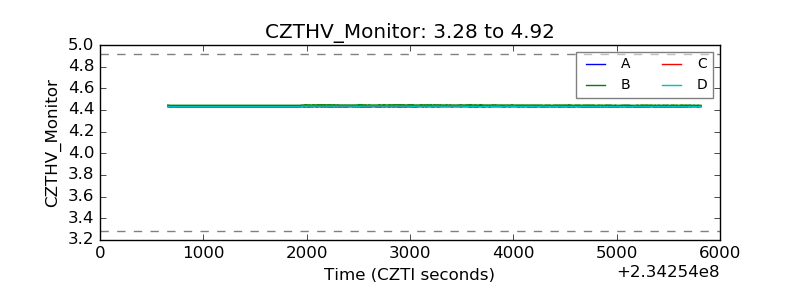 |
| D_VDD | 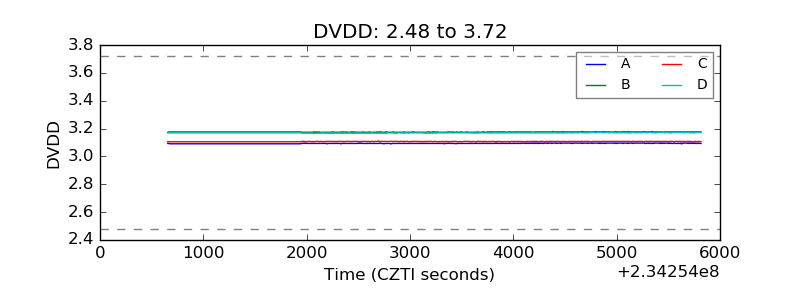 |
| Temperature 1 | 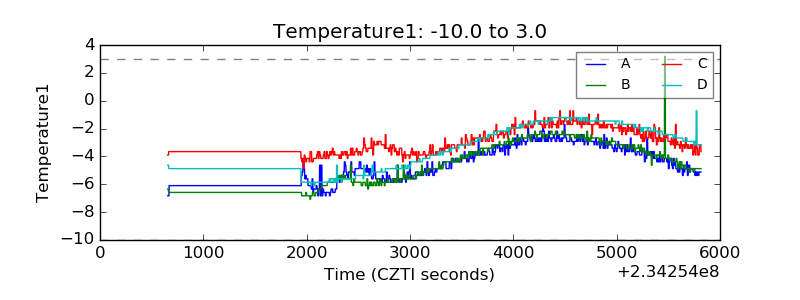 |
| Veto HV Monitor | 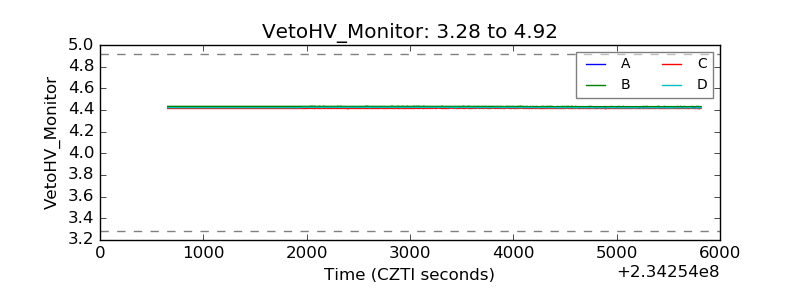 |
| Veto LLD | 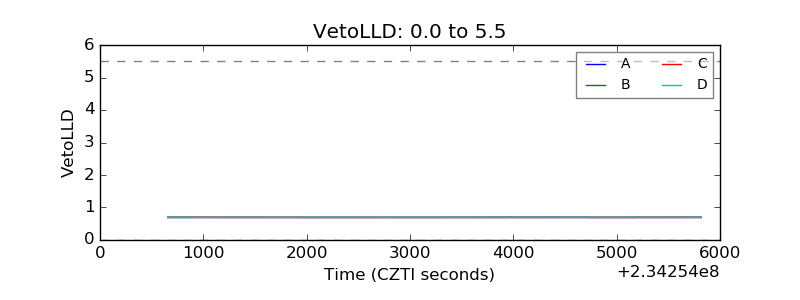 |
| Alpha Counter | 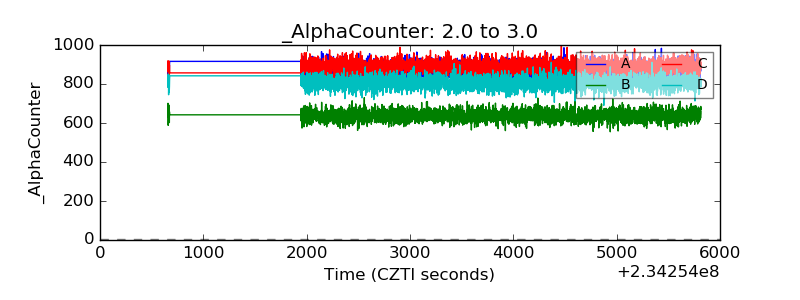 |
| _CPM_Rate | 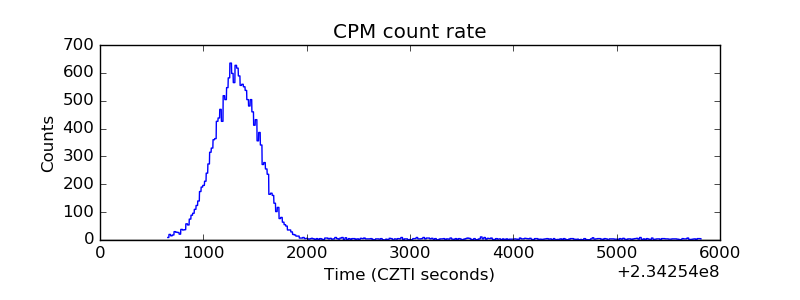 |
| CZT Counter | 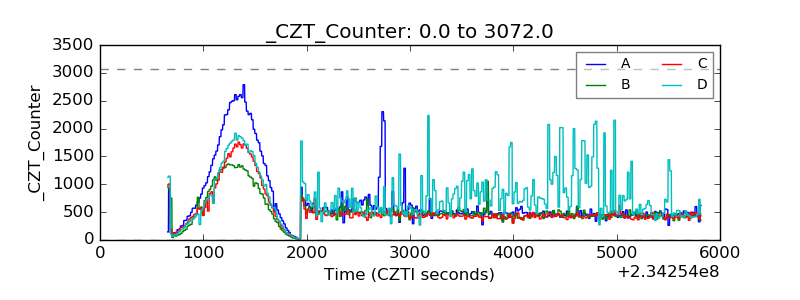 |
| +2.5 Volts monitor |  |
| +5 Volts monitor |  |
| _ROLL_ROT | 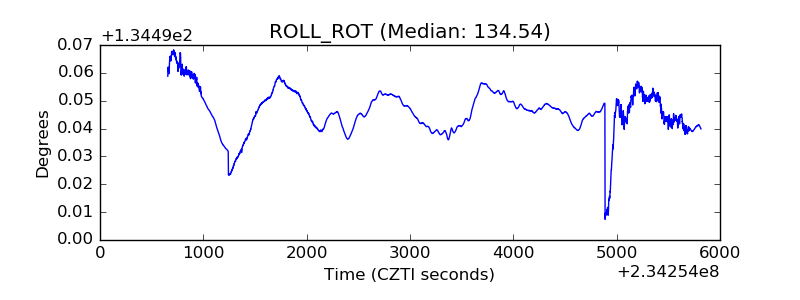 |
| _Roll_DEC | 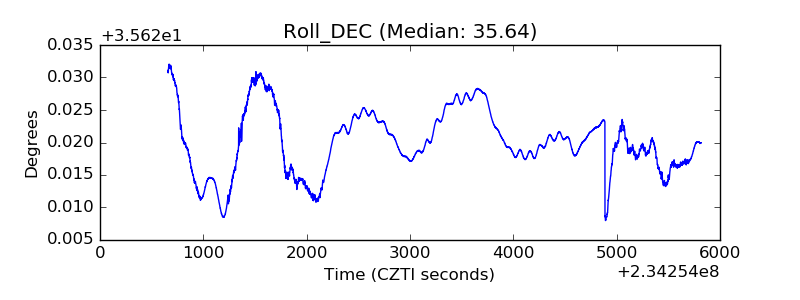 |
| _Roll_RA | 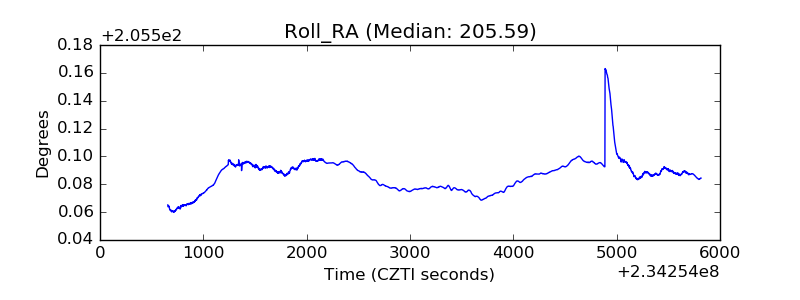 |
| Veto Counter | 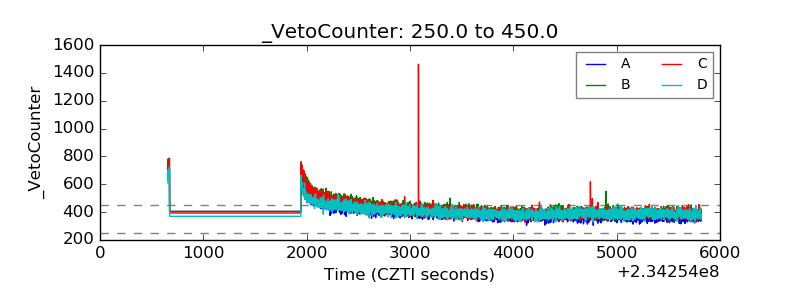 |