| Param | Original file | Final file |
|---|---|---|
| Filename | modeM0/AS1G07_057T04_9000001264cztM0_level2.fits | modeM0/AS1G07_057T04_9000001264cztM0_level2_quad_clean.evt |
| Size (bytes) | 426,263,040 | 406,578,240 |
| Size | 406.5 MB | 387.7 MB |
| Events in quadrant A | 2,556,656 | 2,377,033 |
| Events in quadrant B | 2,523,564 | 2,439,993 |
| Events in quadrant C | 2,572,168 | 2,314,752 |
| Events in quadrant D | 2,227,198 | 2,152,398 |
| Mode SS | |||
|---|---|---|---|
| Quadrant | BADHDUFLAG | Total packets | Discarded packets |
| A | 0 | 894 | 0 |
| B | 0 | 898 | 0 |
| C | 0 | 894 | 0 |
| D | 0 | 896 | 0 |
| Mode M0 | |||
|---|---|---|---|
| Quadrant | BADHDUFLAG | Total packets | Discarded packets |
| A | 0 | 117255 | 0 |
| B | 0 | 94086 | 0 |
| C | 0 | 91774 | 0 |
| D | 0 | 97727 | 0 |
| Mode M9 | |||
|---|---|---|---|
| Quadrant | BADHDUFLAG | Total packets | Discarded packets |
| A | 0 | 69 | 0 |
| B | 0 | 69 | 0 |
| C | 0 | 69 | 0 |
| D | 0 | 69 | 0 |
| Quadrant | Total seconds | Saturated seconds | Saturation percentage |
|---|---|---|---|
| A | 44067 | 1913 | 4.341117% |
| B | 44149 | 904 | 2.047611% |
| C | 44154 | 589 | 1.333967% |
| D | 44128 | 860 | 1.948876% |
Noise dominated data is calculated using 1-second bins in cleaned event files. If a bin has >2000 counts, and if more than 50% of those come from <1% of pixels, then it is considered to be noise-dominated and hence unusable.
| Quadrant | # 1 sec bins | Bins with >0 counts | Bins with >2000 counts | High rate bins dominated by noise | Noise dominated (total time) | Noise dominated (detector-on time) | Marked lightcurve |
|---|---|---|---|---|---|---|---|
| A | 51093 | 44275 | 0 | 0 | 0.00% | 0.00% | 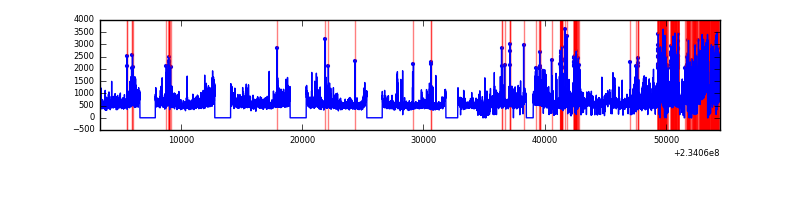 |
| B | 51093 | 44289 | 0 | 0 | 0.00% | 0.00% |  |
| C | 51093 | 44287 | 0 | 0 | 0.00% | 0.00% |  |
| D | 51093 | 44286 | 0 | 0 | 0.00% | 0.00% |  |
Top three noisy pixels from each quadrant. If the there are fewer than three noisy pixels in the level2.evt file, extra rows are filled as -1
| Pixel properties | Quadrant properties | ||||||
|---|---|---|---|---|---|---|---|
| Quadrant | DetID | PixID | Counts | Sigma | Mean | Median | Sigma |
| A | 0 | 29 | 2462 | 10.96 | 666 | 624 | 167.7 |
| A | 7 | 110 | 2086 | 8.72 | 666 | 624 | 167.7 |
| A | 9 | 19 | 1943 | 7.87 | 666 | 624 | 167.7 |
| B | 2 | 9 | 2314 | 12.73 | 666 | 636 | 131.8 |
| B | 3 | 17 | 1702 | 8.09 | 666 | 636 | 131.8 |
| B | 12 | 226 | 1685 | 7.96 | 666 | 636 | 131.8 |
| C | 1 | 80 | 1830 | 6.79 | 679 | 629 | 176.8 |
| C | 1 | 81 | 1796 | 6.6 | 679 | 629 | 176.8 |
| C | 9 | 188 | 1776 | 6.49 | 679 | 629 | 176.8 |
| D | 3 | 14 | 1659 | 6.43 | 634 | 579 | 168.1 |
| D | 7 | 5 | 1627 | 6.23 | 634 | 579 | 168.1 |
| D | 6 | 231 | 1608 | 6.12 | 634 | 579 | 168.1 |
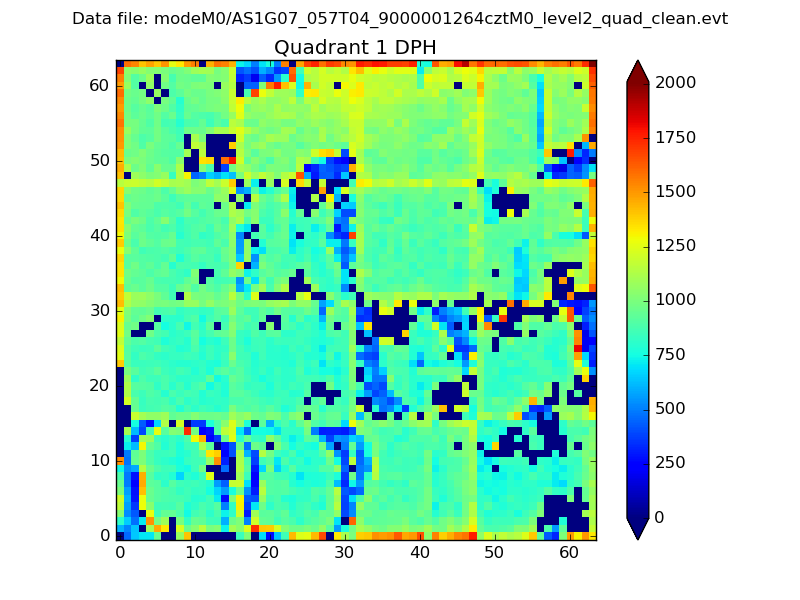
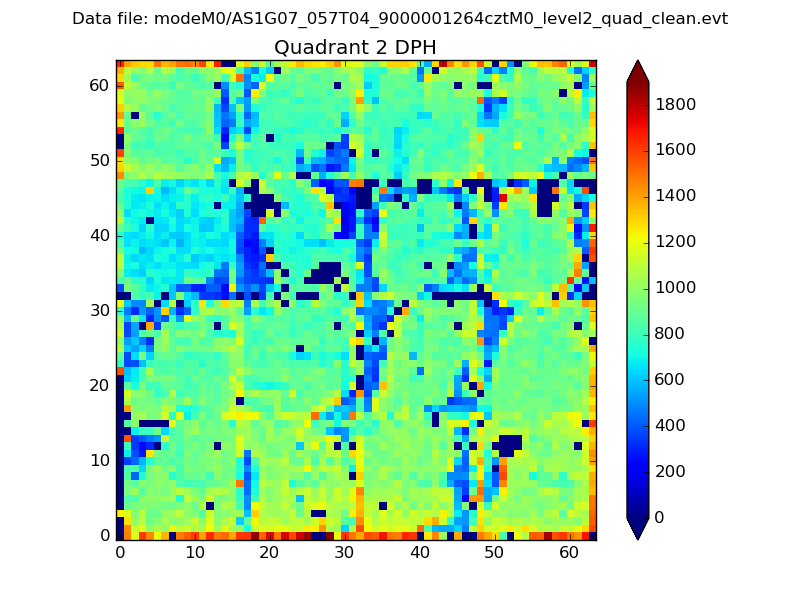
Histogram calculated using DETX and DETY for each event in the final _common_clean file
| Quadrant A |  |
 |
Quadrant B |
|---|---|---|---|
| Quadrant D | 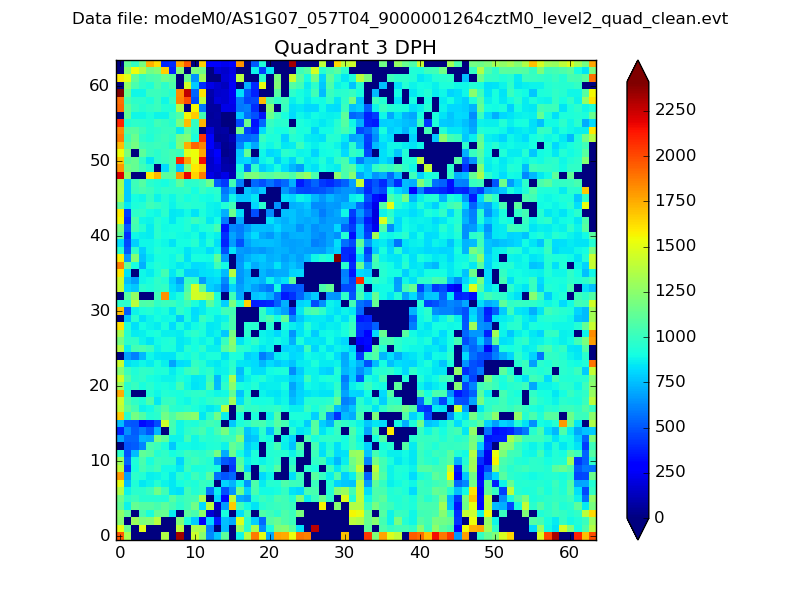 |
 |
Quadrant C |
| Plot type | Count rate plots | Images |
|---|---|---|
| Comparison with Poisson distribution Blue bars denote a histogram of data divided into 1 sec bins. Red curve is a Poisson curve with rate = median count rate of data. |
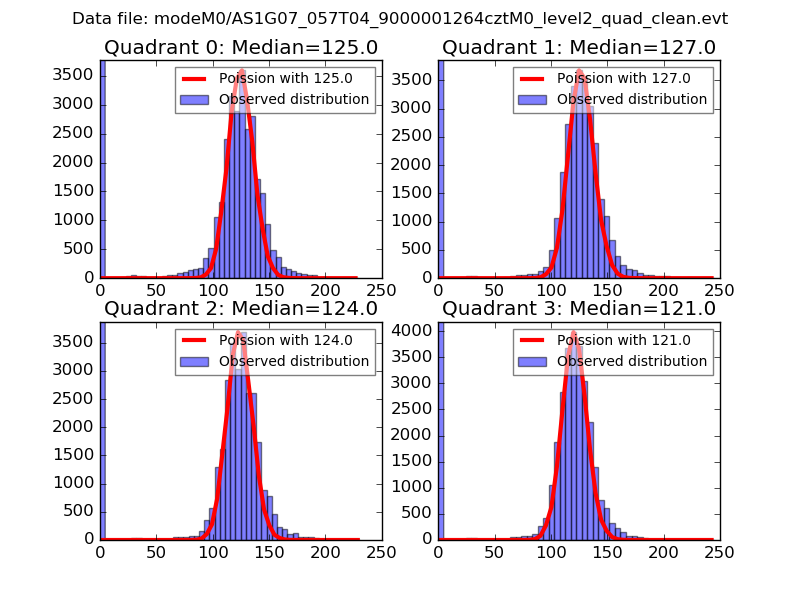 |
 |
| Quadrant-wise count rates Data is divided into 100 sec bins |
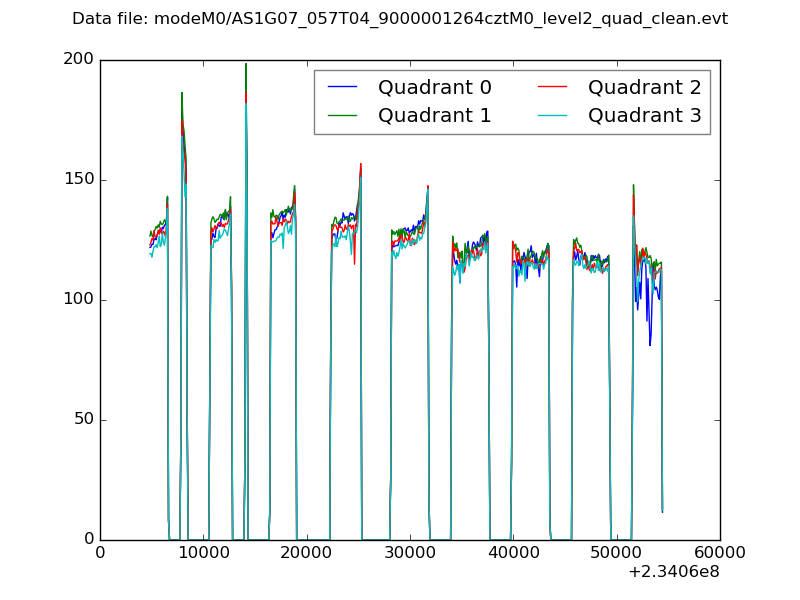 |
|
| Module-wise count rates for Quadrant A Data is divided into 100 sec bins |
 |
 |
| Module-wise count rates for Quadrant B Data is divided into 100 sec bins |
 |
 |
| Module-wise count rates for Quadrant C Data is divided into 100 sec bins |
 |
 |
| Module-wise count rates for Quadrant D Data is divided into 100 sec bins |
 |
 |
| Parameter | Plot |
|---|---|
| CZT HV Monitor |  |
| D_VDD |  |
| Temperature 1 |  |
| Veto HV Monitor |  |
| Veto LLD |  |
| Alpha Counter |  |
| _CPM_Rate | 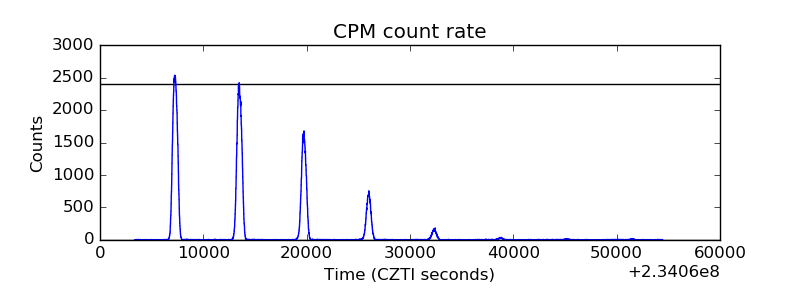 |
| CZT Counter |  |
| +2.5 Volts monitor |  |
| +5 Volts monitor | 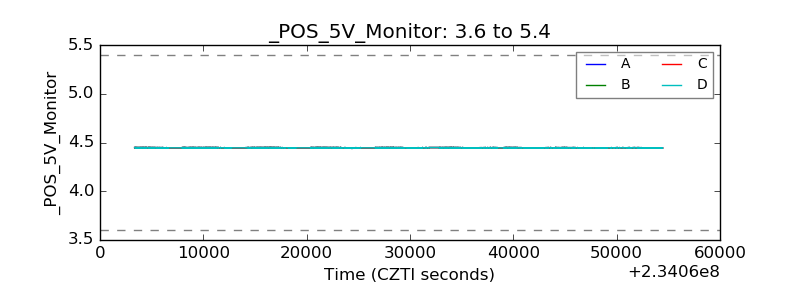 |
| _ROLL_ROT | 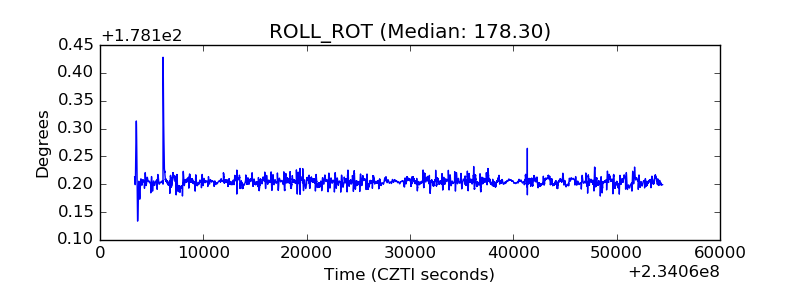 |
| _Roll_DEC |  |
| _Roll_RA |  |
| Veto Counter |  |