| Param | Original file | Final file |
|---|---|---|
| Filename | modeM0/AS1G07_057T04_9000001264_09074cztM0_level2.evt | modeM0/AS1G07_057T04_9000001264_09074cztM0_level2_quad_clean.evt |
| Size (bytes) | 480,369,600 | 68,901,120 |
| Size | 458.1 MB | 65.7 MB |
| Events in quadrant A | 4,055,432 | 410,493 |
| Events in quadrant B | 3,455,921 | 422,035 |
| Events in quadrant C | 3,142,231 | 408,105 |
| Events in quadrant D | 3,453,508 | 392,404 |
| Mode SS | |||
|---|---|---|---|
| Quadrant | BADHDUFLAG | Total packets | Discarded packets |
| A | 0 | 132 | 0 |
| B | 0 | 132 | 0 |
| C | 0 | 132 | 0 |
| D | 0 | 132 | 0 |
| Mode M0 | |||
|---|---|---|---|
| Quadrant | BADHDUFLAG | Total packets | Discarded packets |
| A | 0 | 16224 | 3 |
| B | 0 | 14129 | 2 |
| C | 0 | 13347 | 2 |
| D | 0 | 14399 | 2 |
| Mode M9 | |||
|---|---|---|---|
| Quadrant | BADHDUFLAG | Total packets | Discarded packets |
| A | 0 | 18 | 0 |
| B | 0 | 18 | 0 |
| C | 0 | 18 | 0 |
| D | 0 | 19 | 0 |
| Quadrant | Total seconds | Saturated seconds | Saturation percentage |
|---|---|---|---|
| A | 6496 | 48 | 0.738916% |
| B | 6496 | 47 | 0.723522% |
| C | 6496 | 24 | 0.369458% |
| D | 6496 | 69 | 1.062192% |
Noise dominated data is calculated using 1-second bins in cleaned event files. If a bin has >2000 counts, and if more than 50% of those come from <1% of pixels, then it is considered to be noise-dominated and hence unusable.
| Quadrant | # 1 sec bins | Bins with >0 counts | Bins with >2000 counts | High rate bins dominated by noise | Noise dominated (total time) | Noise dominated (detector-on time) | Marked lightcurve |
|---|---|---|---|---|---|---|---|
| A | 7806 | 6496 | 10 | 10 | 0.13% | 0.15% | 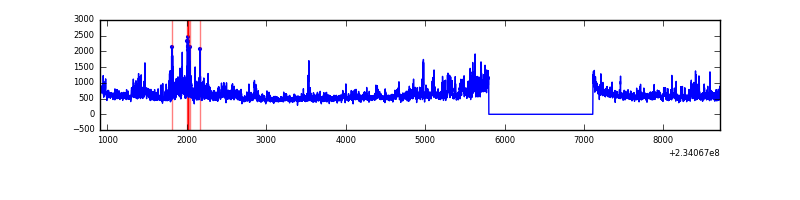 |
| B | 7806 | 6497 | 14 | 14 | 0.18% | 0.22% | 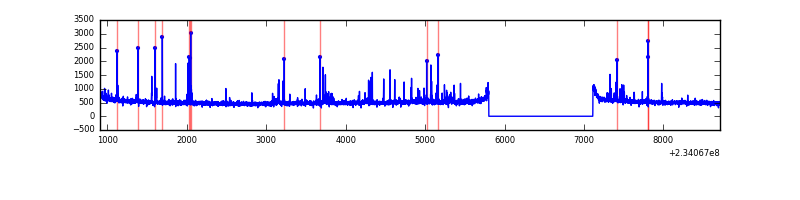 |
| C | 7806 | 6497 | 0 | 0 | 0.00% | 0.00% | 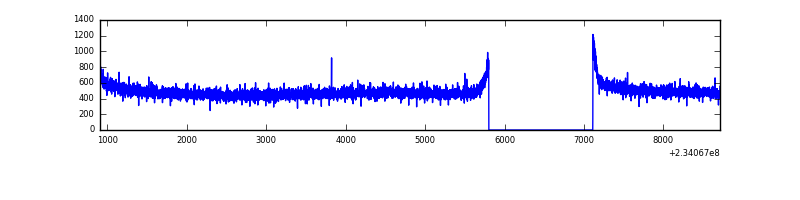 |
| D | 7806 | 6497 | 38 | 38 | 0.49% | 0.58% | 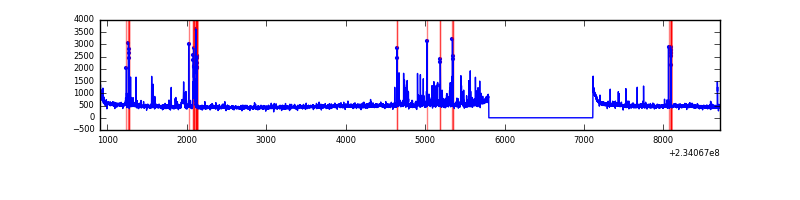 |
Top three noisy pixels from each quadrant. If the there are fewer than three noisy pixels in the level2.evt file, extra rows are filled as -1
| Pixel properties | Quadrant properties | ||||||
|---|---|---|---|---|---|---|---|
| Quadrant | DetID | PixID | Counts | Sigma | Mean | Median | Sigma |
| A | 8 | 5 | 770830 | 4634.87 | 828 | 814 | 166.1 |
| A | 1 | 162 | 43756 | 258.48 | 828 | 814 | 166.1 |
| A | 15 | 239 | 20747 | 119.98 | 828 | 814 | 166.1 |
| B | 4 | 80 | 49230 | 311.69 | 836 | 819 | 155.3 |
| B | 0 | 219 | 43013 | 271.67 | 836 | 819 | 155.3 |
| B | 10 | 16 | 39538 | 249.29 | 836 | 819 | 155.3 |
| C | 13 | 61 | 6234 | 29.34 | 805 | 810 | 184.9 |
| C | 12 | 4 | 3565 | 14.9 | 805 | 810 | 184.9 |
| C | 3 | 202 | 1953 | 6.18 | 805 | 810 | 184.9 |
| D | 2 | 14 | 172890 | 829.88 | 793 | 775 | 207.4 |
| D | 7 | 71 | 119099 | 570.52 | 793 | 775 | 207.4 |
| D | 8 | 195 | 63508 | 302.48 | 793 | 775 | 207.4 |
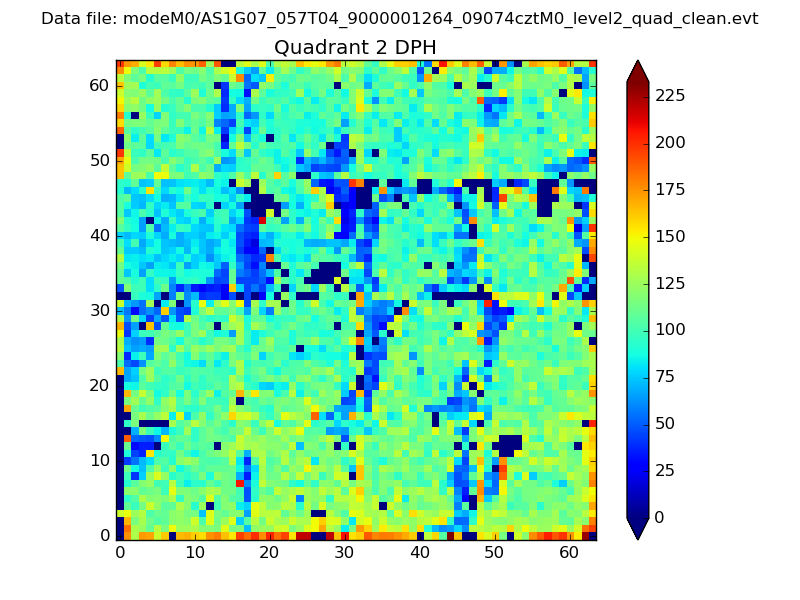
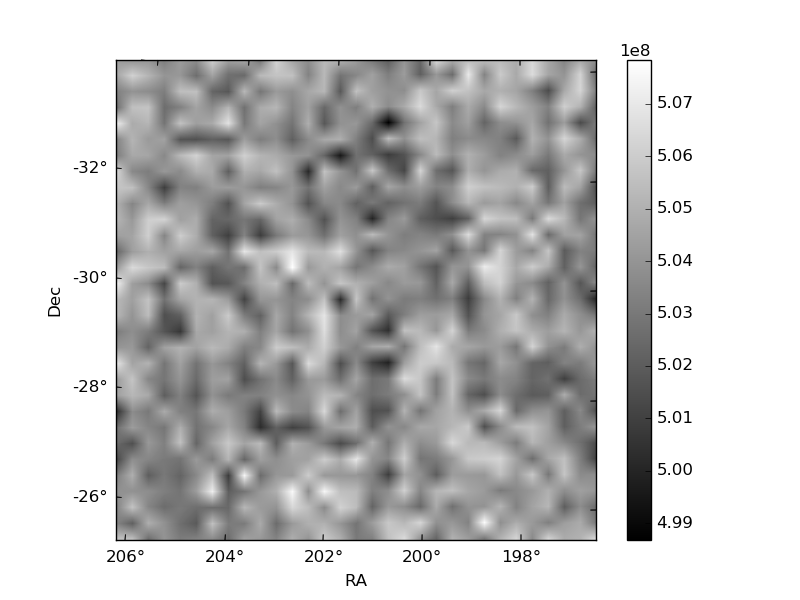
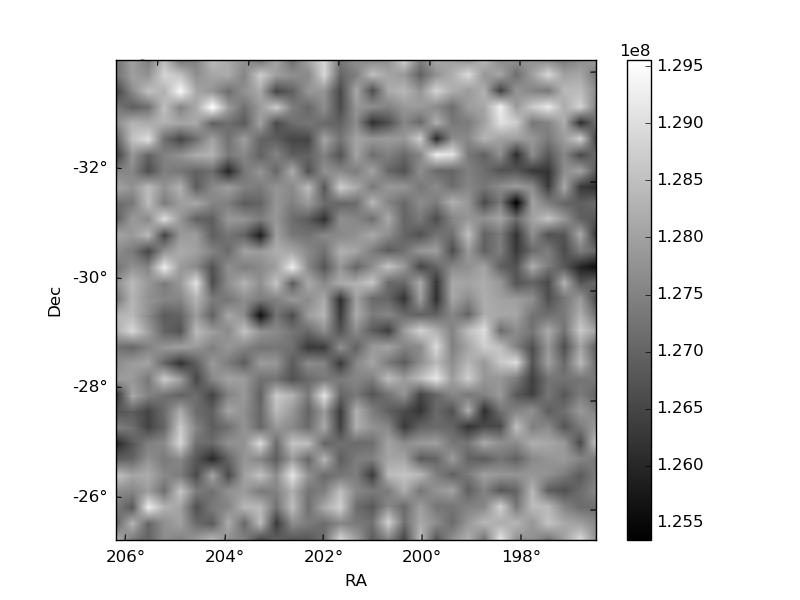
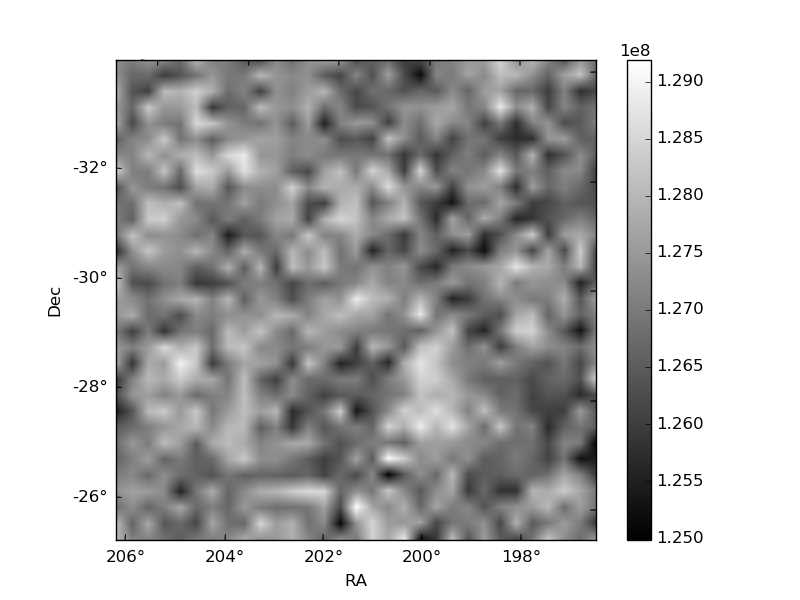
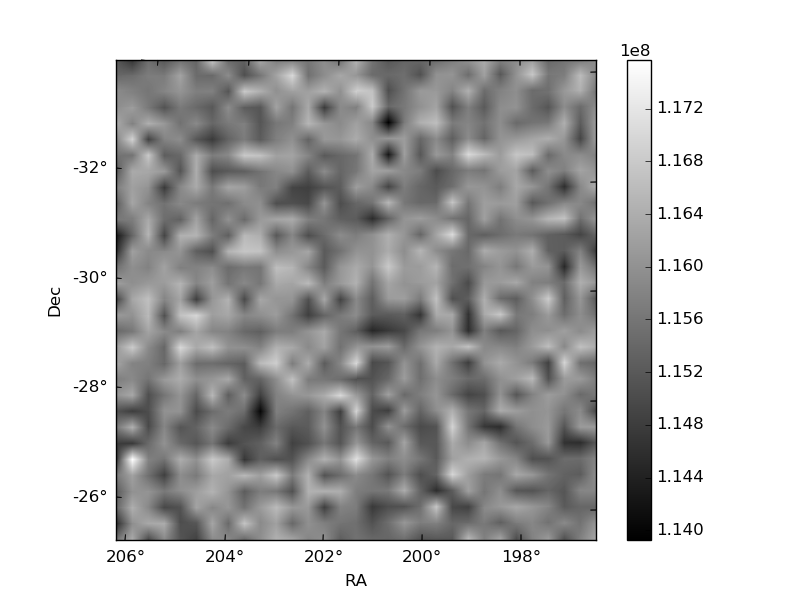
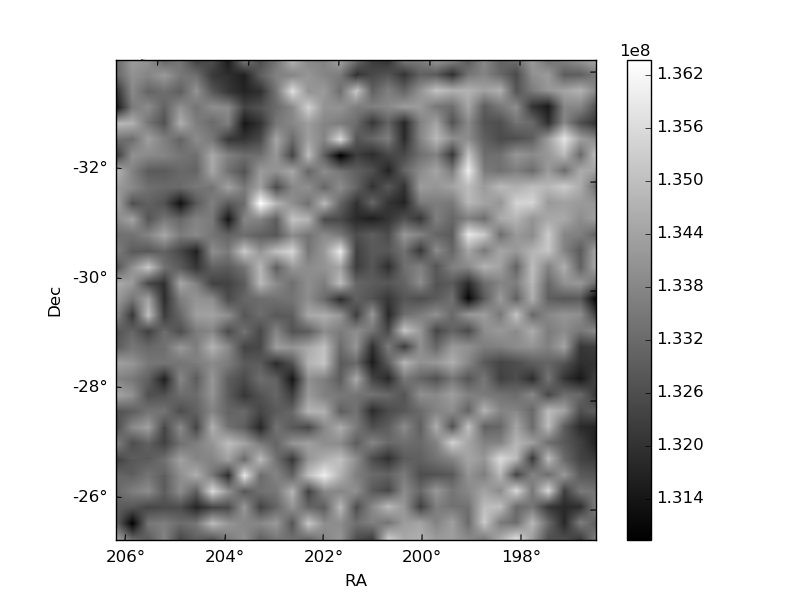
Histogram calculated using DETX and DETY for each event in the final _common_clean file
| Quadrant A | 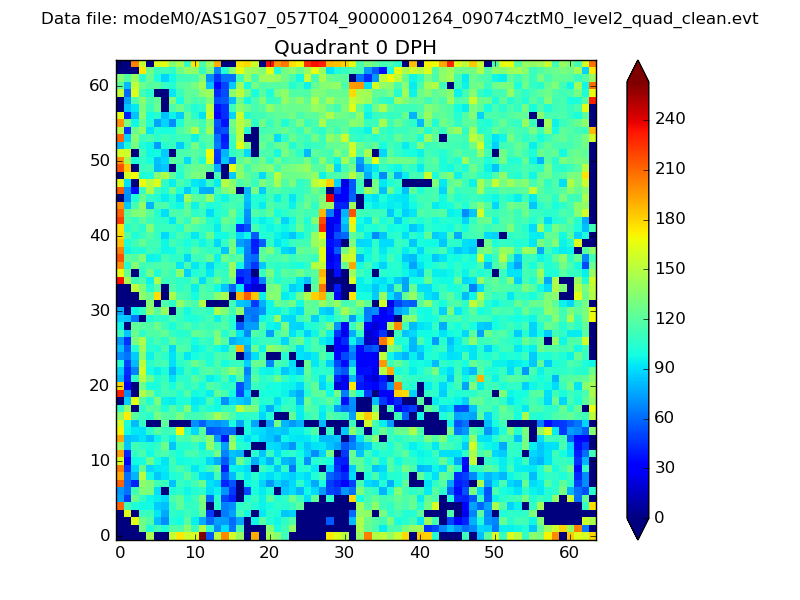 |
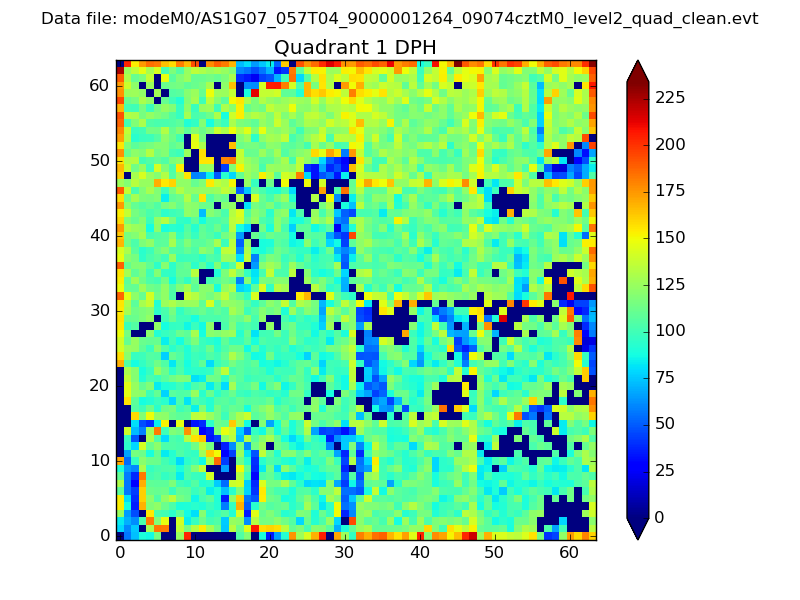 |
Quadrant B |
|---|---|---|---|
| Quadrant D | 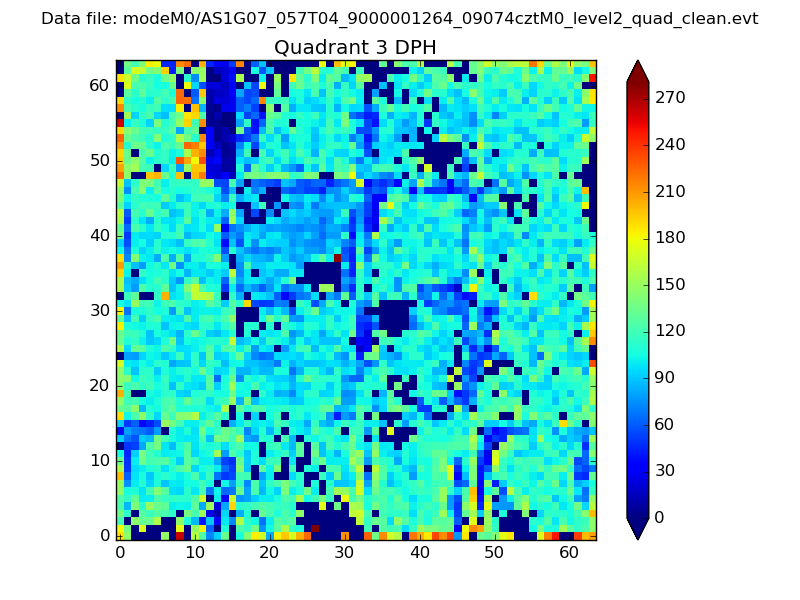 |
 |
Quadrant C |
| Plot type | Count rate plots | Images |
|---|---|---|
| Comparison with Poisson distribution Blue bars denote a histogram of data divided into 1 sec bins. Red curve is a Poisson curve with rate = median count rate of data. |
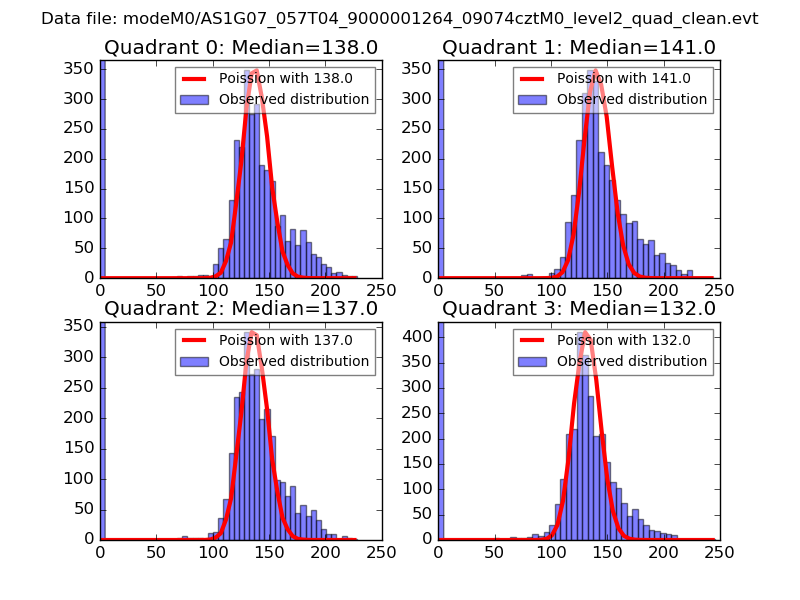 |
 |
| Quadrant-wise count rates Data is divided into 100 sec bins |
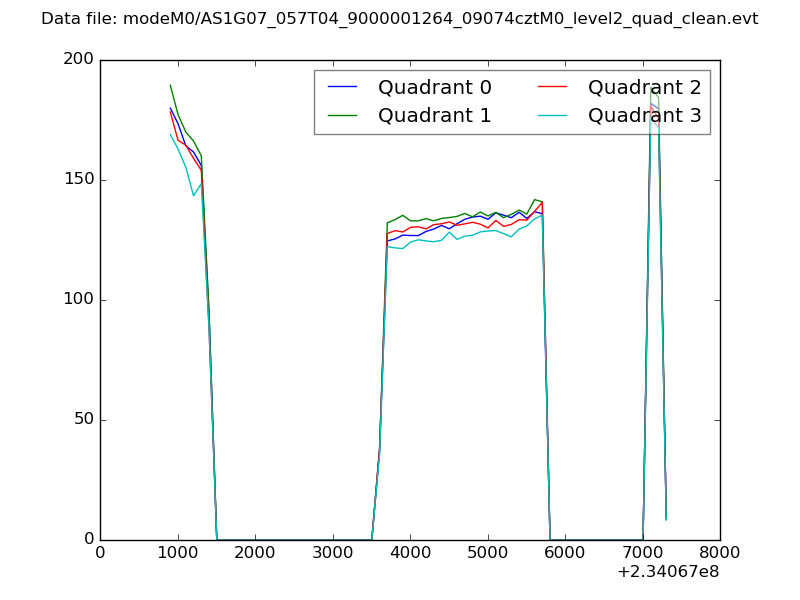 |
|
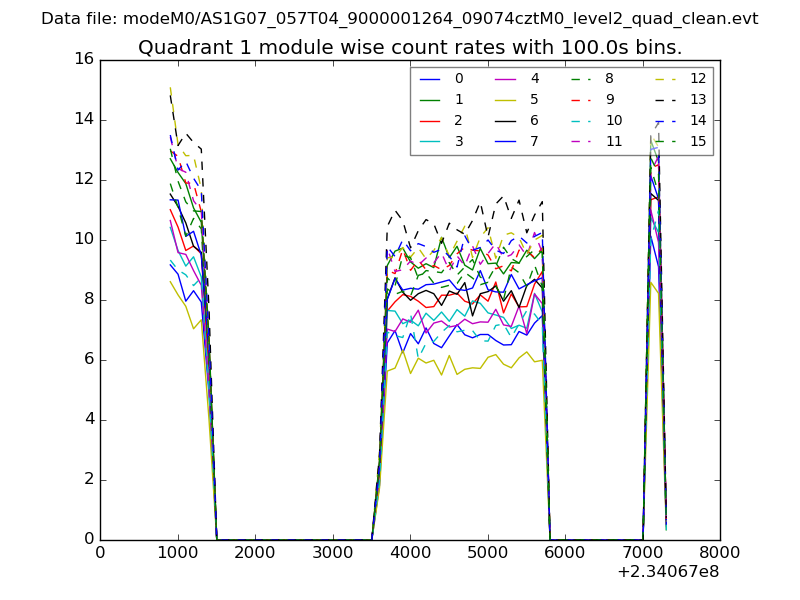
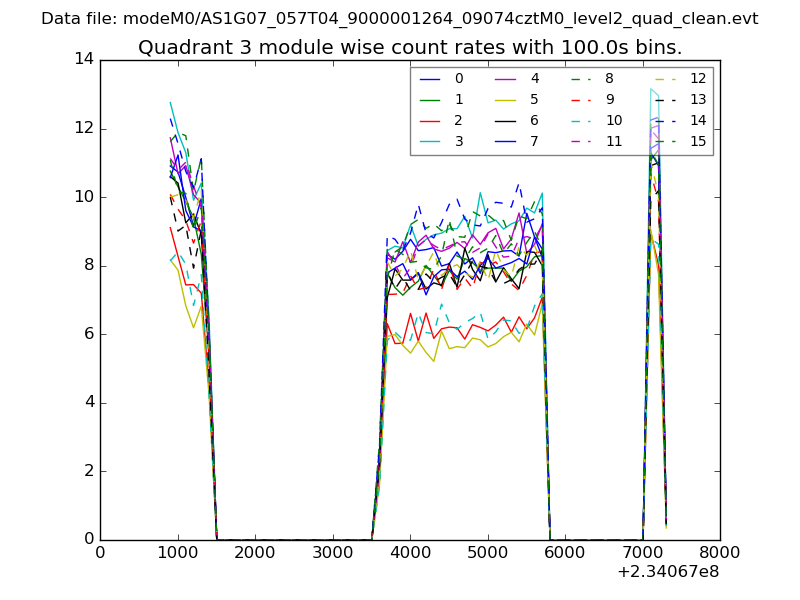
| Module-wise count rates for Quadrant A Data is divided into 100 sec bins |
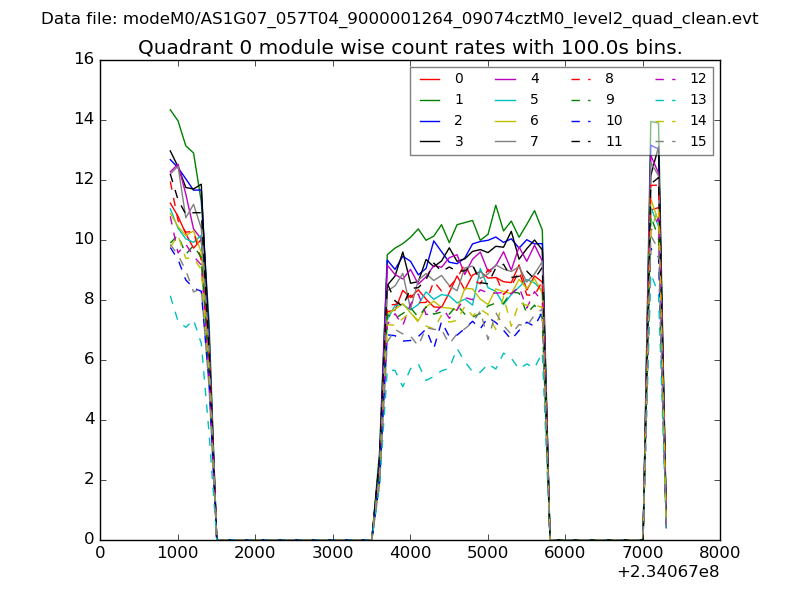 |
 |
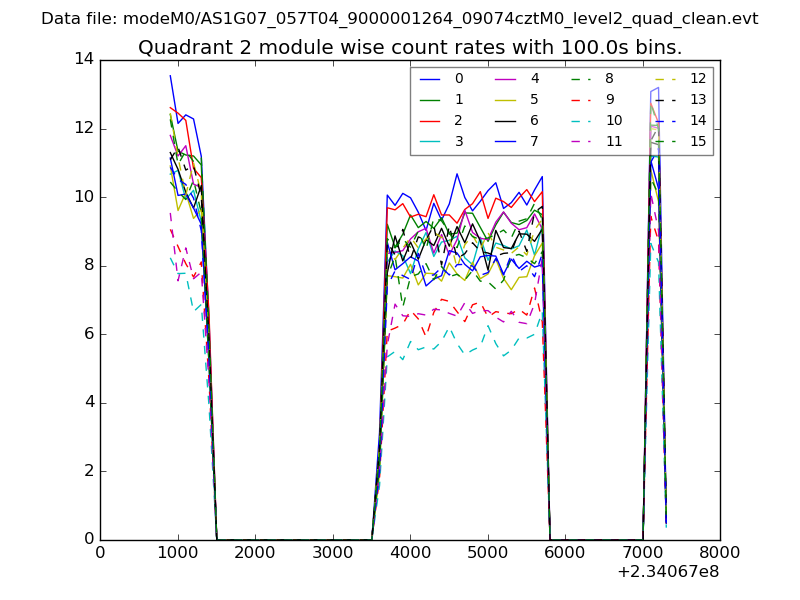
| Module-wise count rates for Quadrant B Data is divided into 100 sec bins |
 |
 |
| Module-wise count rates for Quadrant C Data is divided into 100 sec bins |
 |
 |
| Module-wise count rates for Quadrant D Data is divided into 100 sec bins |
 |
 |
| Parameter | Plot |
|---|---|
| CZT HV Monitor | 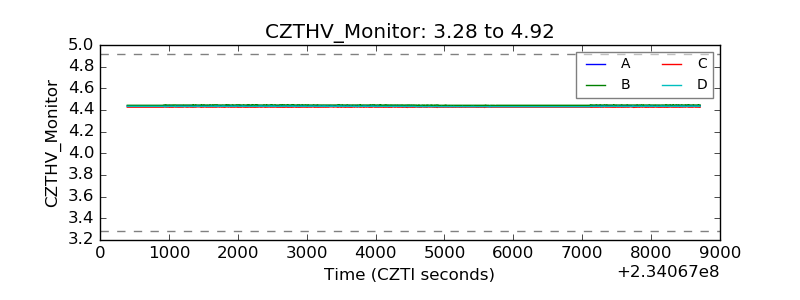 |
| D_VDD | 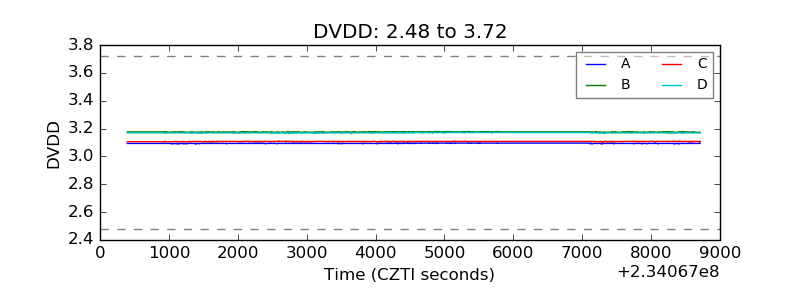 |
| Temperature 1 | 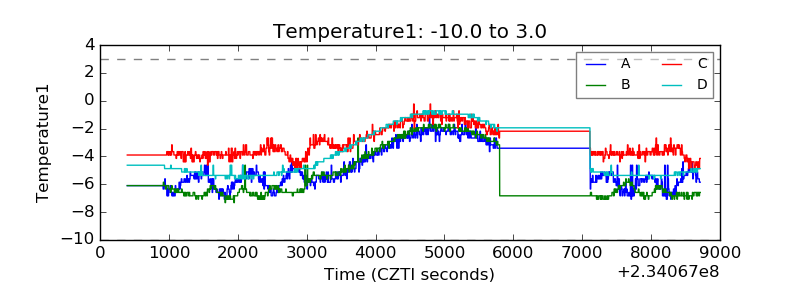 |
| Veto HV Monitor | 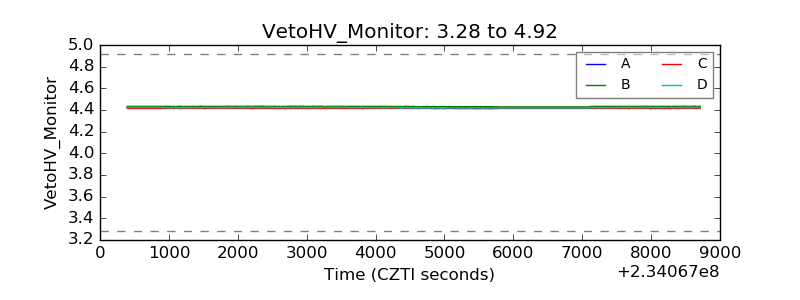 |
| Veto LLD | 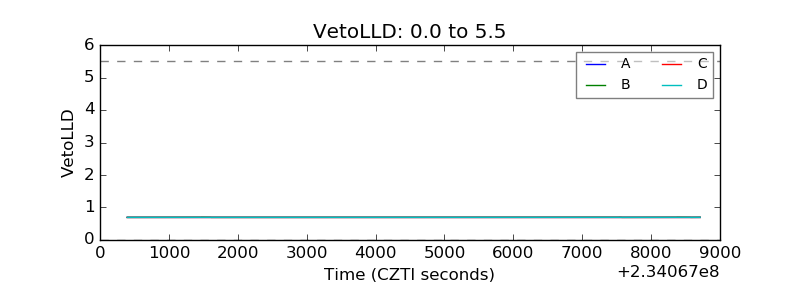 |
| Alpha Counter | 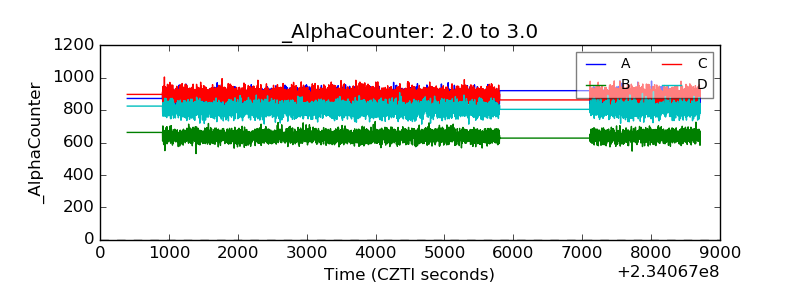 |
| _CPM_Rate | 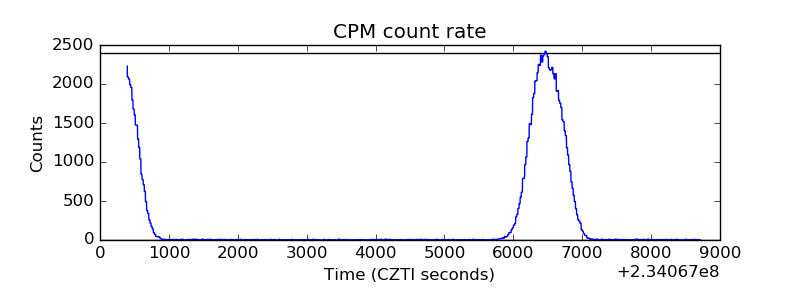 |
| CZT Counter | 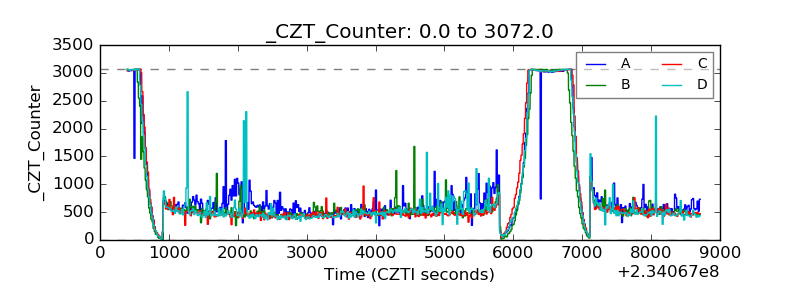 |
| +2.5 Volts monitor |  |
| +5 Volts monitor | 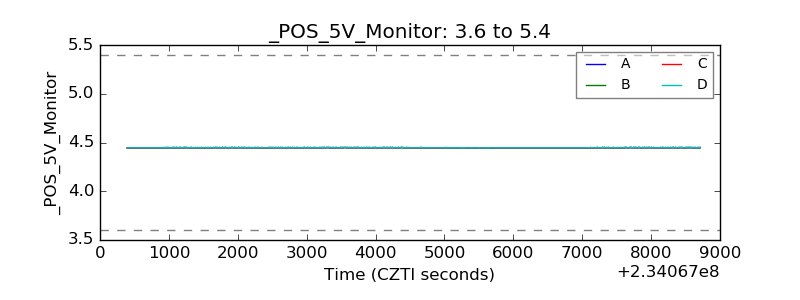 |
| _ROLL_ROT | 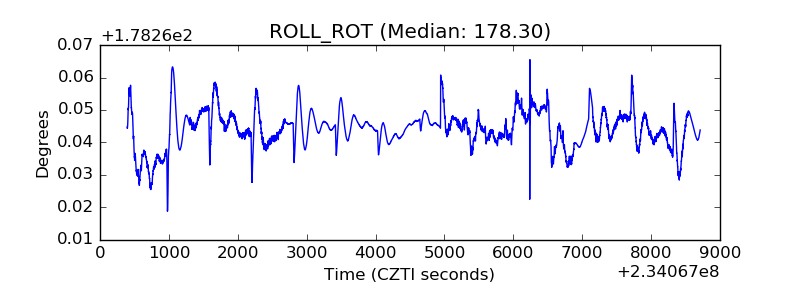 |
| _Roll_DEC | 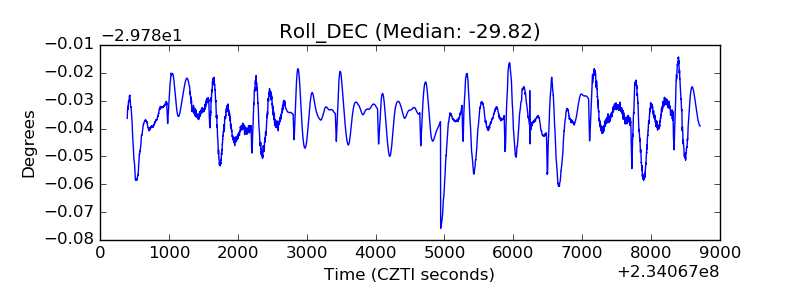 |
| _Roll_RA | 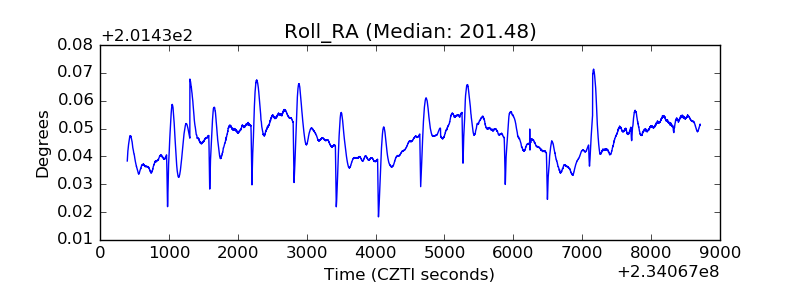 |
| Veto Counter | 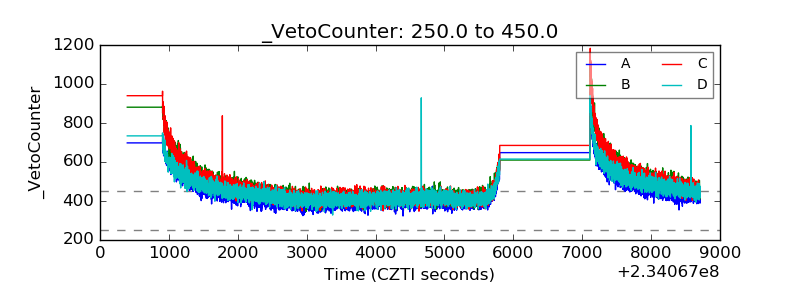 |