| Param | Original file | Final file |
|---|---|---|
| Filename | modeM0/AS1G07_057T04_9000001264_09075cztM0_level2.evt | modeM0/AS1G07_057T04_9000001264_09075cztM0_level2_quad_clean.evt |
| Size (bytes) | 469,238,400 | 63,717,120 |
| Size | 447.5 MB | 60.8 MB |
| Events in quadrant A | 3,795,439 | 373,810 |
| Events in quadrant B | 3,339,001 | 383,366 |
| Events in quadrant C | 3,142,383 | 371,030 |
| Events in quadrant D | 3,503,887 | 358,662 |
| Mode SS | |||
|---|---|---|---|
| Quadrant | BADHDUFLAG | Total packets | Discarded packets |
| A | 0 | 128 | 0 |
| B | 0 | 128 | 0 |
| C | 0 | 128 | 0 |
| D | 0 | 128 | 0 |
| Mode M0 | |||
|---|---|---|---|
| Quadrant | BADHDUFLAG | Total packets | Discarded packets |
| A | 0 | 15278 | 3 |
| B | 0 | 13614 | 2 |
| C | 0 | 13194 | 2 |
| D | 0 | 14284 | 2 |
| Mode M9 | |||
|---|---|---|---|
| Quadrant | BADHDUFLAG | Total packets | Discarded packets |
| A | 0 | 13 | 0 |
| B | 0 | 13 | 0 |
| C | 0 | 13 | 0 |
| D | 0 | 14 | 0 |
| Quadrant | Total seconds | Saturated seconds | Saturation percentage |
|---|---|---|---|
| A | 6339 | 72 | 1.135826% |
| B | 6339 | 84 | 1.325130% |
| C | 6339 | 63 | 0.993848% |
| D | 6339 | 104 | 1.640637% |
Noise dominated data is calculated using 1-second bins in cleaned event files. If a bin has >2000 counts, and if more than 50% of those come from <1% of pixels, then it is considered to be noise-dominated and hence unusable.
| Quadrant | # 1 sec bins | Bins with >0 counts | Bins with >2000 counts | High rate bins dominated by noise | Noise dominated (total time) | Noise dominated (detector-on time) | Marked lightcurve |
|---|---|---|---|---|---|---|---|
| A | 7664 | 6340 | 1 | 1 | 0.01% | 0.02% | 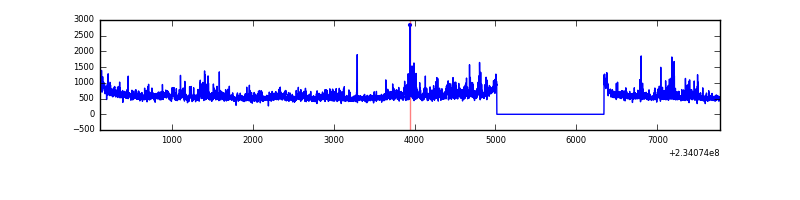 |
| B | 7664 | 6340 | 9 | 9 | 0.12% | 0.14% | 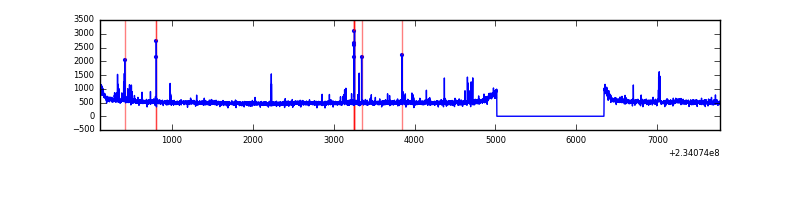 |
| C | 7664 | 6340 | 0 | 0 | 0.00% | 0.00% | 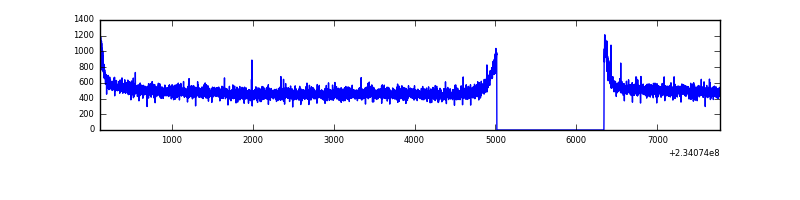 |
| D | 7664 | 6340 | 35 | 35 | 0.46% | 0.55% | 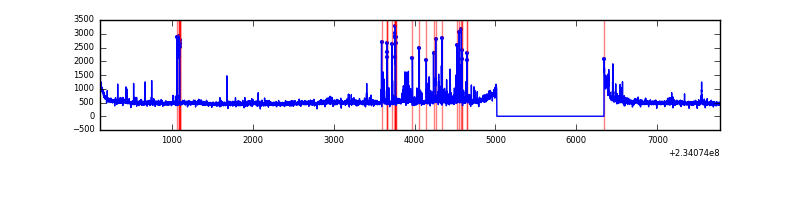 |
Top three noisy pixels from each quadrant. If the there are fewer than three noisy pixels in the level2.evt file, extra rows are filled as -1
| Pixel properties | Quadrant properties | ||||||
|---|---|---|---|---|---|---|---|
| Quadrant | DetID | PixID | Counts | Sigma | Mean | Median | Sigma |
| A | 8 | 5 | 545696 | 3234.94 | 827 | 812 | 168.4 |
| A | 1 | 162 | 31066 | 179.62 | 827 | 812 | 168.4 |
| A | 5 | 16 | 26270 | 151.14 | 827 | 812 | 168.4 |
| B | 10 | 252 | 24477 | 152.73 | 833 | 815 | 154.9 |
| B | 0 | 214 | 19774 | 122.37 | 833 | 815 | 154.9 |
| B | 0 | 229 | 16765 | 102.95 | 833 | 815 | 154.9 |
| C | 13 | 61 | 6213 | 29.23 | 804 | 810 | 184.8 |
| C | 14 | 234 | 2951 | 11.58 | 804 | 810 | 184.8 |
| C | 8 | 222 | 2108 | 7.02 | 804 | 810 | 184.8 |
| D | 1 | 52 | 157627 | 769.26 | 794 | 774 | 203.9 |
| D | 7 | 71 | 104642 | 509.4 | 794 | 774 | 203.9 |
| D | 2 | 14 | 98401 | 478.79 | 794 | 774 | 203.9 |
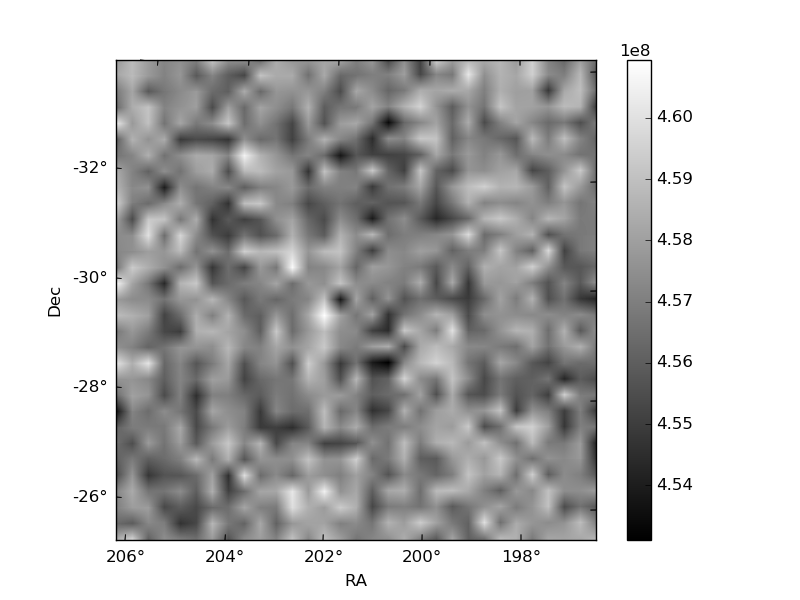
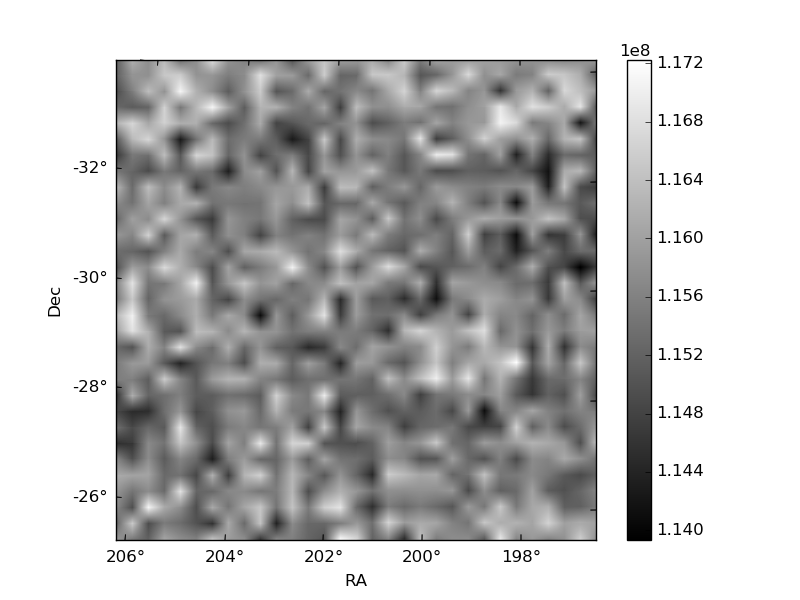
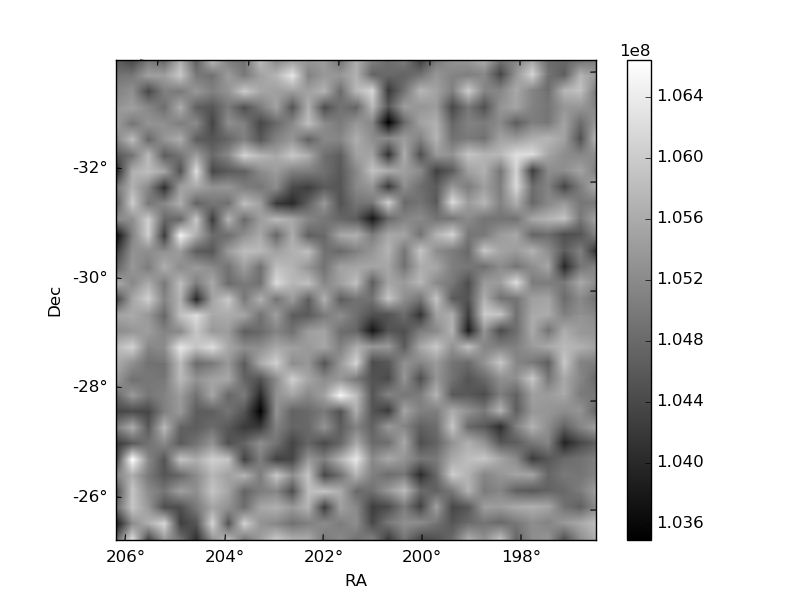
Histogram calculated using DETX and DETY for each event in the final _common_clean file
| Quadrant A | 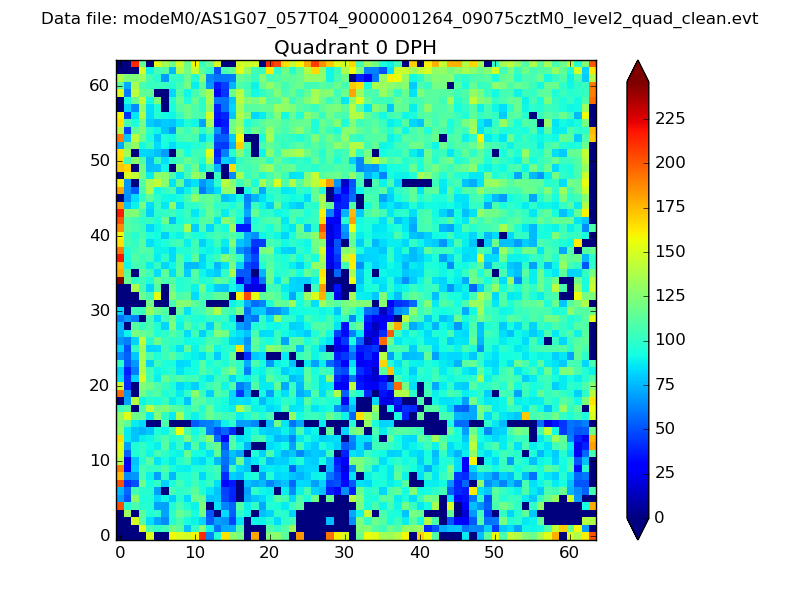 |
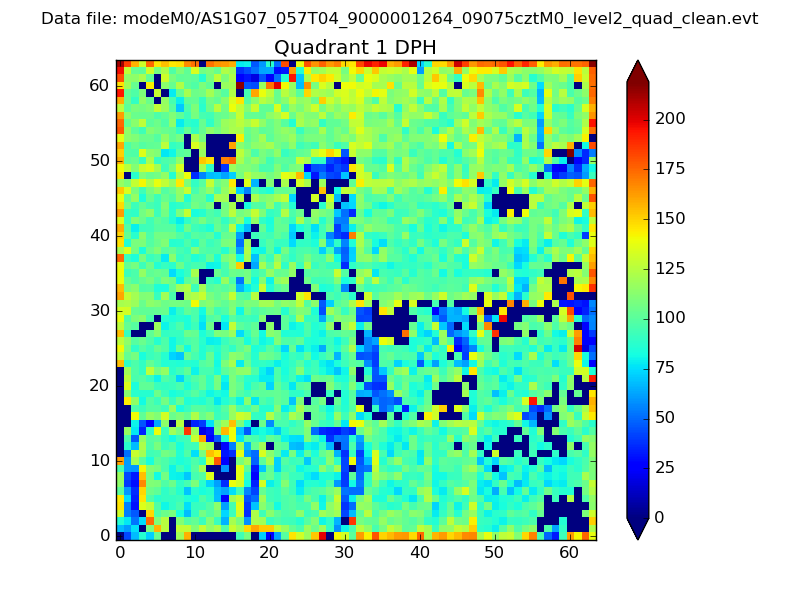 |
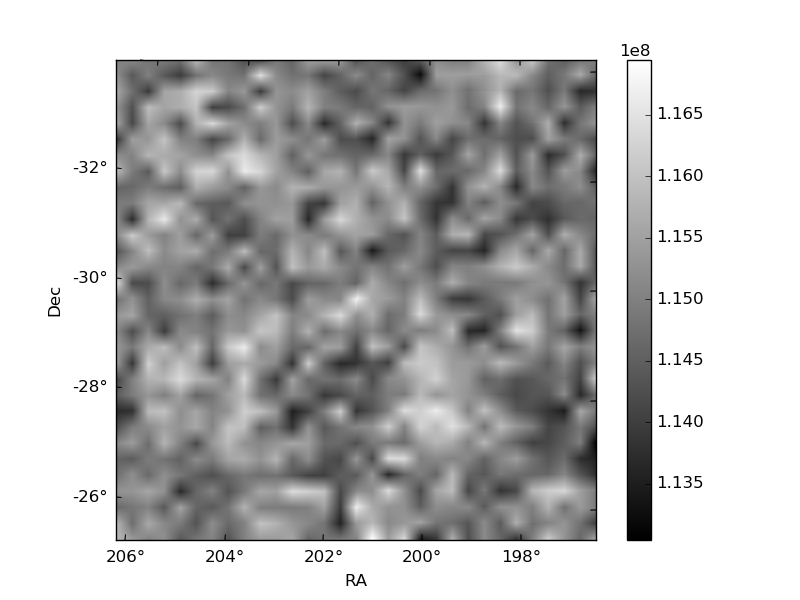
Quadrant B |
|---|---|---|---|
| Quadrant D | 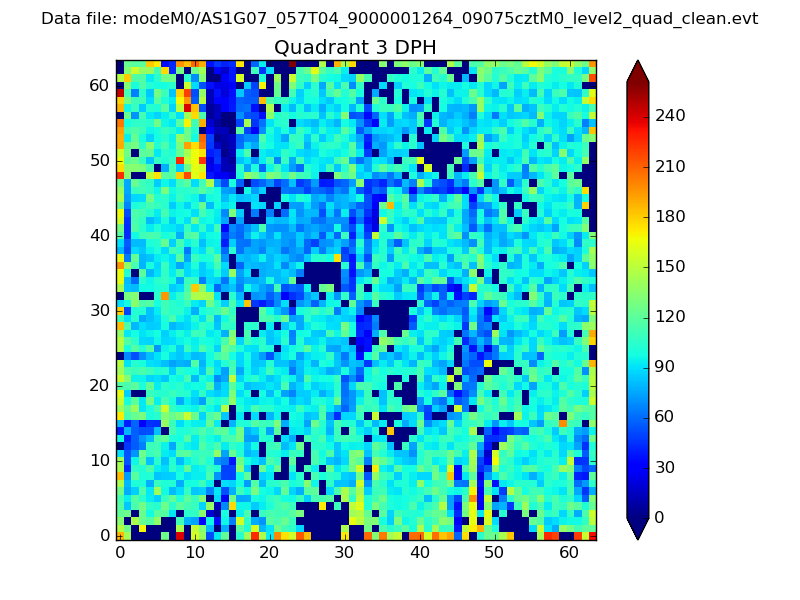 |
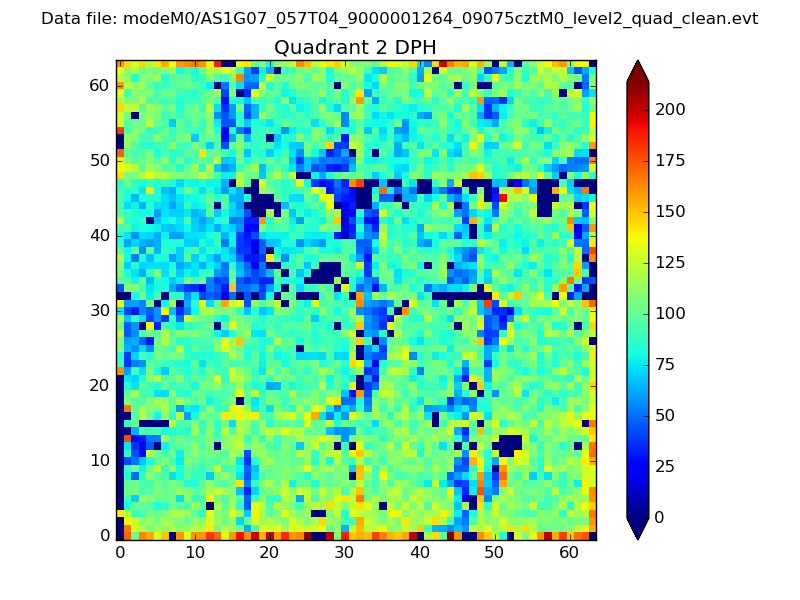 |
Quadrant C |
| Plot type | Count rate plots | Images |
|---|---|---|
| Comparison with Poisson distribution Blue bars denote a histogram of data divided into 1 sec bins. Red curve is a Poisson curve with rate = median count rate of data. |
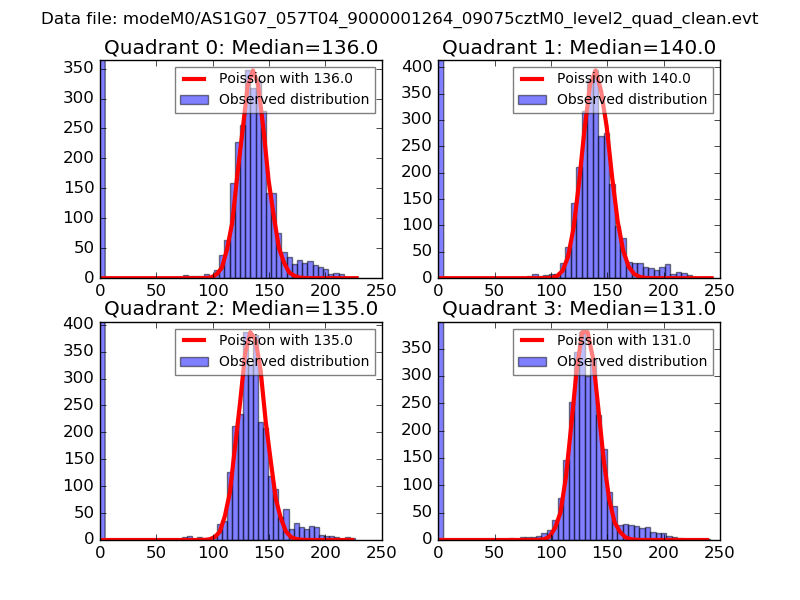 |
 |
| Quadrant-wise count rates Data is divided into 100 sec bins |
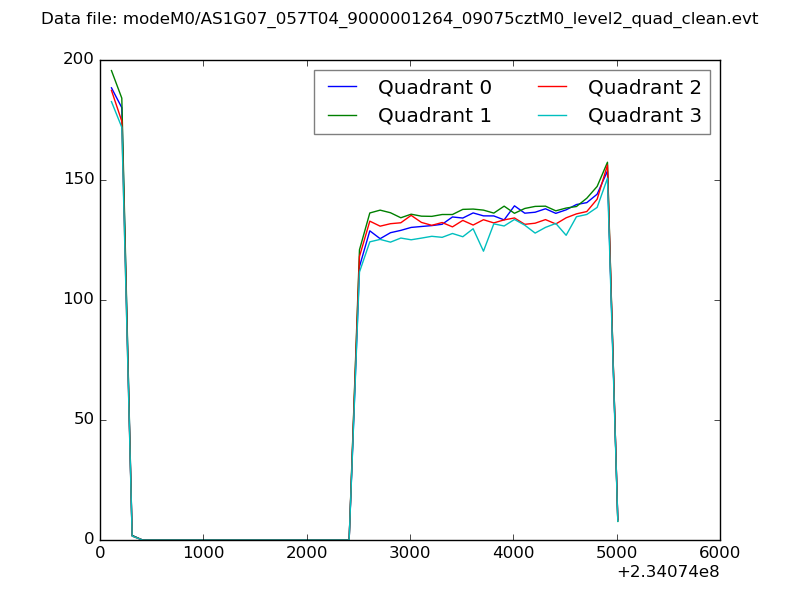 |
|
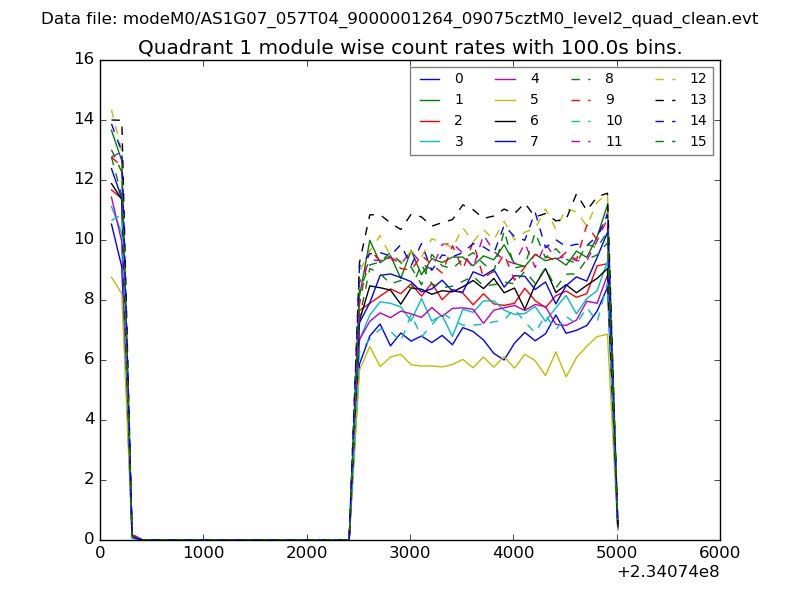
| Module-wise count rates for Quadrant A Data is divided into 100 sec bins |
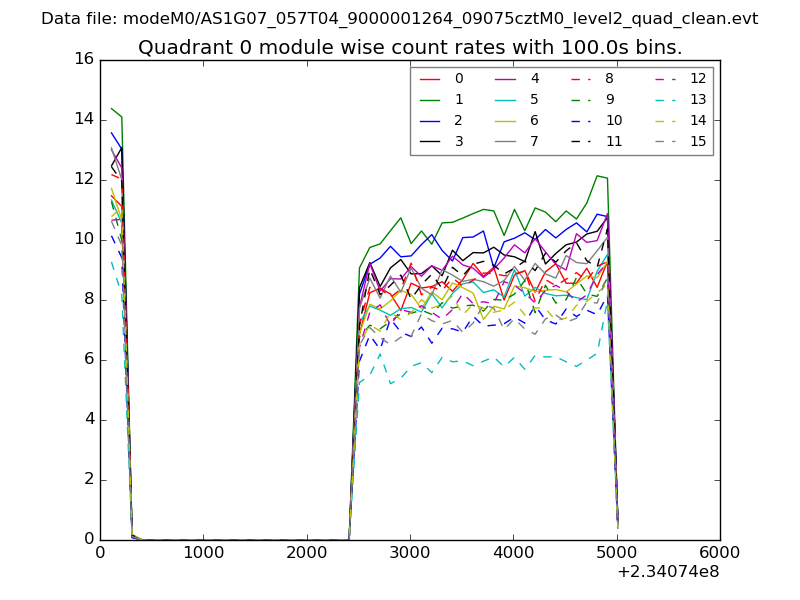 |
 |
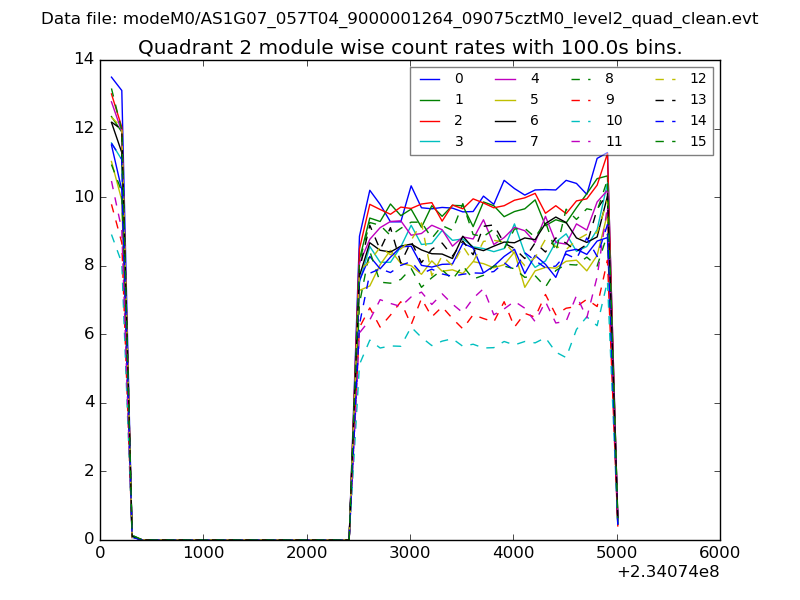
| Module-wise count rates for Quadrant B Data is divided into 100 sec bins |
 |
 |
| Module-wise count rates for Quadrant C Data is divided into 100 sec bins |
 |
 |
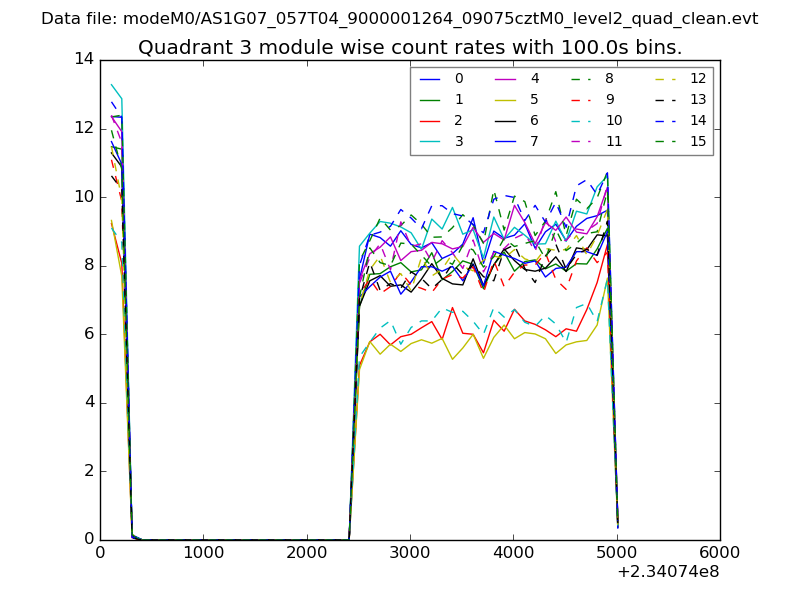
| Module-wise count rates for Quadrant D Data is divided into 100 sec bins |
 |
 |
| Parameter | Plot |
|---|---|
| CZT HV Monitor | 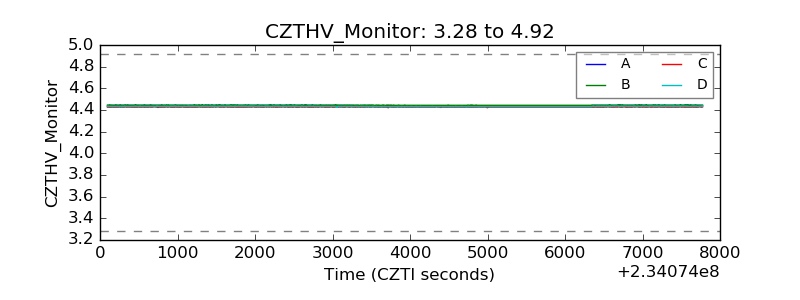 |
| D_VDD | 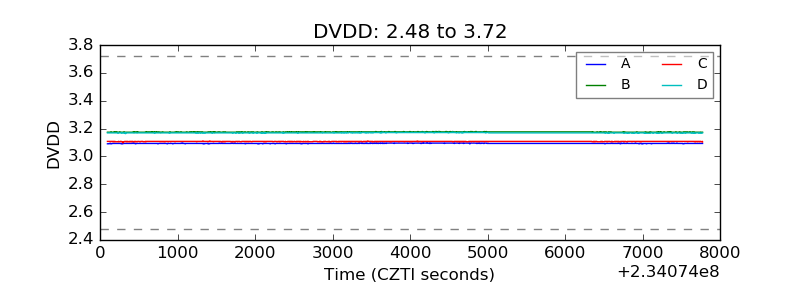 |
| Temperature 1 | 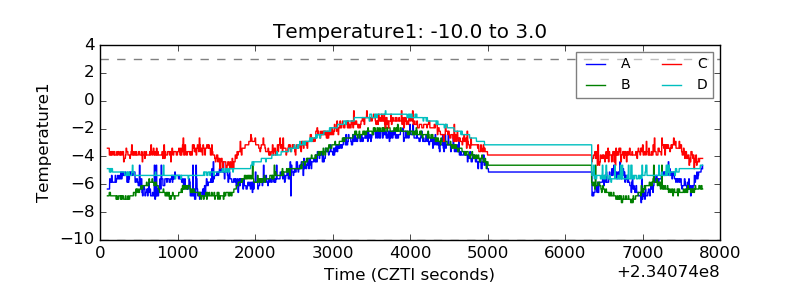 |
| Veto HV Monitor | 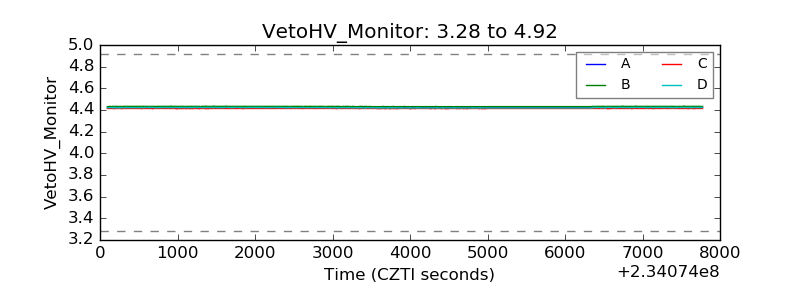 |
| Veto LLD | 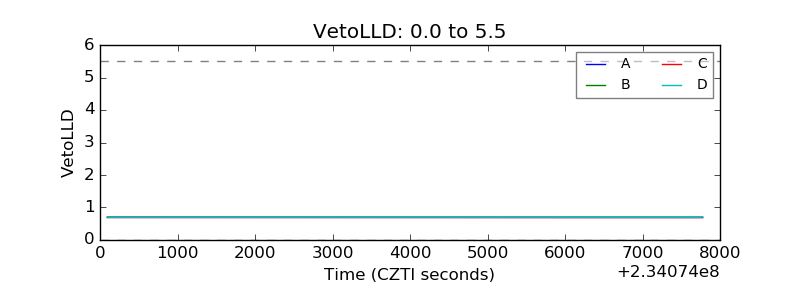 |
| Alpha Counter | 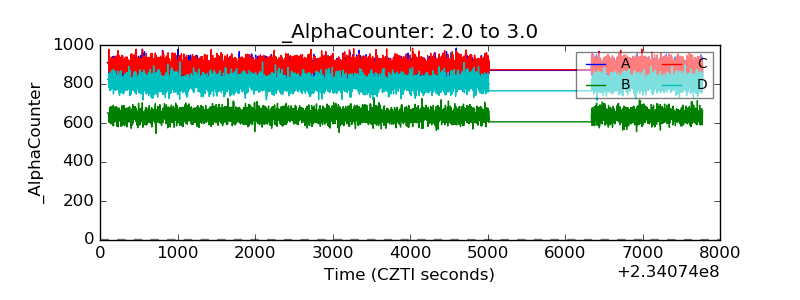 |
| _CPM_Rate | 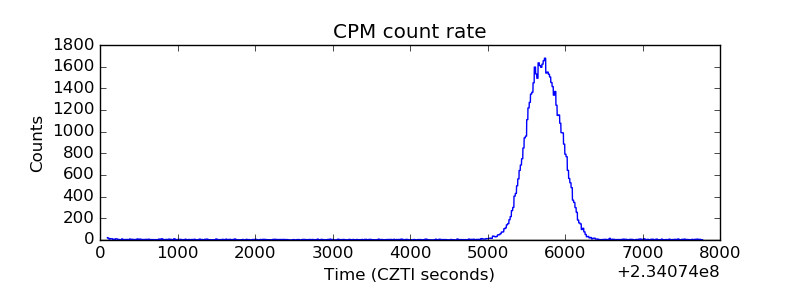 |
| CZT Counter | 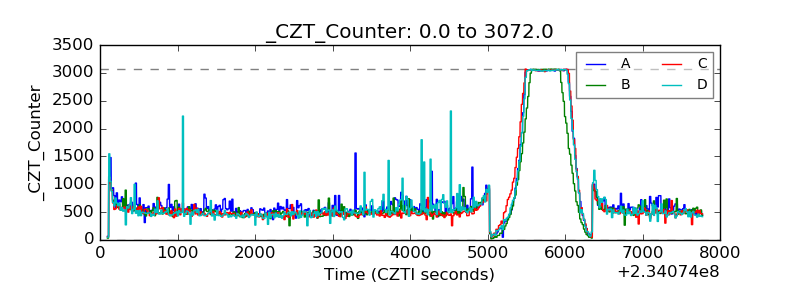 |
| +2.5 Volts monitor |  |
| +5 Volts monitor | 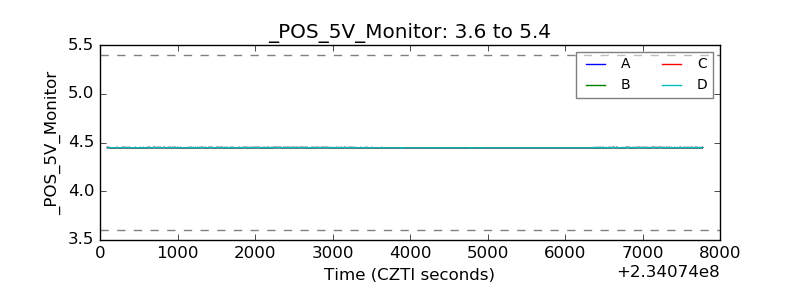 |
| _ROLL_ROT | 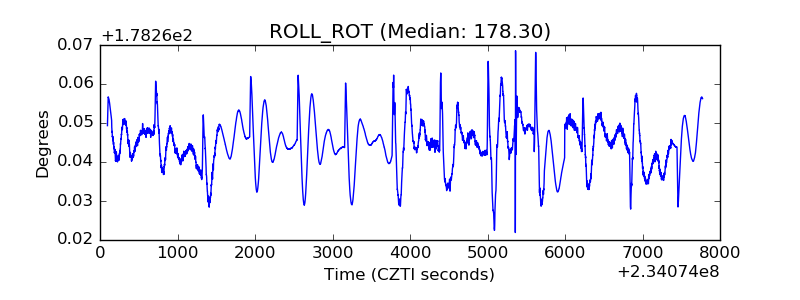 |
| _Roll_DEC | 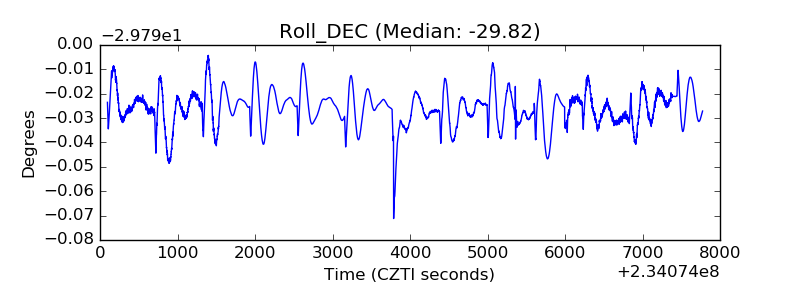 |
| _Roll_RA | 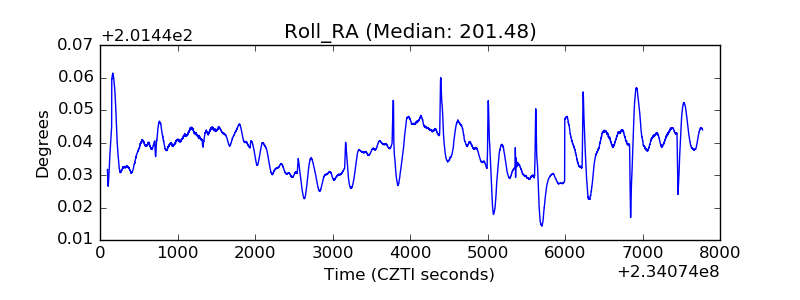 |
| Veto Counter | 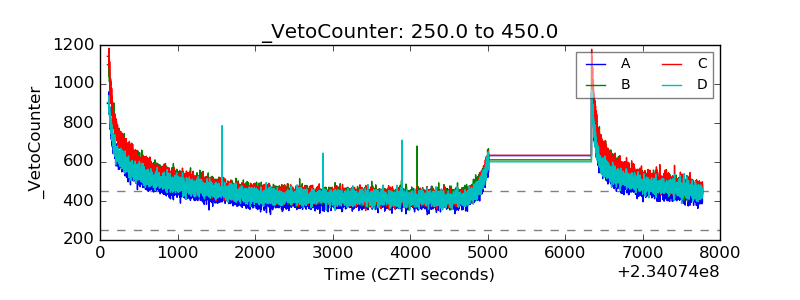 |