| Param | Original file | Final file |
|---|---|---|
| Filename | modeM0/AS1G07_057T04_9000001264_09076cztM0_level2.evt | modeM0/AS1G07_057T04_9000001264_09076cztM0_level2_quad_clean.evt |
| Size (bytes) | 463,158,720 | 66,519,360 |
| Size | 441.7 MB | 63.4 MB |
| Events in quadrant A | 3,569,622 | 398,131 |
| Events in quadrant B | 3,251,521 | 402,333 |
| Events in quadrant C | 3,169,119 | 391,341 |
| Events in quadrant D | 3,606,350 | 380,059 |
| Mode SS | |||
|---|---|---|---|
| Quadrant | BADHDUFLAG | Total packets | Discarded packets |
| A | 0 | 128 | 0 |
| B | 0 | 128 | 0 |
| C | 0 | 128 | 0 |
| D | 0 | 128 | 0 |
| Mode M0 | |||
|---|---|---|---|
| Quadrant | BADHDUFLAG | Total packets | Discarded packets |
| A | 0 | 14399 | 5 |
| B | 0 | 13394 | 2 |
| C | 0 | 13392 | 4 |
| D | 0 | 14752 | 4 |
| Mode M9 | |||
|---|---|---|---|
| Quadrant | BADHDUFLAG | Total packets | Discarded packets |
| A | 0 | 20 | 0 |
| B | 0 | 20 | 0 |
| C | 0 | 20 | 0 |
| D | 0 | 21 | 0 |
| Quadrant | Total seconds | Saturated seconds | Saturation percentage |
|---|---|---|---|
| A | 6337 | 81 | 1.278207% |
| B | 6338 | 91 | 1.435784% |
| C | 6337 | 85 | 1.341329% |
| D | 6337 | 116 | 1.830519% |
Noise dominated data is calculated using 1-second bins in cleaned event files. If a bin has >2000 counts, and if more than 50% of those come from <1% of pixels, then it is considered to be noise-dominated and hence unusable.
| Quadrant | # 1 sec bins | Bins with >0 counts | Bins with >2000 counts | High rate bins dominated by noise | Noise dominated (total time) | Noise dominated (detector-on time) | Marked lightcurve |
|---|---|---|---|---|---|---|---|
| A | 7613 | 6339 | 3 | 3 | 0.04% | 0.05% | 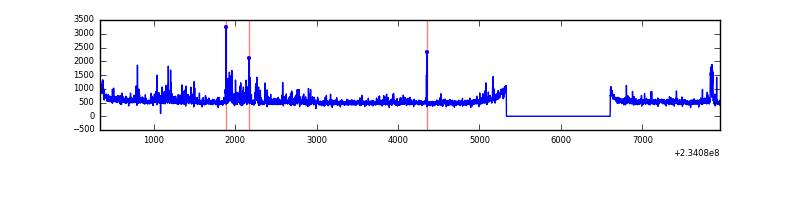 |
| B | 7613 | 6339 | 2 | 2 | 0.03% | 0.03% | 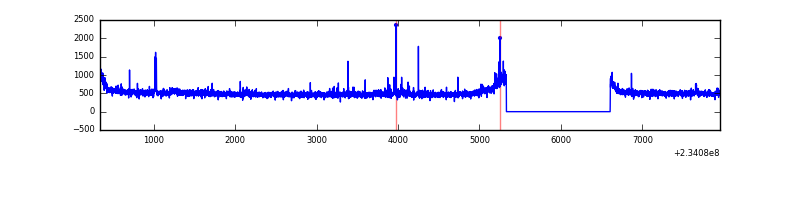 |
| C | 7613 | 6339 | 19 | 19 | 0.25% | 0.30% |  |
| D | 7613 | 6338 | 34 | 34 | 0.45% | 0.54% |  |
Top three noisy pixels from each quadrant. If the there are fewer than three noisy pixels in the level2.evt file, extra rows are filled as -1
| Pixel properties | Quadrant properties | ||||||
|---|---|---|---|---|---|---|---|
| Quadrant | DetID | PixID | Counts | Sigma | Mean | Median | Sigma |
| A | 8 | 5 | 339848 | 2058.1 | 813 | 798 | 164.7 |
| A | 1 | 162 | 39012 | 231.97 | 813 | 798 | 164.7 |
| A | 15 | 239 | 37578 | 223.26 | 813 | 798 | 164.7 |
| B | 0 | 229 | 29048 | 183.79 | 817 | 798 | 153.7 |
| B | 0 | 214 | 25451 | 160.39 | 817 | 798 | 153.7 |
| B | 12 | 111 | 16629 | 102.99 | 817 | 798 | 153.7 |
| C | 14 | 234 | 80794 | 436.75 | 791 | 799 | 183.2 |
| C | 13 | 61 | 6061 | 28.73 | 791 | 799 | 183.2 |
| C | 14 | 67 | 2351 | 8.47 | 791 | 799 | 183.2 |
| D | 6 | 225 | 192692 | 962.66 | 786 | 767 | 199.4 |
| D | 12 | 233 | 138308 | 689.88 | 786 | 767 | 199.4 |
| D | 1 | 52 | 121023 | 603.18 | 786 | 767 | 199.4 |
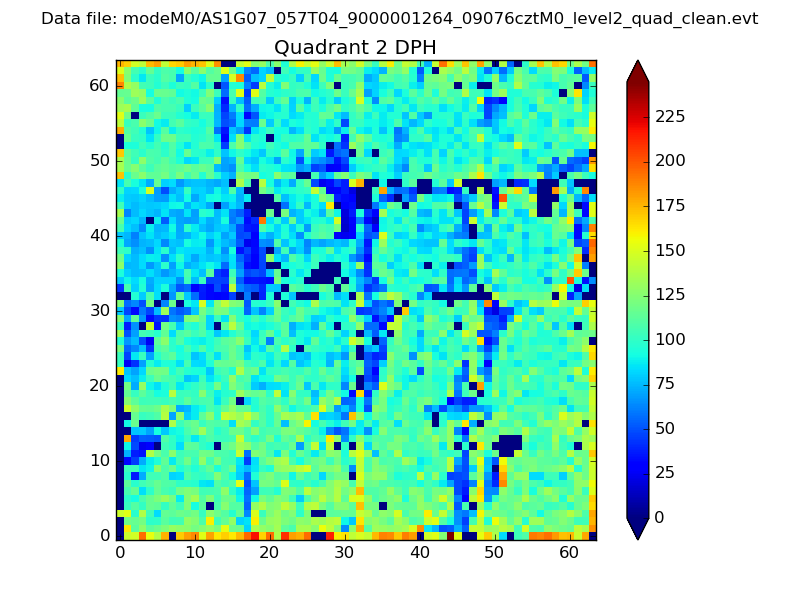
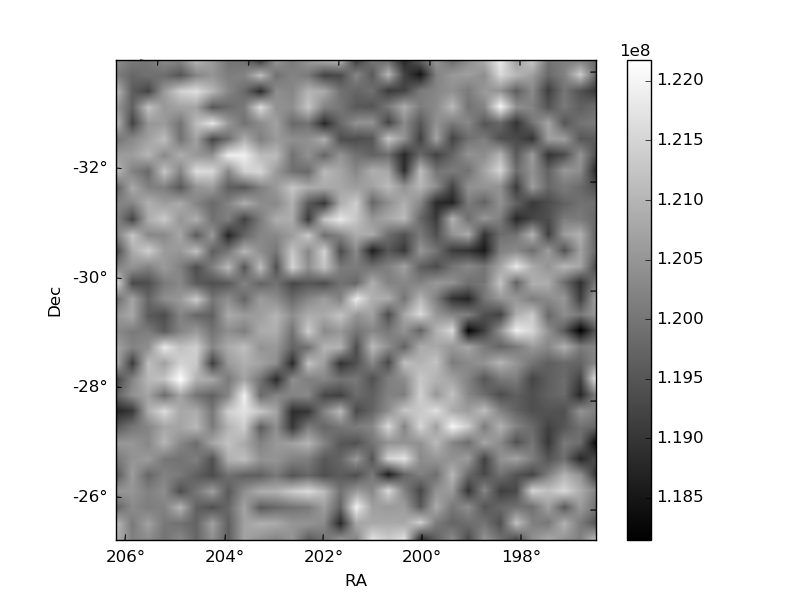
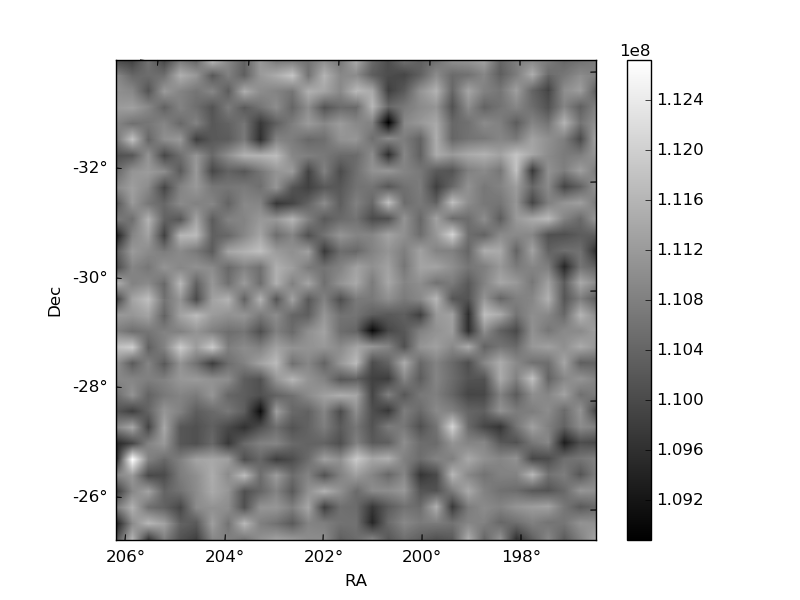
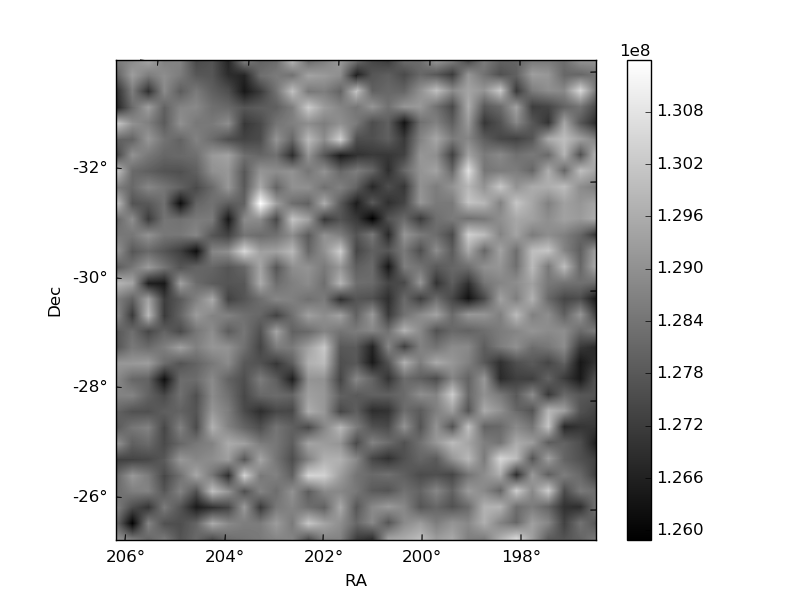
Histogram calculated using DETX and DETY for each event in the final _common_clean file
| Quadrant A | 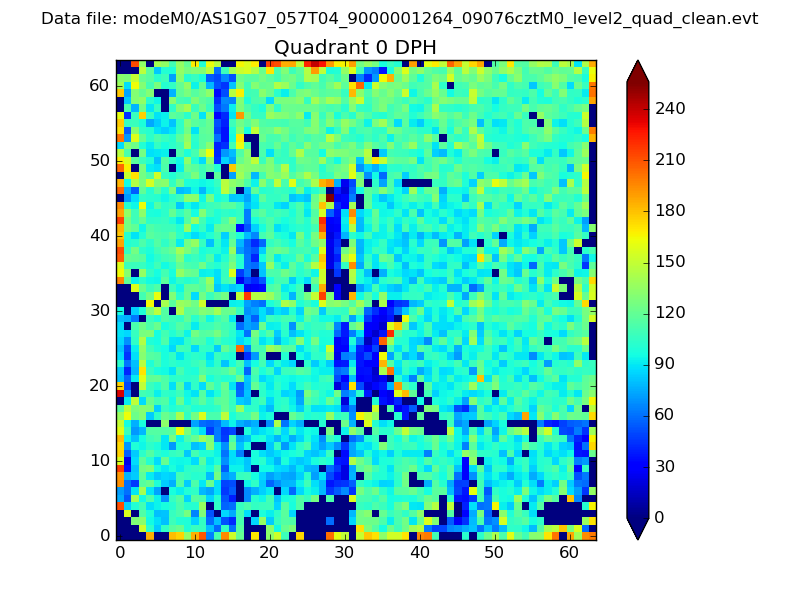 |
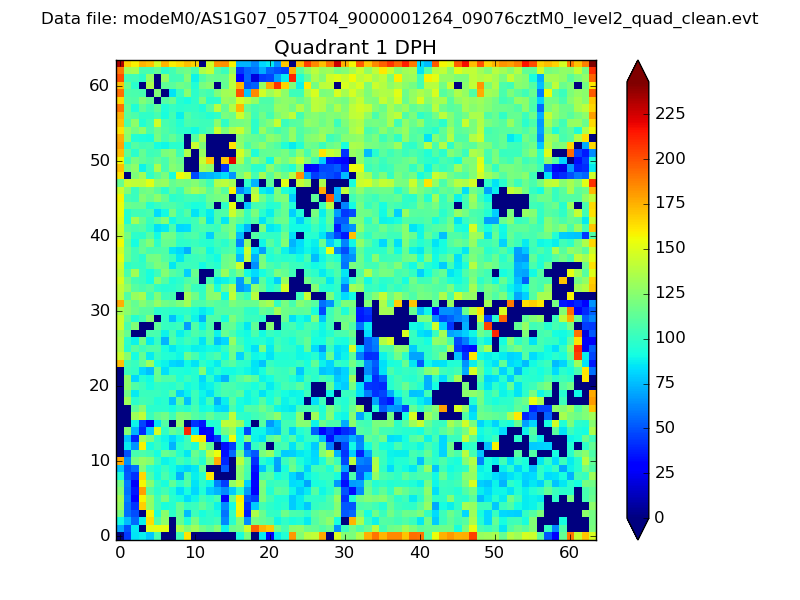 |
Quadrant B |
|---|---|---|---|
| Quadrant D | 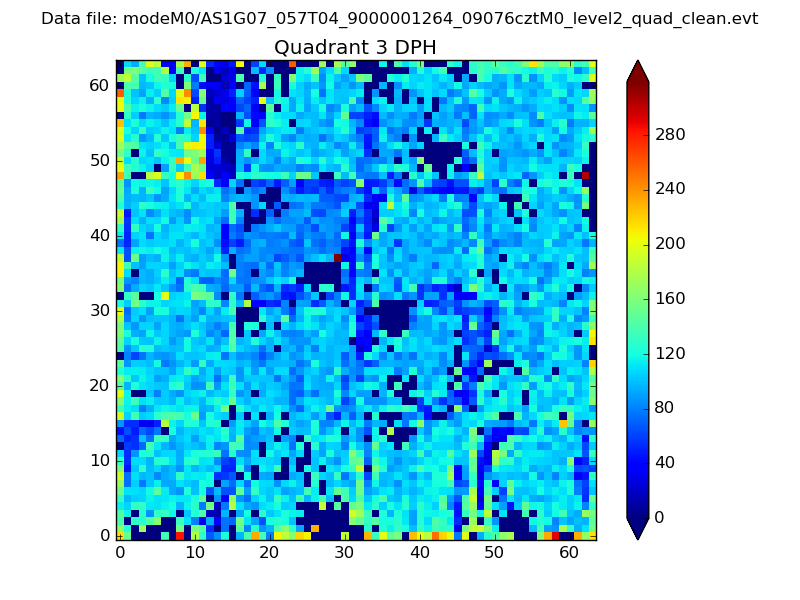 |
 |
Quadrant C |
| Plot type | Count rate plots | Images |
|---|---|---|
| Comparison with Poisson distribution Blue bars denote a histogram of data divided into 1 sec bins. Red curve is a Poisson curve with rate = median count rate of data. |
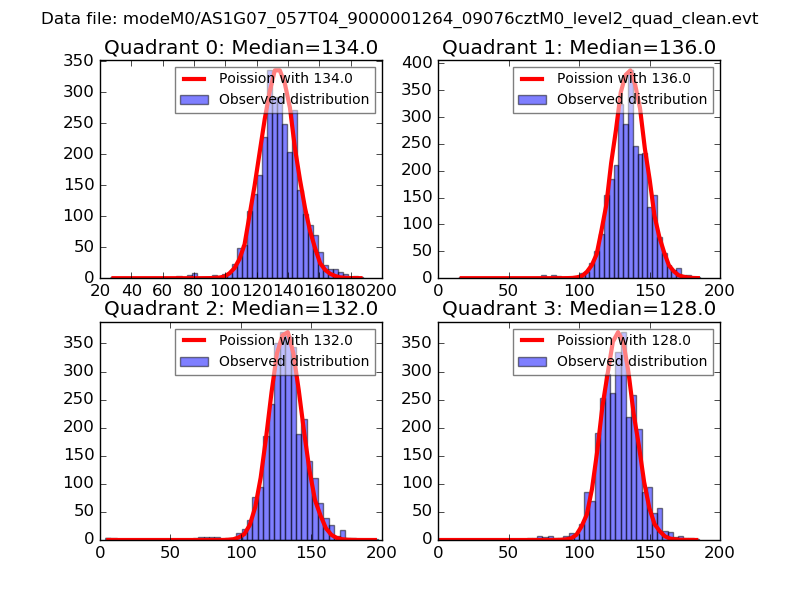 |
 |
| Quadrant-wise count rates Data is divided into 100 sec bins |
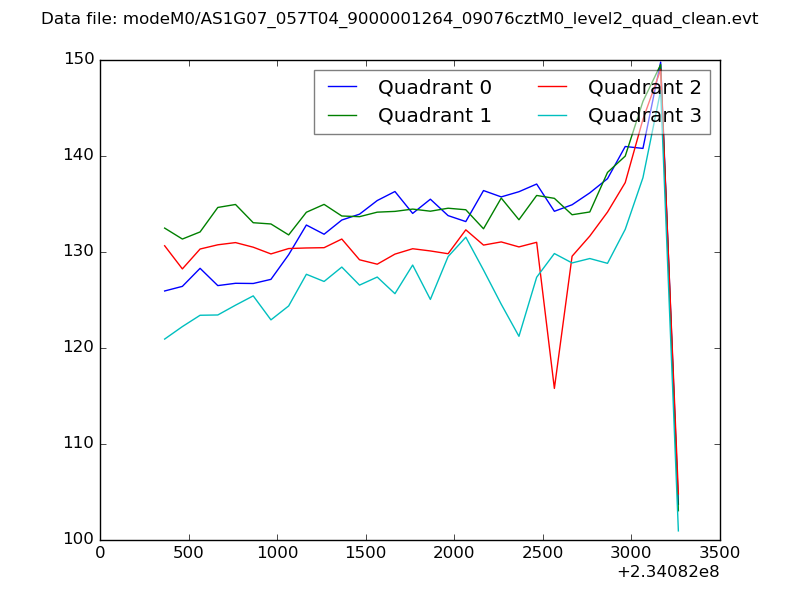 |
|
| Module-wise count rates for Quadrant A Data is divided into 100 sec bins |
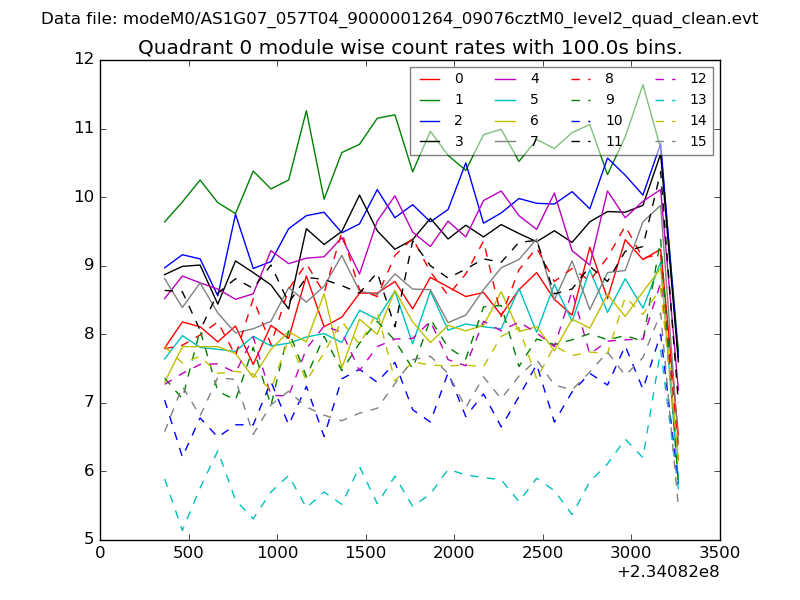 |
 |
| Module-wise count rates for Quadrant B Data is divided into 100 sec bins |
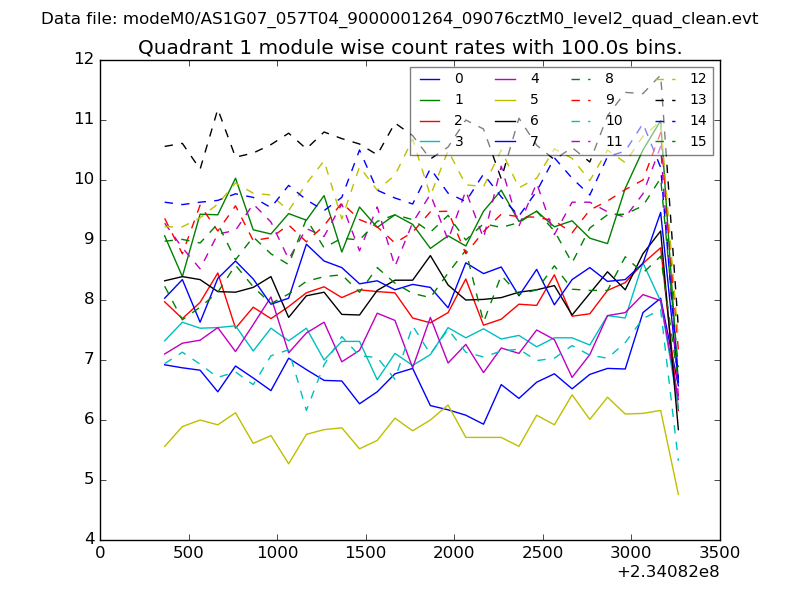 |
 |
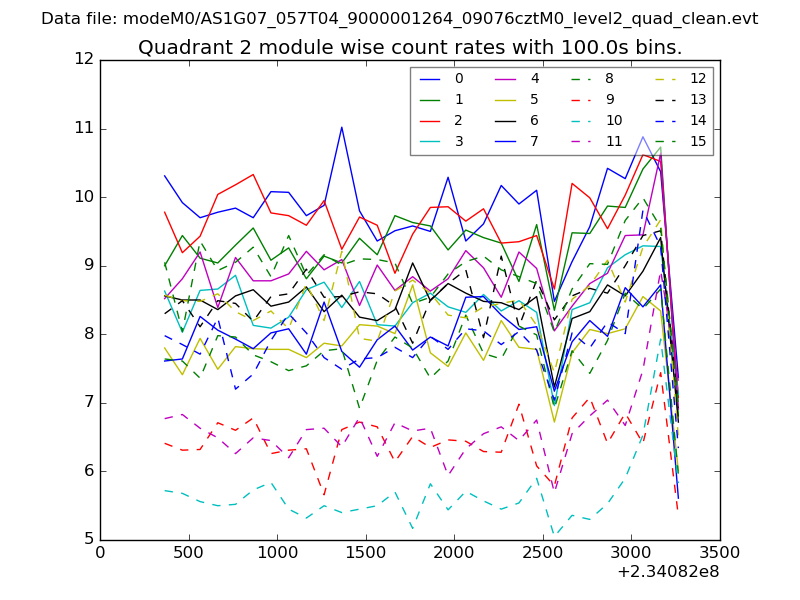
| Module-wise count rates for Quadrant C Data is divided into 100 sec bins |
 |
 |
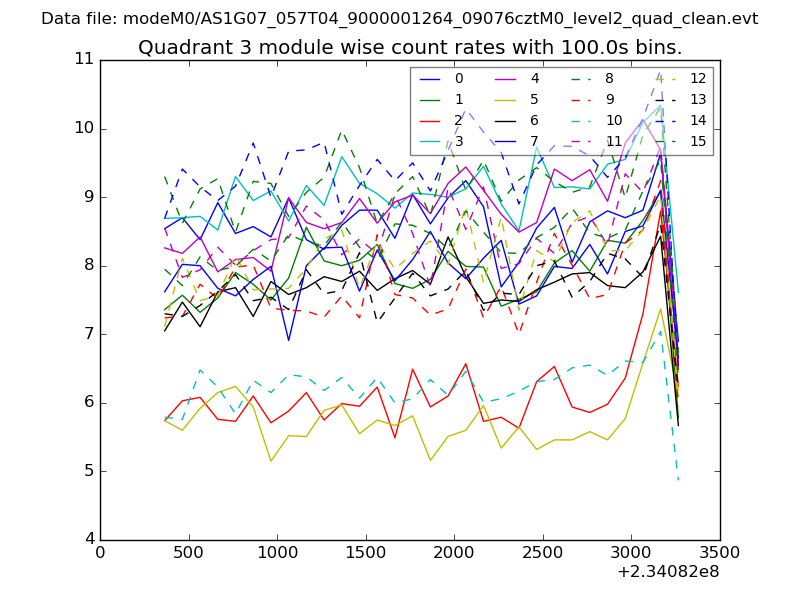
| Module-wise count rates for Quadrant D Data is divided into 100 sec bins |
 |
 |
| Parameter | Plot |
|---|---|
| CZT HV Monitor | 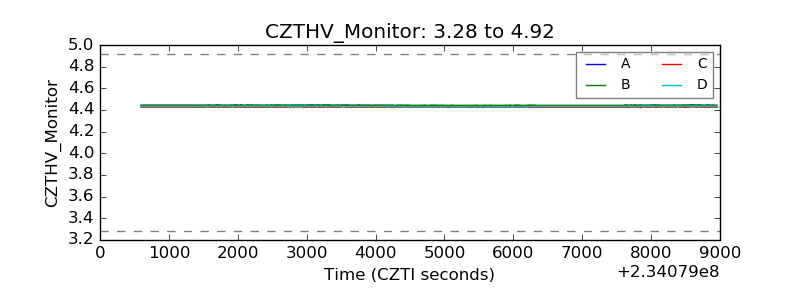 |
| D_VDD | 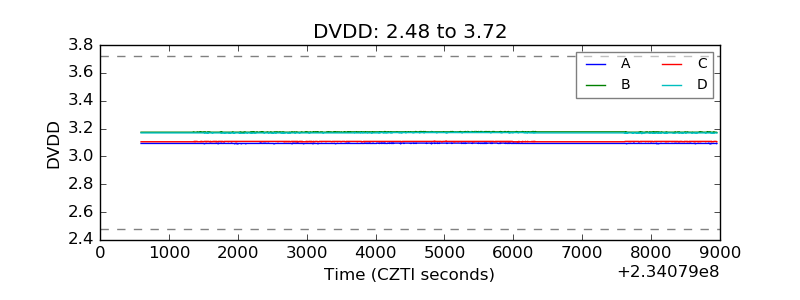 |
| Temperature 1 | 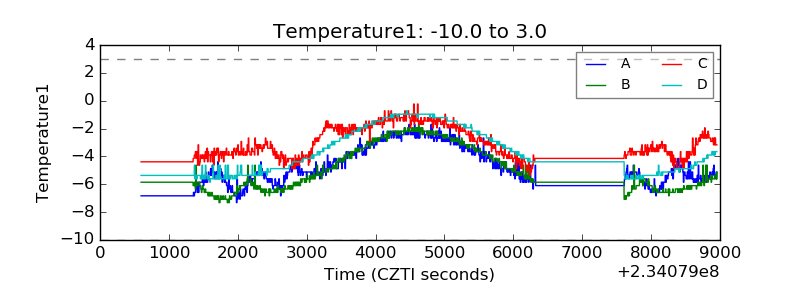 |
| Veto HV Monitor | 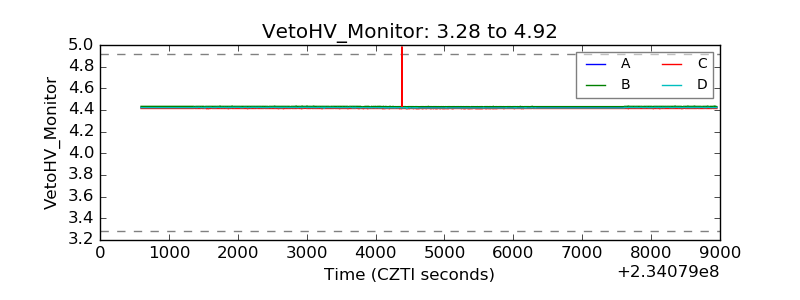 |
| Veto LLD | 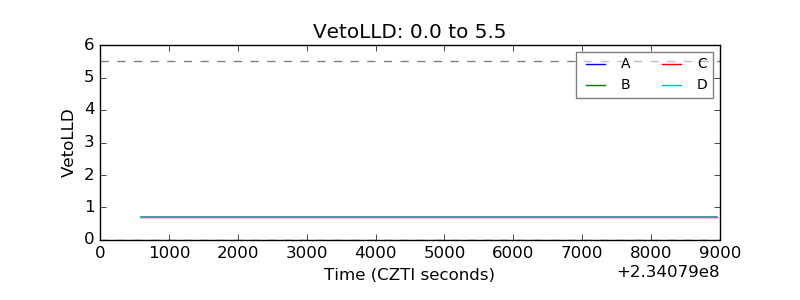 |
| Alpha Counter | 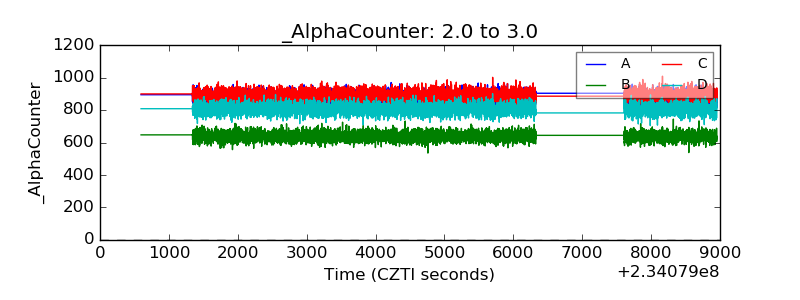 |
| _CPM_Rate | 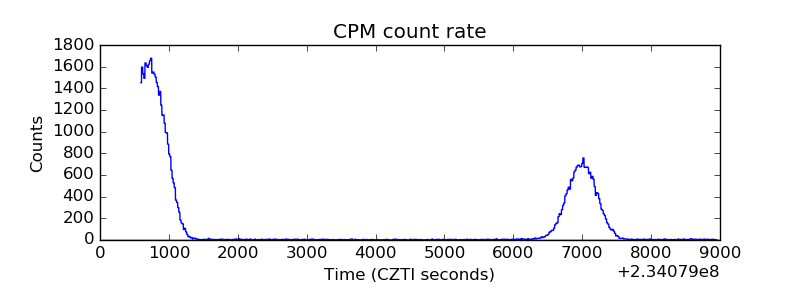 |
| CZT Counter | 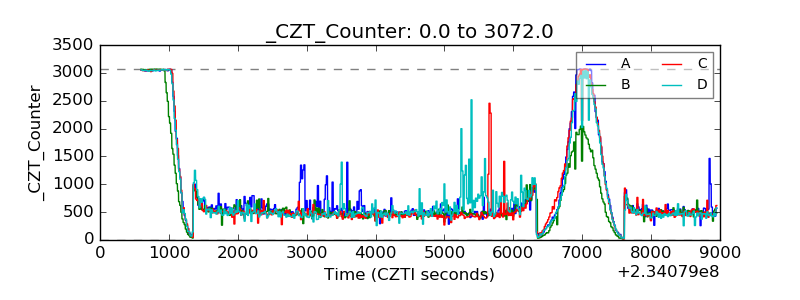 |
| +2.5 Volts monitor |  |
| +5 Volts monitor | 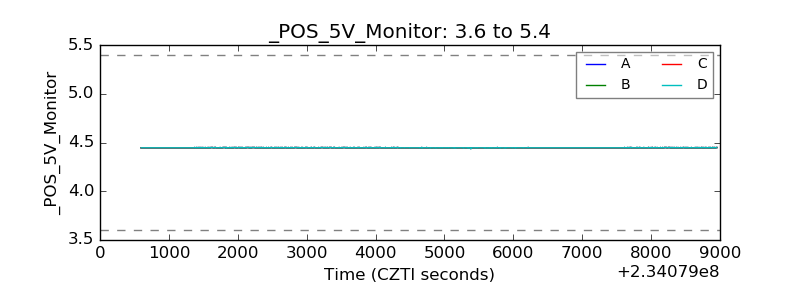 |
| _ROLL_ROT | 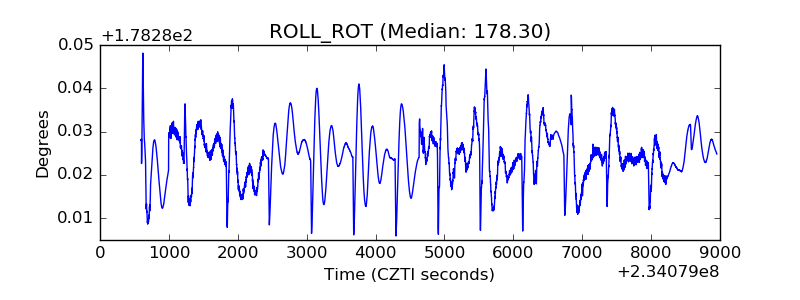 |
| _Roll_DEC | 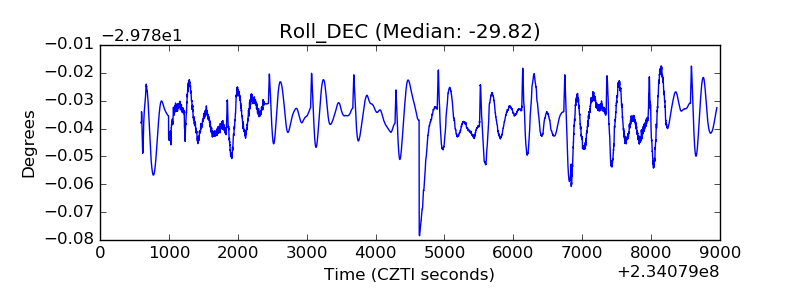 |
| _Roll_RA | 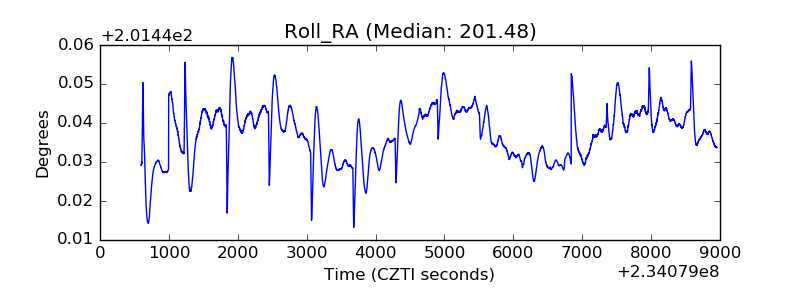 |
| Veto Counter | 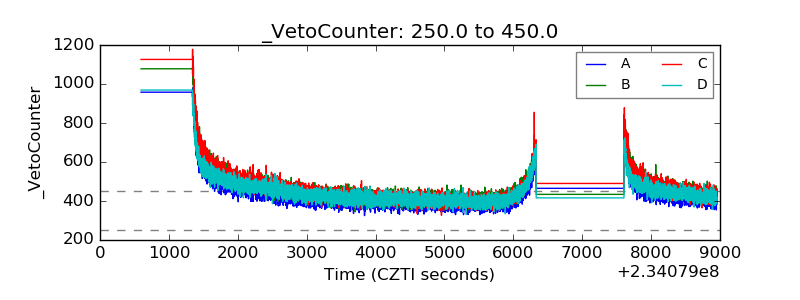 |