| Param | Original file | Final file |
|---|---|---|
| Filename | modeM0/AS1G07_057T04_9000001264_09079cztM0_level2.evt | modeM0/AS1G07_057T04_9000001264_09079cztM0_level2_quad_clean.evt |
| Size (bytes) | 536,195,520 | 90,365,760 |
| Size | 511.4 MB | 86.2 MB |
| Events in quadrant A | 4,994,190 | 556,956 |
| Events in quadrant B | 3,696,511 | 569,623 |
| Events in quadrant C | 3,405,537 | 559,575 |
| Events in quadrant D | 3,646,802 | 542,486 |
| Mode SS | |||
|---|---|---|---|
| Quadrant | BADHDUFLAG | Total packets | Discarded packets |
| A | 0 | 146 | 0 |
| B | 0 | 146 | 0 |
| C | 0 | 146 | 0 |
| D | 0 | 146 | 0 |
| Mode M0 | |||
|---|---|---|---|
| Quadrant | BADHDUFLAG | Total packets | Discarded packets |
| A | 0 | 19849 | 254 |
| B | 0 | 15718 | 110 |
| C | 0 | 15383 | 114 |
| D | 0 | 15881 | 167 |
| Quadrant | Total seconds | Saturated seconds | Saturation percentage |
|---|---|---|---|
| A | 7282 | 375 | 5.149684% |
| B | 7311 | 300 | 4.103406% |
| C | 7308 | 171 | 2.339901% |
| D | 7286 | 215 | 2.950865% |
Noise dominated data is calculated using 1-second bins in cleaned event files. If a bin has >2000 counts, and if more than 50% of those come from <1% of pixels, then it is considered to be noise-dominated and hence unusable.
| Quadrant | # 1 sec bins | Bins with >0 counts | Bins with >2000 counts | High rate bins dominated by noise | Noise dominated (total time) | Noise dominated (detector-on time) | Marked lightcurve |
|---|---|---|---|---|---|---|---|
| A | 7363 | 7359 | 54 | 54 | 0.73% | 0.73% | 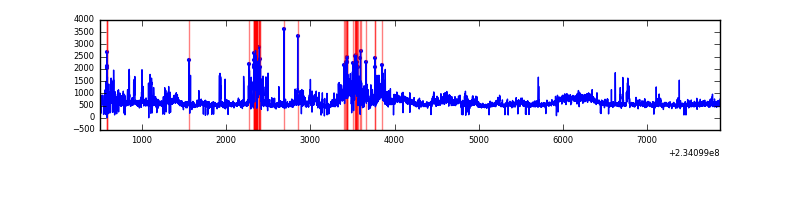 |
| B | 7362 | 7362 | 7 | 7 | 0.10% | 0.10% | 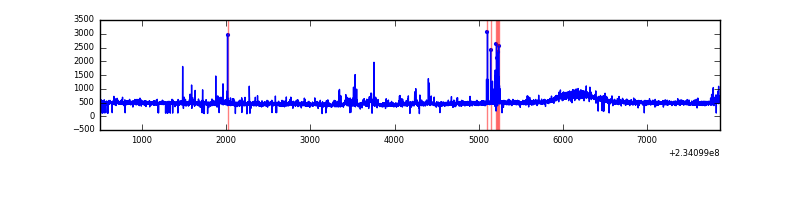 |
| C | 7363 | 7361 | 3 | 3 | 0.04% | 0.04% | 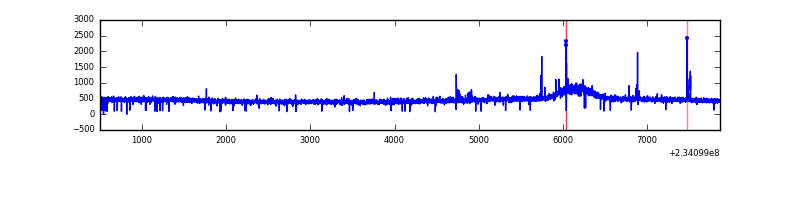 |
| D | 7363 | 7363 | 14 | 14 | 0.19% | 0.19% | 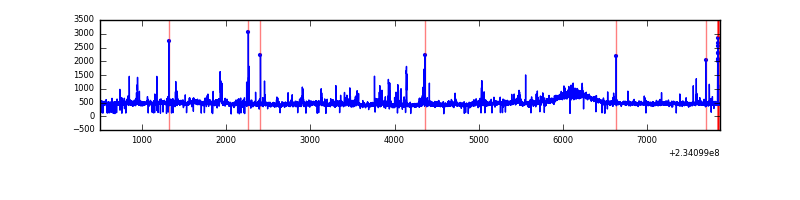 |
Top three noisy pixels from each quadrant. If the there are fewer than three noisy pixels in the level2.evt file, extra rows are filled as -1
| Pixel properties | Quadrant properties | ||||||
|---|---|---|---|---|---|---|---|
| Quadrant | DetID | PixID | Counts | Sigma | Mean | Median | Sigma |
| A | 8 | 5 | 1461222 | 8084.97 | 881 | 859 | 180.6 |
| A | 1 | 162 | 51312 | 279.32 | 881 | 859 | 180.6 |
| A | 13 | 251 | 24723 | 132.11 | 881 | 859 | 180.6 |
| B | 0 | 214 | 60531 | 350.26 | 889 | 866 | 170.3 |
| B | 4 | 80 | 43221 | 248.64 | 889 | 866 | 170.3 |
| B | 4 | 48 | 34959 | 200.14 | 889 | 866 | 170.3 |
| C | 14 | 234 | 46725 | 230.03 | 860 | 861 | 199.4 |
| C | 13 | 61 | 6663 | 29.1 | 860 | 861 | 199.4 |
| C | 12 | 4 | 3502 | 13.24 | 860 | 861 | 199.4 |
| D | 1 | 52 | 77986 | 328.23 | 857 | 838 | 235.0 |
| D | 2 | 14 | 67076 | 281.82 | 857 | 838 | 235.0 |
| D | 12 | 233 | 59386 | 249.1 | 857 | 838 | 235.0 |
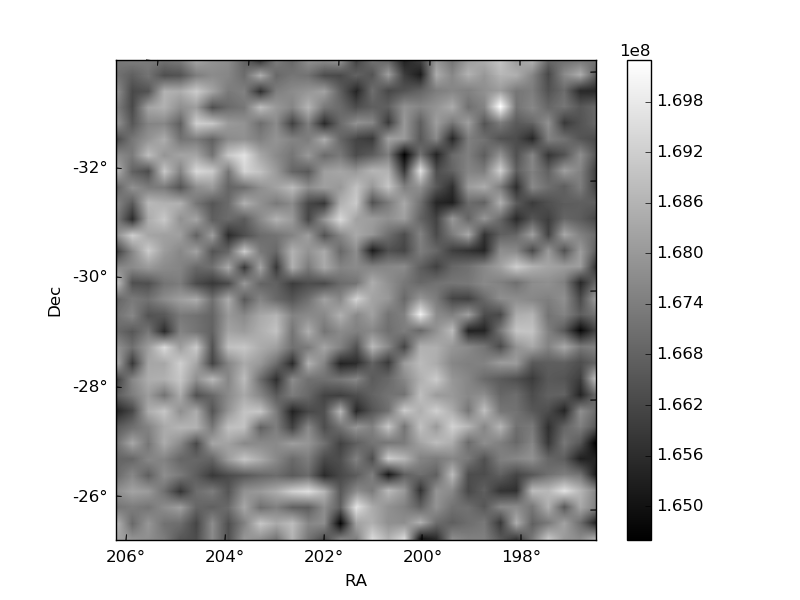
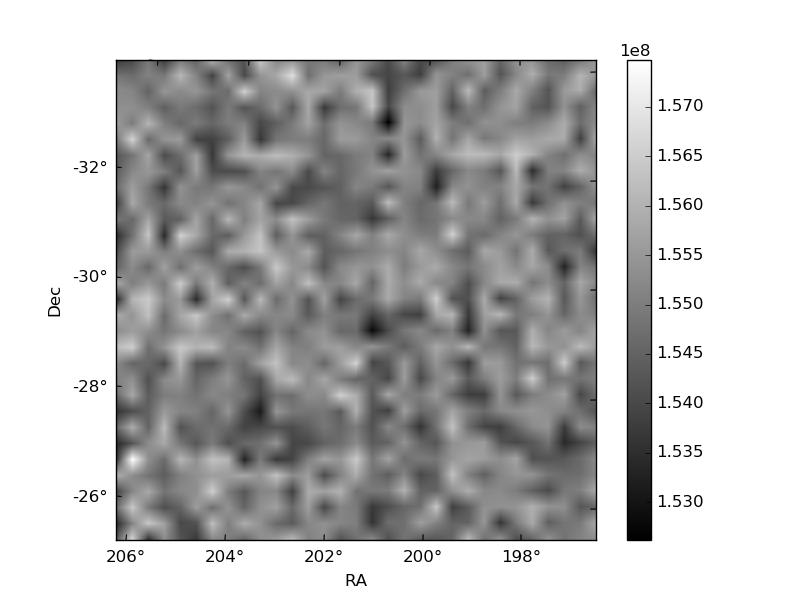
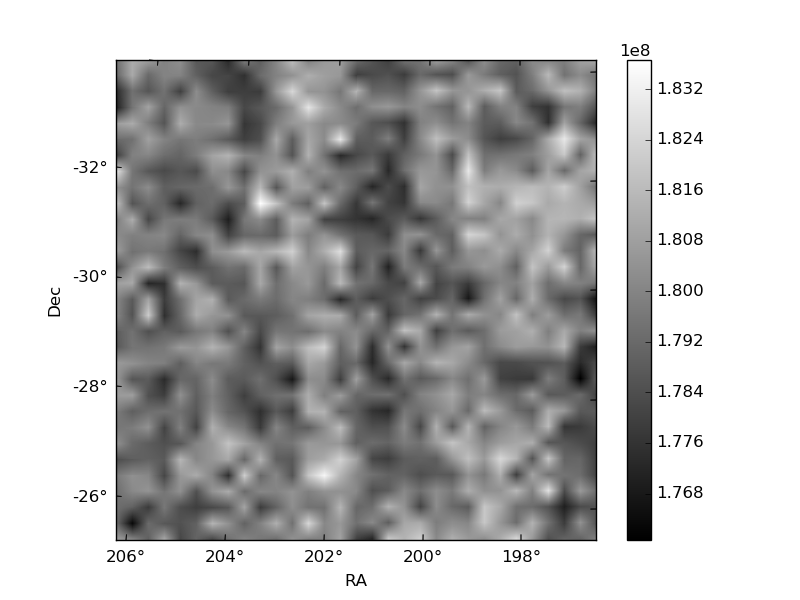
Histogram calculated using DETX and DETY for each event in the final _common_clean file
| Quadrant A |  |
 |
Quadrant B |
|---|---|---|---|
| Quadrant D |  |
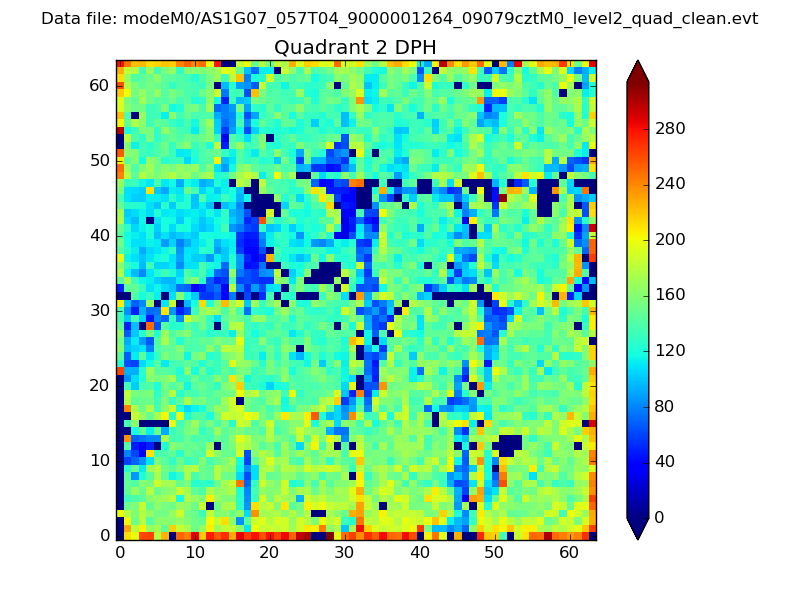 |
Quadrant C |
| Plot type | Count rate plots | Images |
|---|---|---|
| Comparison with Poisson distribution Blue bars denote a histogram of data divided into 1 sec bins. Red curve is a Poisson curve with rate = median count rate of data. |
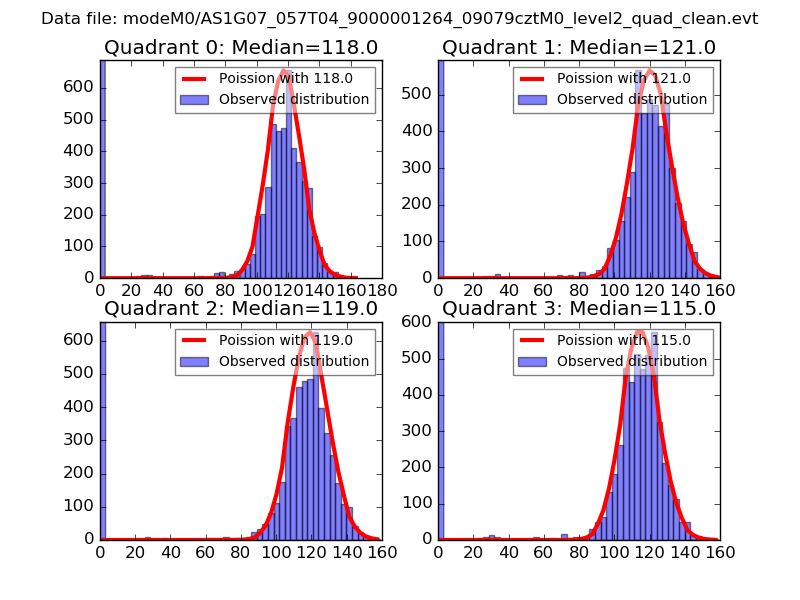 |
 |
| Quadrant-wise count rates Data is divided into 100 sec bins |
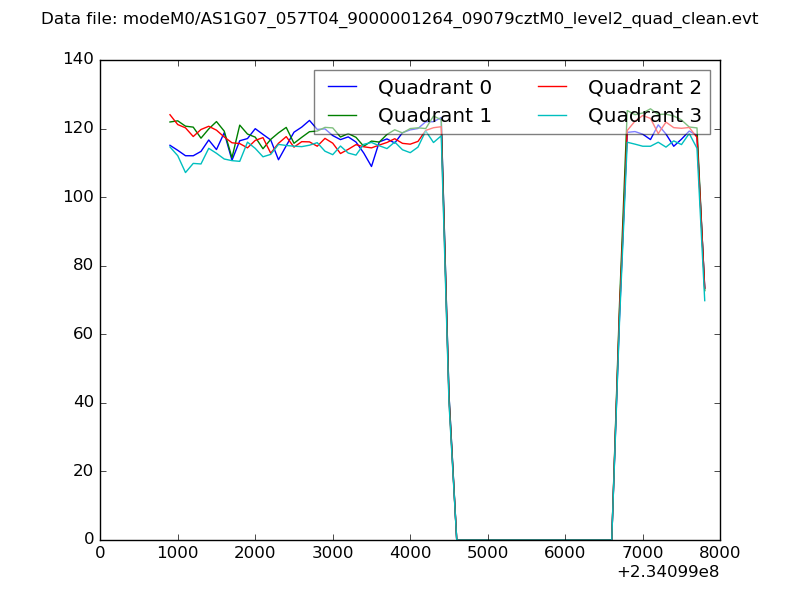 |
|
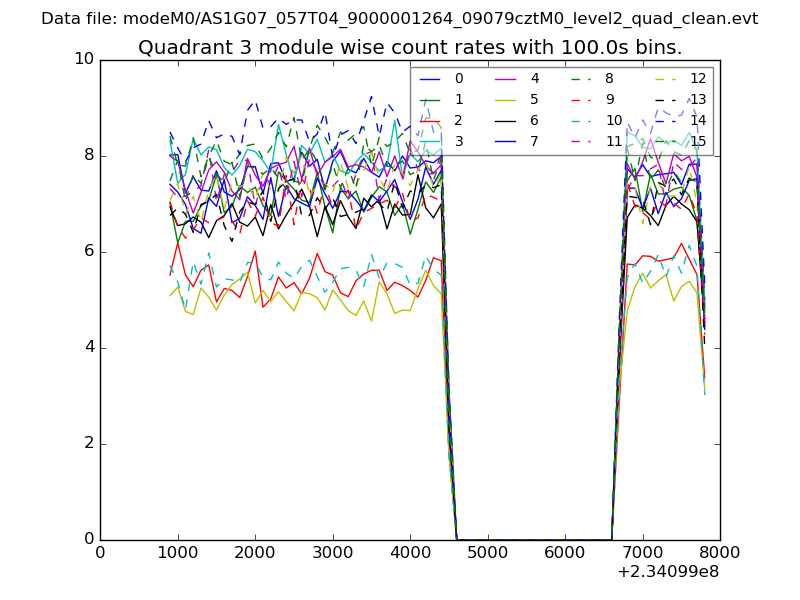
| Module-wise count rates for Quadrant A Data is divided into 100 sec bins |
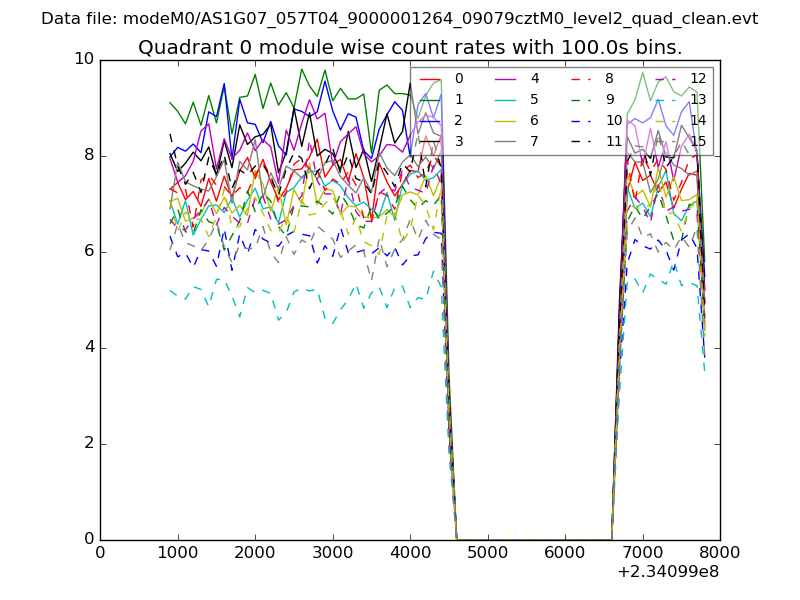 |
 |
| Module-wise count rates for Quadrant B Data is divided into 100 sec bins |
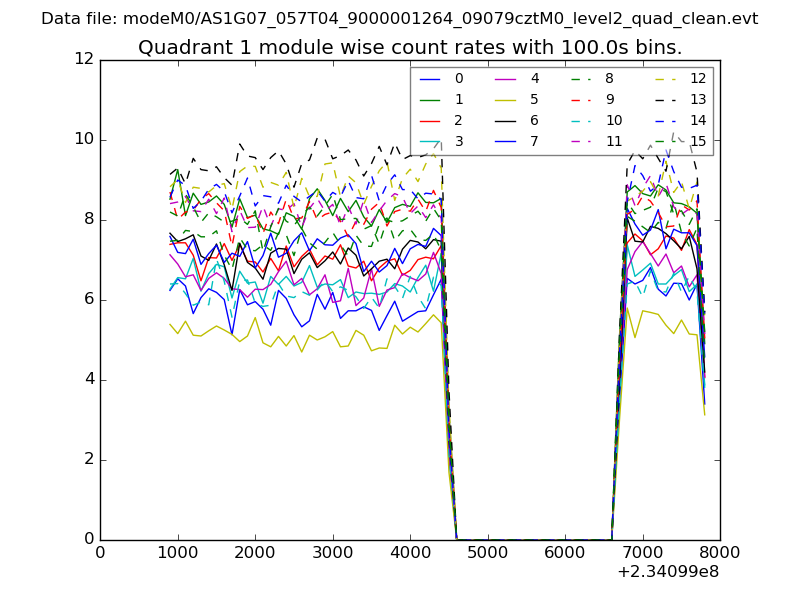 |
 |
| Module-wise count rates for Quadrant C Data is divided into 100 sec bins |
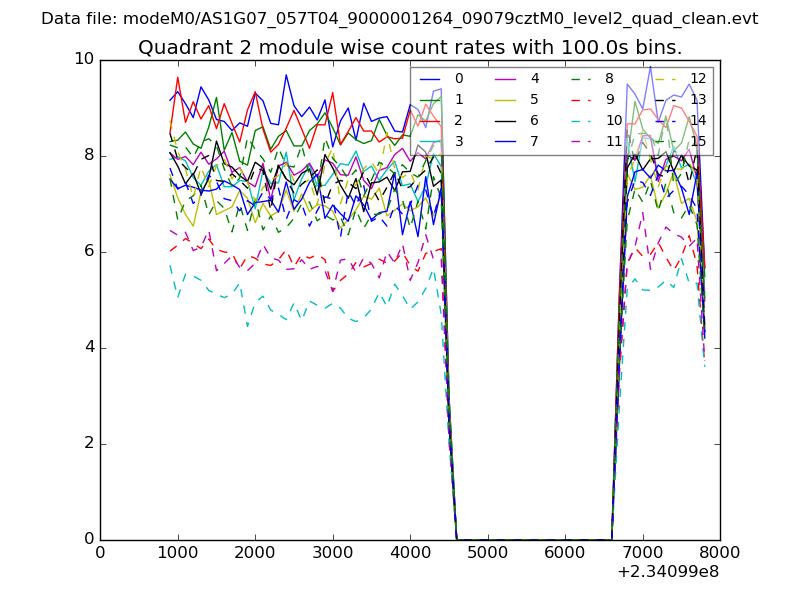 |
 |
| Module-wise count rates for Quadrant D Data is divided into 100 sec bins |
 |
 |
| Parameter | Plot |
|---|---|
| CZT HV Monitor | 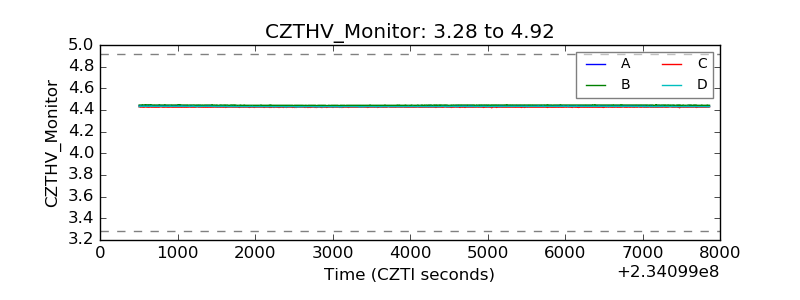 |
| D_VDD | 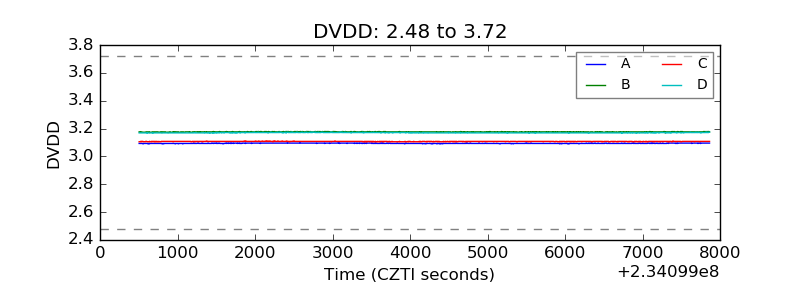 |
| Temperature 1 | 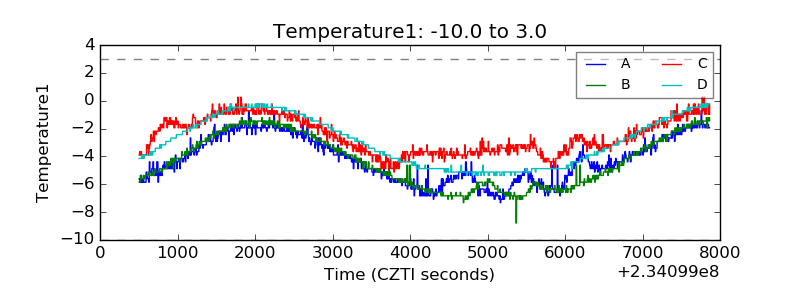 |
| Veto HV Monitor | 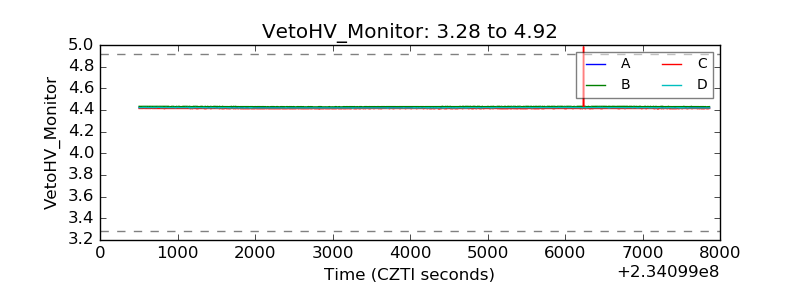 |
| Veto LLD | 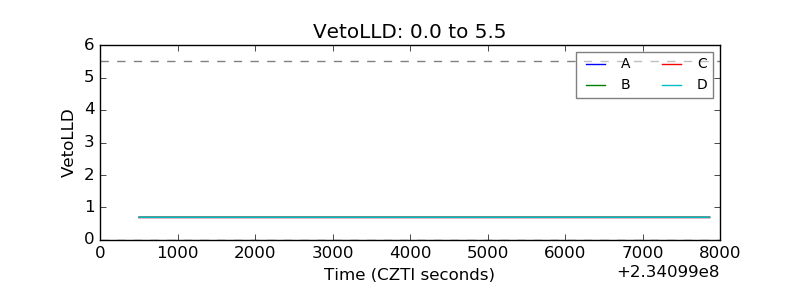 |
| Alpha Counter | 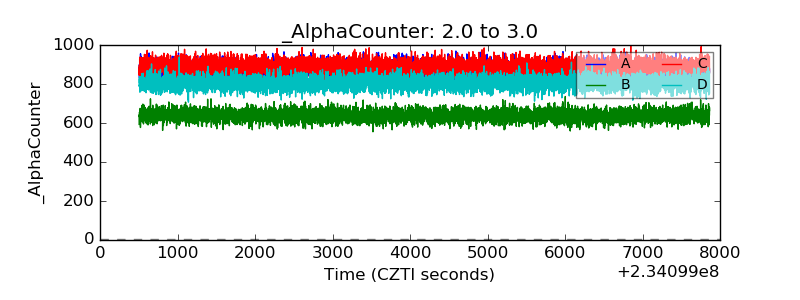 |
| _CPM_Rate | 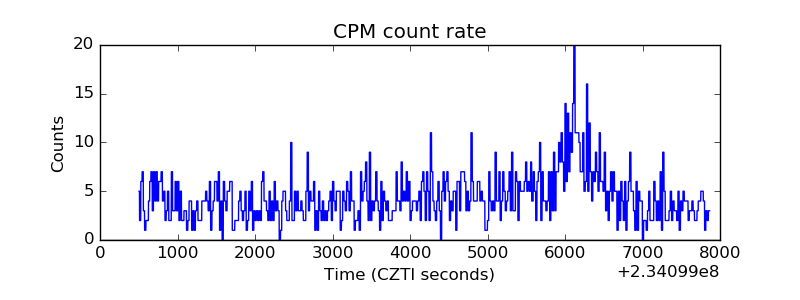 |
| CZT Counter | 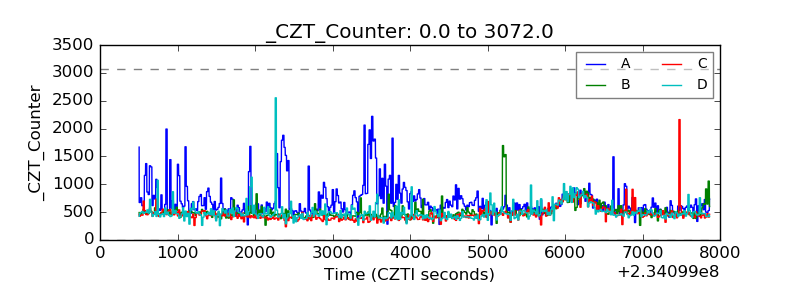 |
| +2.5 Volts monitor |  |
| +5 Volts monitor |  |
| _ROLL_ROT | 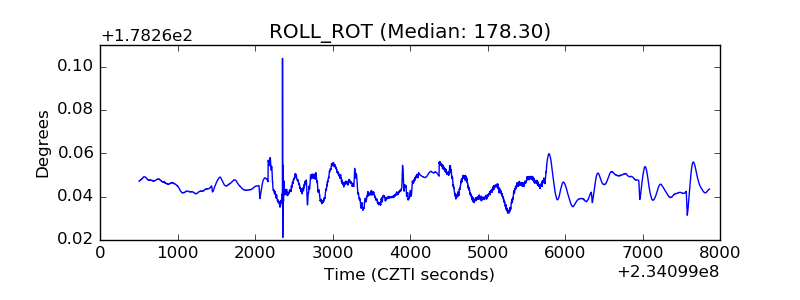 |
| _Roll_DEC | 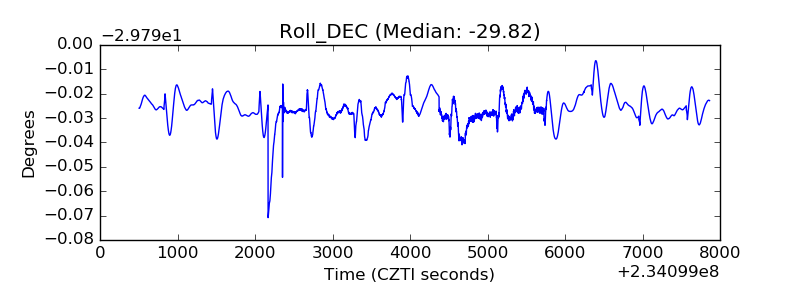 |
| _Roll_RA | 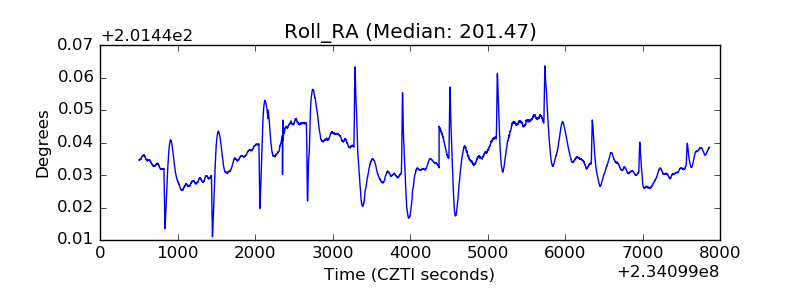 |
| Veto Counter | 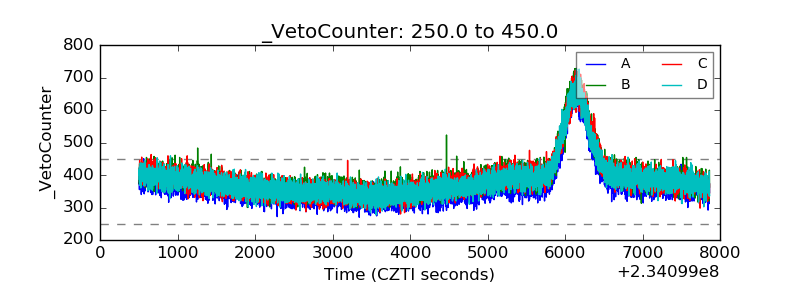 |