| Param | Original file | Final file |
|---|---|---|
| Filename | modeM0/AS1G07_057T04_9000001264_09080cztM0_level2.evt | modeM0/AS1G07_057T04_9000001264_09080cztM0_level2_quad_clean.evt |
| Size (bytes) | 570,533,760 | 92,088,000 |
| Size | 544.1 MB | 87.8 MB |
| Events in quadrant A | 6,235,594 | 565,995 |
| Events in quadrant B | 3,709,741 | 591,176 |
| Events in quadrant C | 3,289,777 | 578,864 |
| Events in quadrant D | 3,567,512 | 564,109 |
| Mode SS | |||
|---|---|---|---|
| Quadrant | BADHDUFLAG | Total packets | Discarded packets |
| A | 0 | 144 | 2 |
| B | 0 | 144 | 2 |
| C | 0 | 144 | 4 |
| D | 0 | 144 | 2 |
| Mode M0 | |||
|---|---|---|---|
| Quadrant | BADHDUFLAG | Total packets | Discarded packets |
| A | 0 | 23758 | 539 |
| B | 0 | 15800 | 224 |
| C | 0 | 14972 | 195 |
| D | 0 | 15635 | 236 |
| Mode M9 | |||
|---|---|---|---|
| Quadrant | BADHDUFLAG | Total packets | Discarded packets |
| A | 0 | 1 | 0 |
| B | 0 | 1 | 0 |
| C | 0 | 1 | 0 |
| D | 0 | 1 | 0 |
| Quadrant | Total seconds | Saturated seconds | Saturation percentage |
|---|---|---|---|
| A | 6987 | 742 | 10.619722% |
| B | 7027 | 200 | 2.846165% |
| C | 7034 | 105 | 1.492750% |
| D | 7021 | 192 | 2.734653% |
Noise dominated data is calculated using 1-second bins in cleaned event files. If a bin has >2000 counts, and if more than 50% of those come from <1% of pixels, then it is considered to be noise-dominated and hence unusable.
| Quadrant | # 1 sec bins | Bins with >0 counts | Bins with >2000 counts | High rate bins dominated by noise | Noise dominated (total time) | Noise dominated (detector-on time) | Marked lightcurve |
|---|---|---|---|---|---|---|---|
| A | 7193 | 7112 | 373 | 373 | 5.19% | 5.24% | 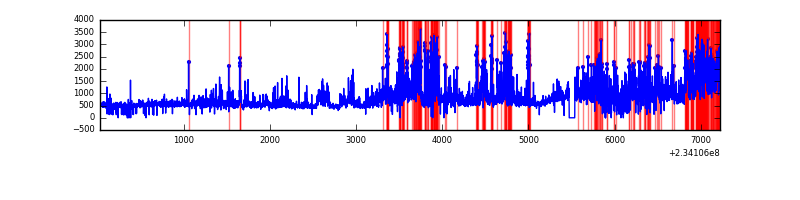 |
| B | 7194 | 7122 | 5 | 5 | 0.07% | 0.07% | 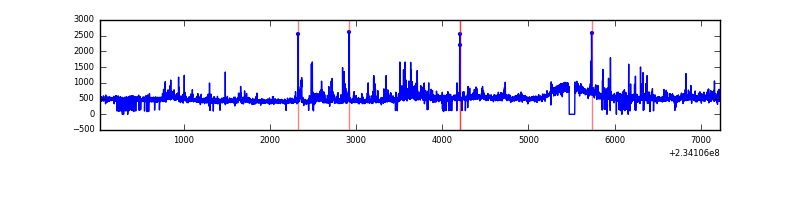 |
| C | 7194 | 7125 | 12 | 12 | 0.17% | 0.17% | 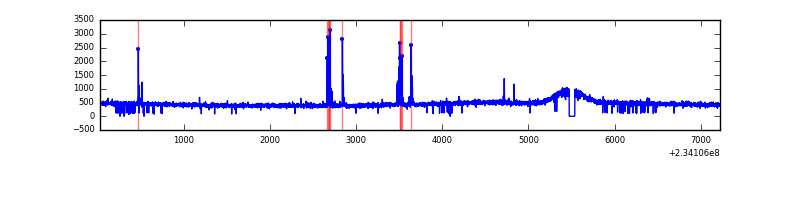 |
| D | 7194 | 7126 | 50 | 50 | 0.70% | 0.70% | 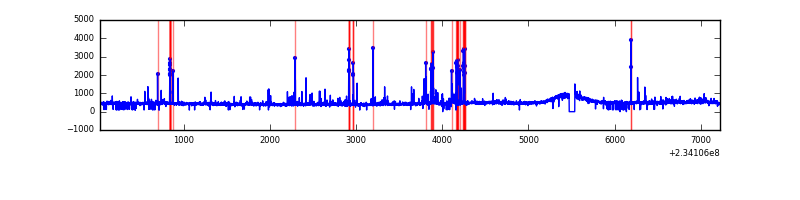 |
Top three noisy pixels from each quadrant. If the there are fewer than three noisy pixels in the level2.evt file, extra rows are filled as -1
| Pixel properties | Quadrant properties | ||||||
|---|---|---|---|---|---|---|---|
| Quadrant | DetID | PixID | Counts | Sigma | Mean | Median | Sigma |
| A | 8 | 5 | 2984883 | 17461.27 | 827 | 808 | 170.9 |
| A | 1 | 162 | 28899 | 164.37 | 827 | 808 | 170.9 |
| A | 5 | 16 | 11708 | 63.78 | 827 | 808 | 170.9 |
| B | 4 | 48 | 197509 | 1192.02 | 849 | 827 | 165.0 |
| B | 0 | 214 | 91858 | 551.71 | 849 | 827 | 165.0 |
| B | 0 | 230 | 26295 | 154.35 | 849 | 827 | 165.0 |
| C | 14 | 234 | 87962 | 456.73 | 820 | 822 | 190.8 |
| C | 13 | 61 | 6297 | 28.7 | 820 | 822 | 190.8 |
| C | 8 | 222 | 3474 | 13.9 | 820 | 822 | 190.8 |
| D | 1 | 52 | 159336 | 768.26 | 825 | 796 | 206.4 |
| D | 2 | 14 | 101195 | 486.52 | 825 | 796 | 206.4 |
| D | 13 | 104 | 48198 | 229.7 | 825 | 796 | 206.4 |
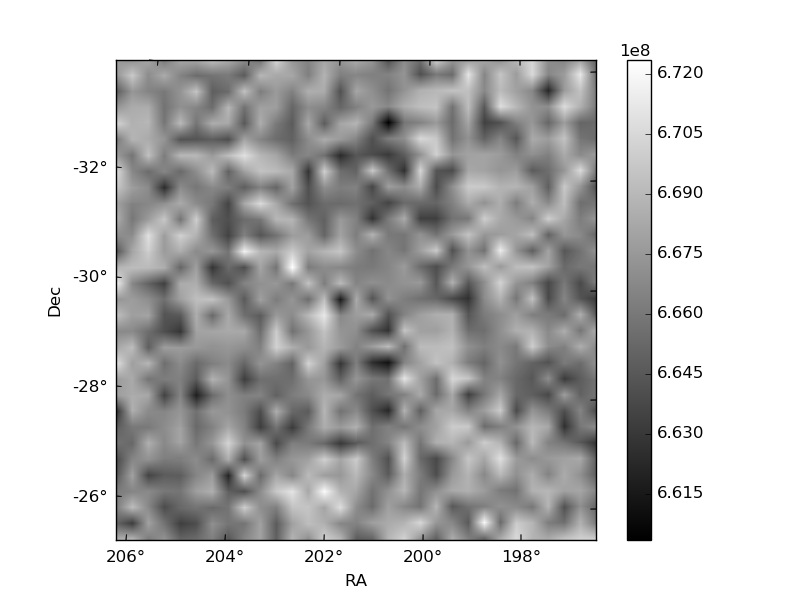
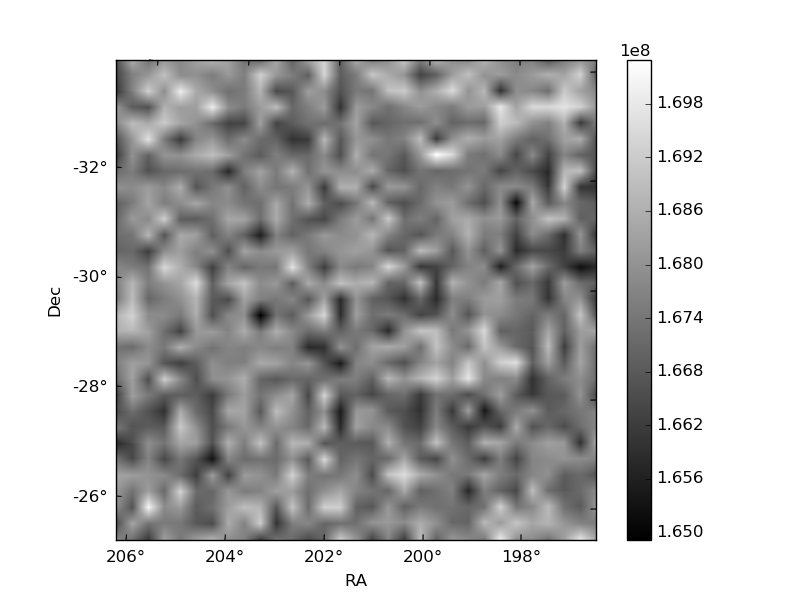
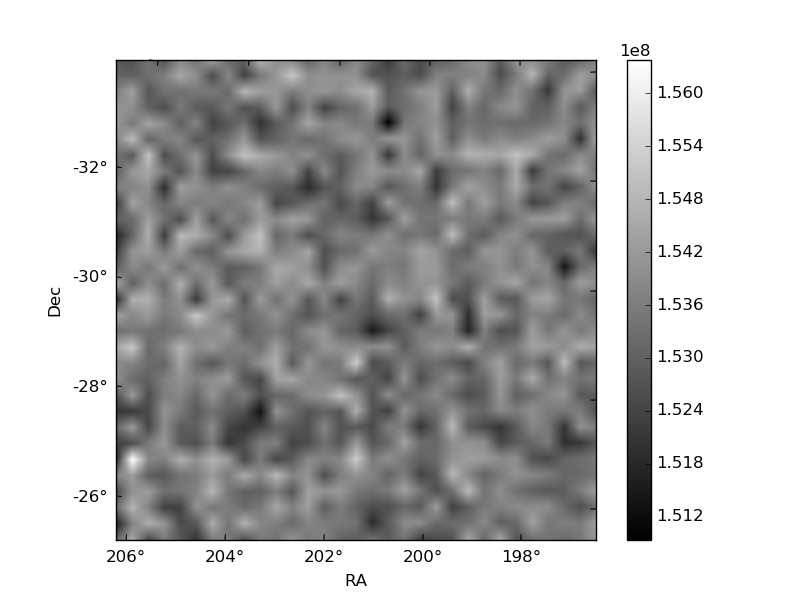
Histogram calculated using DETX and DETY for each event in the final _common_clean file
| Quadrant A | 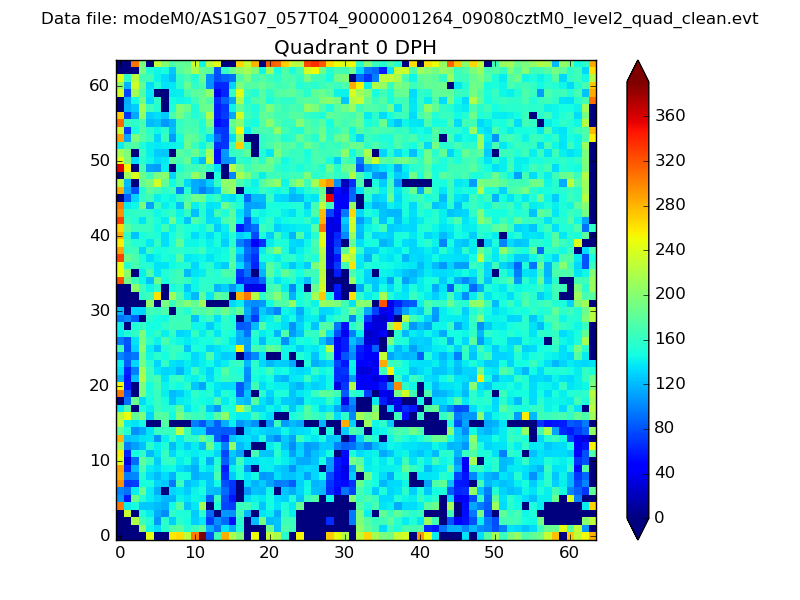 |
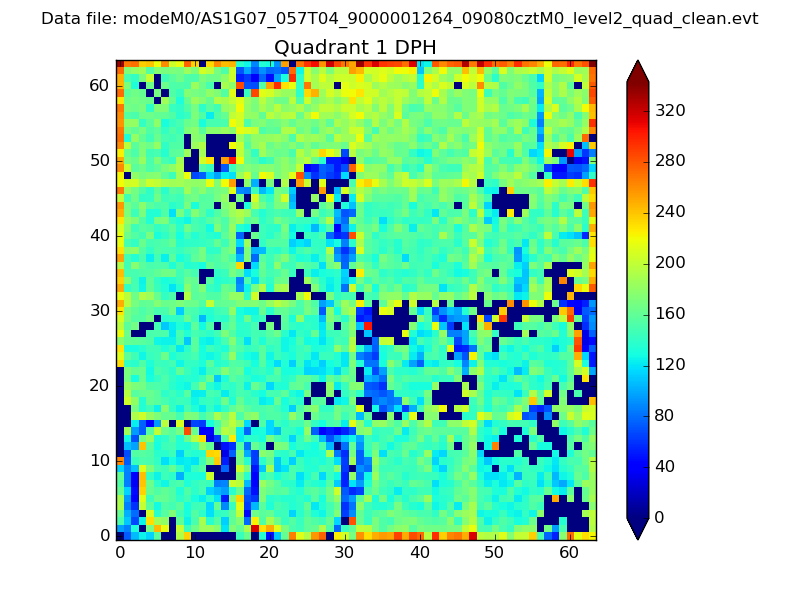 |
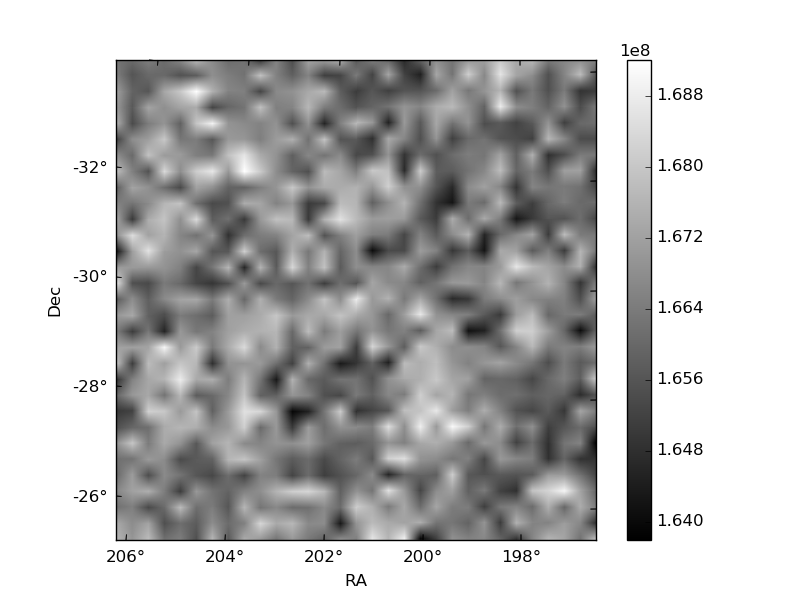
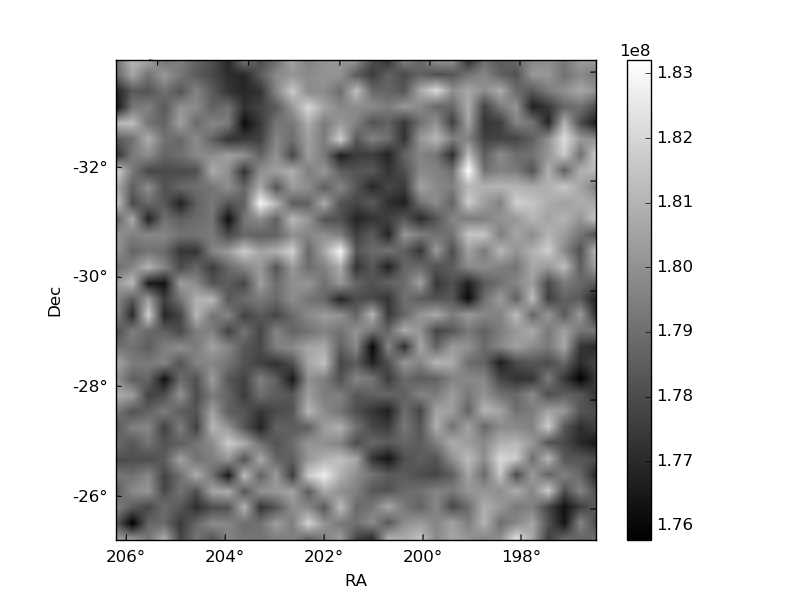
Quadrant B |
|---|---|---|---|
| Quadrant D | 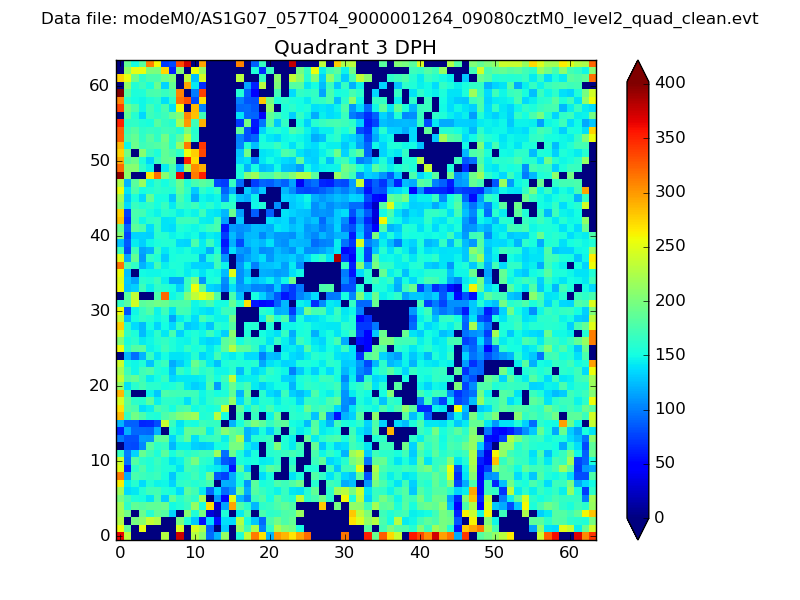 |
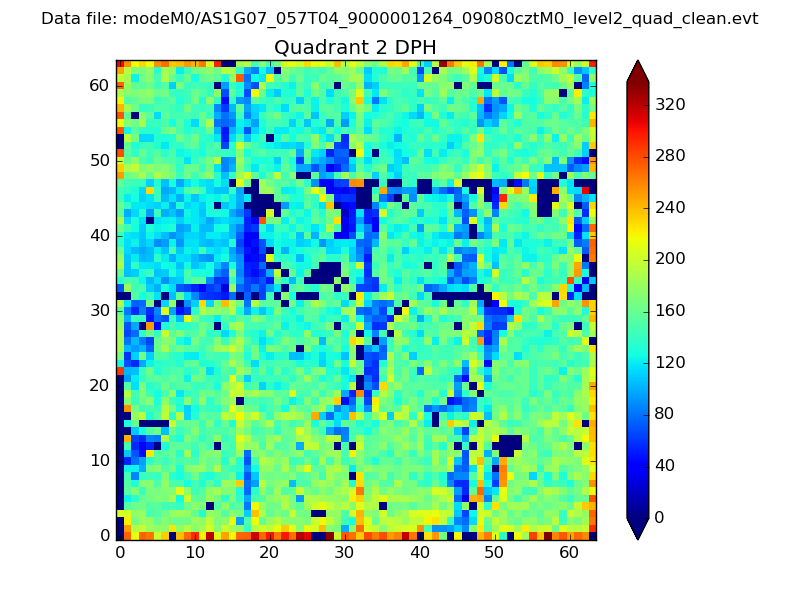 |
Quadrant C |
| Plot type | Count rate plots | Images |
|---|---|---|
| Comparison with Poisson distribution Blue bars denote a histogram of data divided into 1 sec bins. Red curve is a Poisson curve with rate = median count rate of data. |
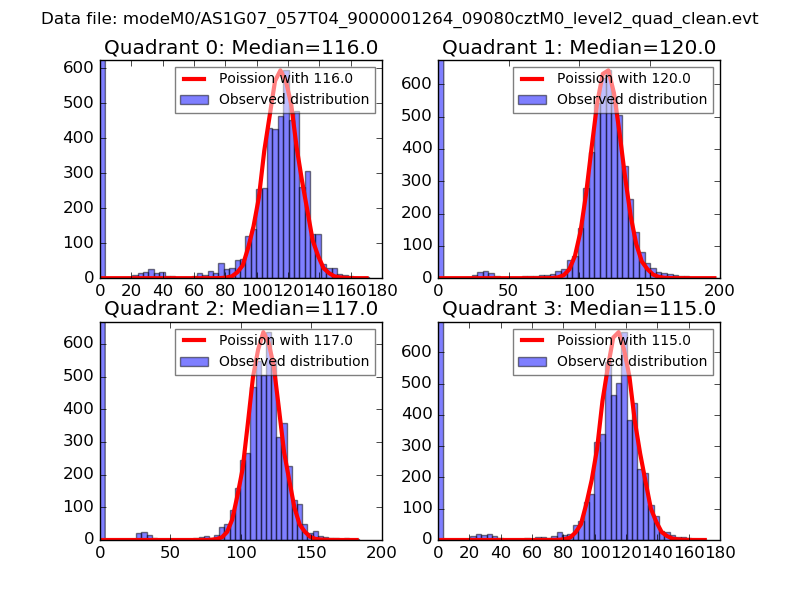 |
 |
| Quadrant-wise count rates Data is divided into 100 sec bins |
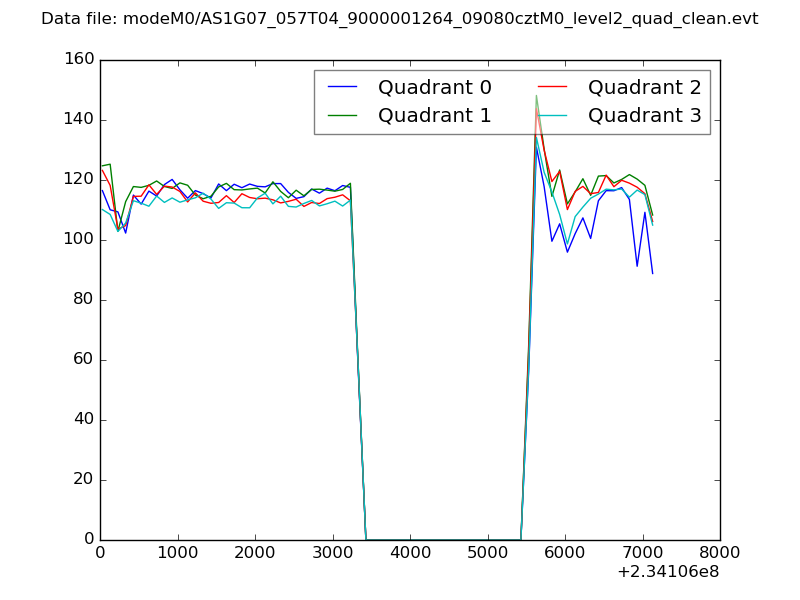 |
|
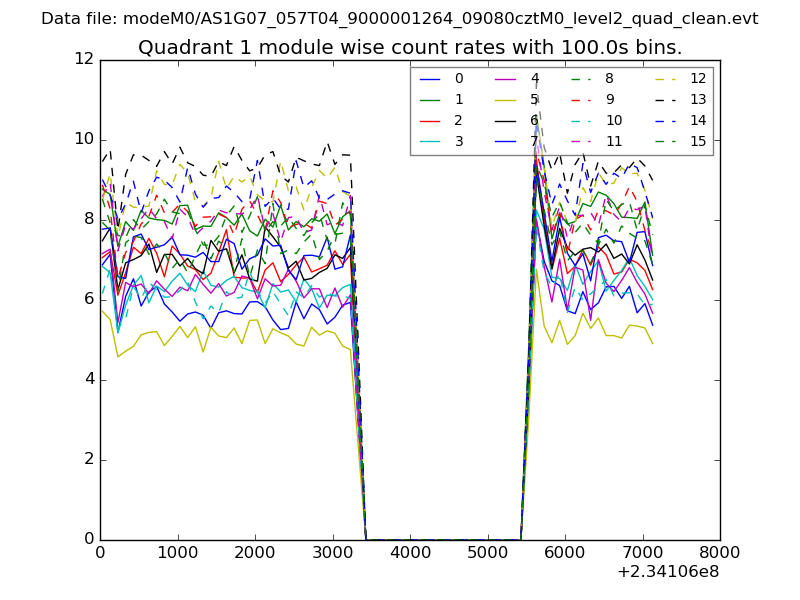
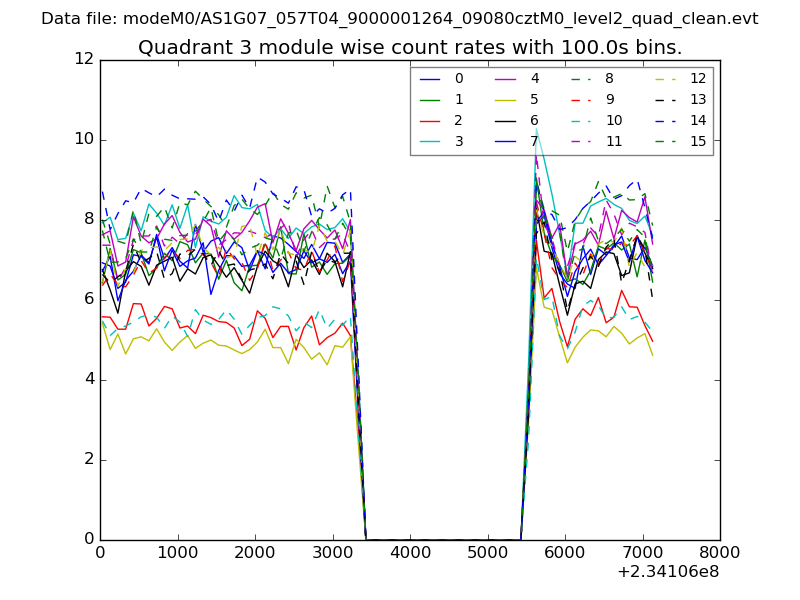
| Module-wise count rates for Quadrant A Data is divided into 100 sec bins |
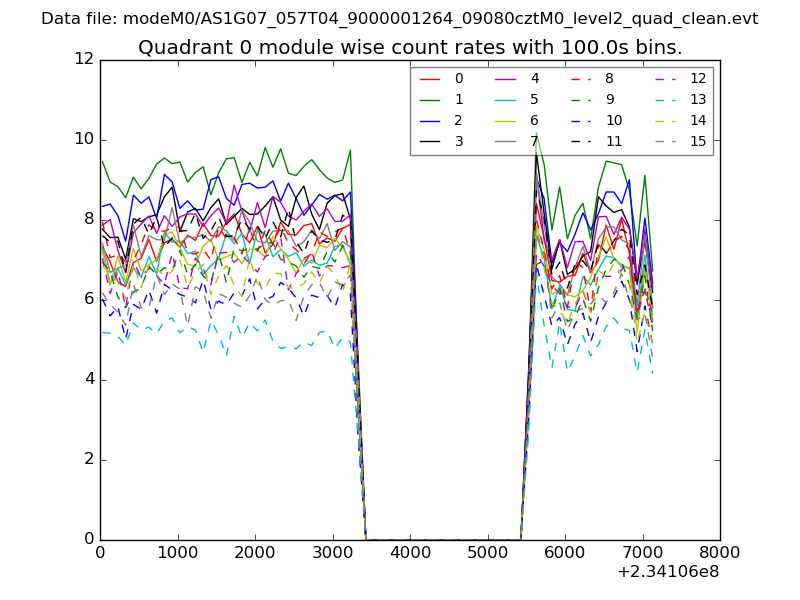 |
 |
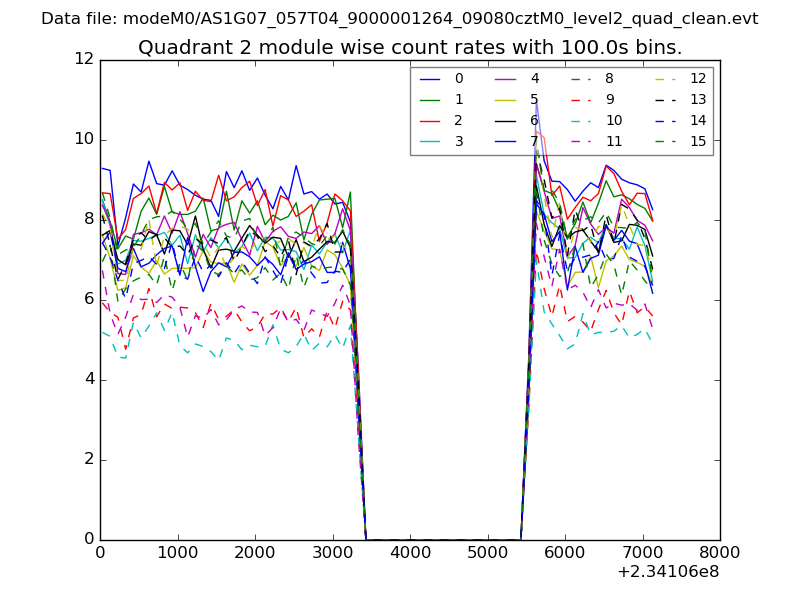
| Module-wise count rates for Quadrant B Data is divided into 100 sec bins |
 |
 |
| Module-wise count rates for Quadrant C Data is divided into 100 sec bins |
 |
 |
| Module-wise count rates for Quadrant D Data is divided into 100 sec bins |
 |
 |
| Parameter | Plot |
|---|---|
| CZT HV Monitor | 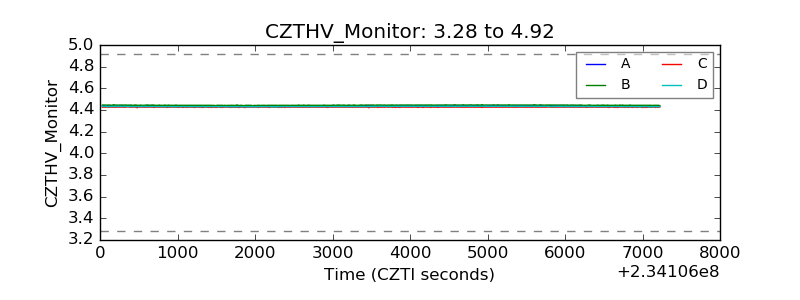 |
| D_VDD | 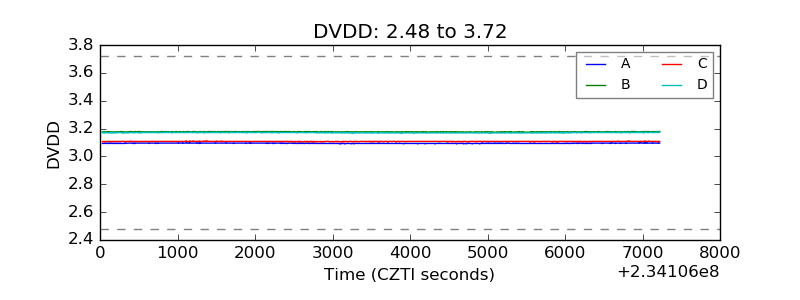 |
| Temperature 1 | 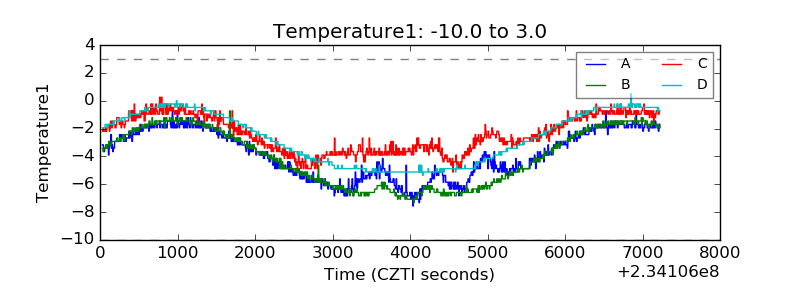 |
| Veto HV Monitor | 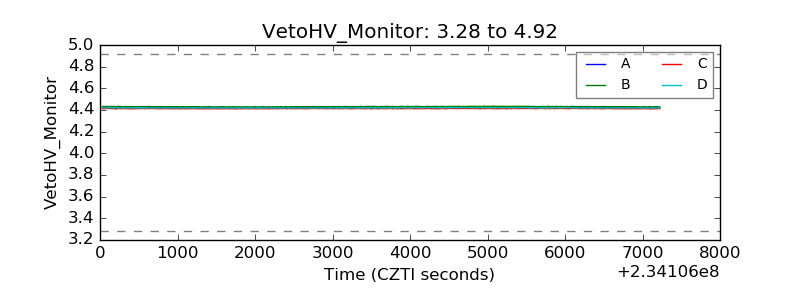 |
| Veto LLD | 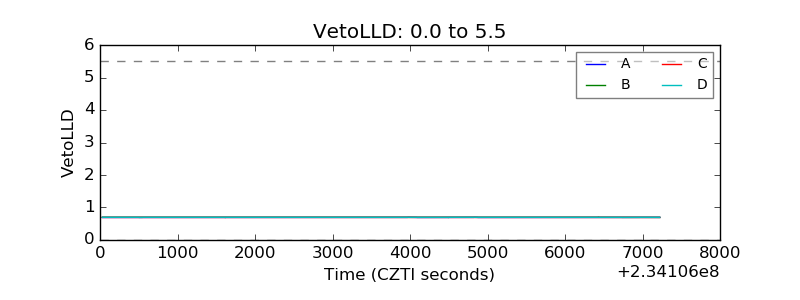 |
| Alpha Counter | 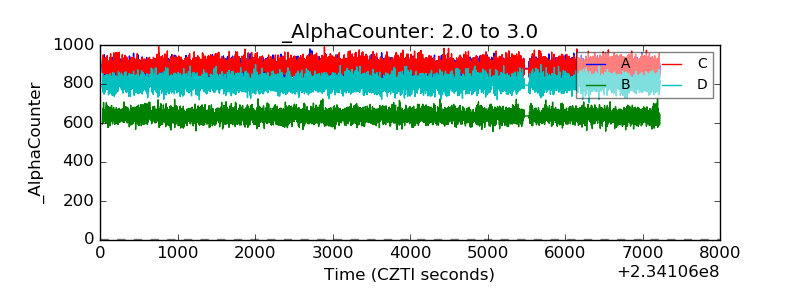 |
| _CPM_Rate | 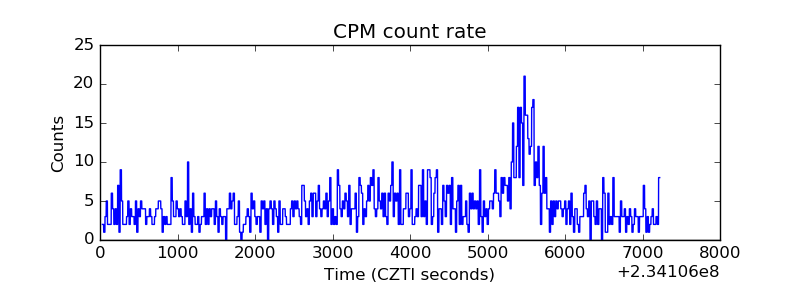 |
| CZT Counter | 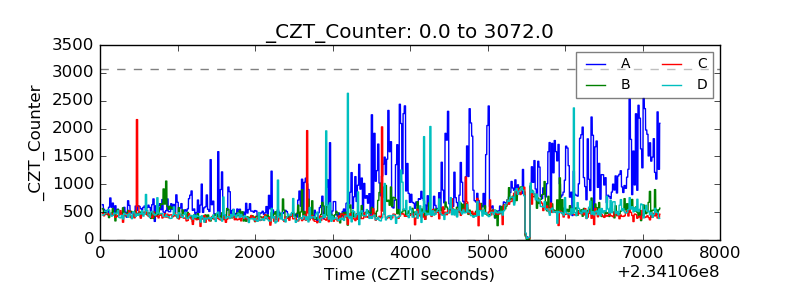 |
| +2.5 Volts monitor |  |
| +5 Volts monitor | 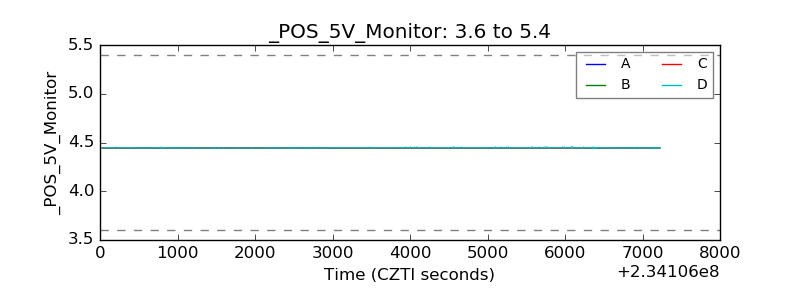 |
| _ROLL_ROT | 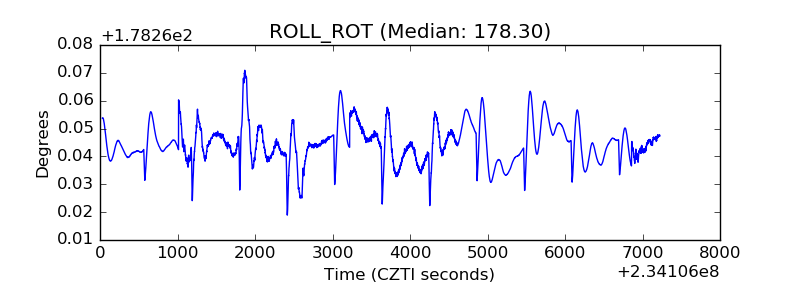 |
| _Roll_DEC | 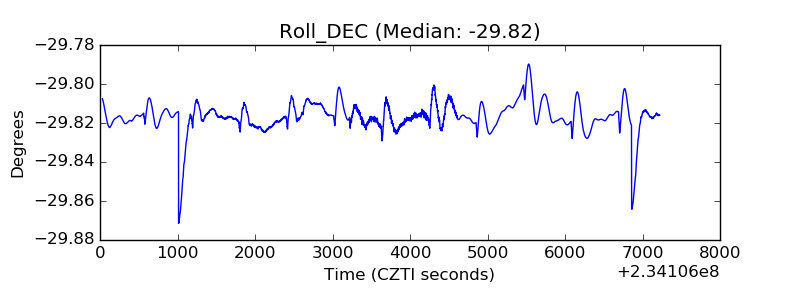 |
| _Roll_RA | 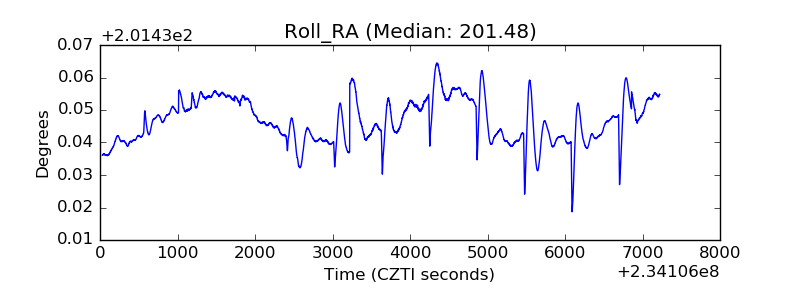 |
| Veto Counter | 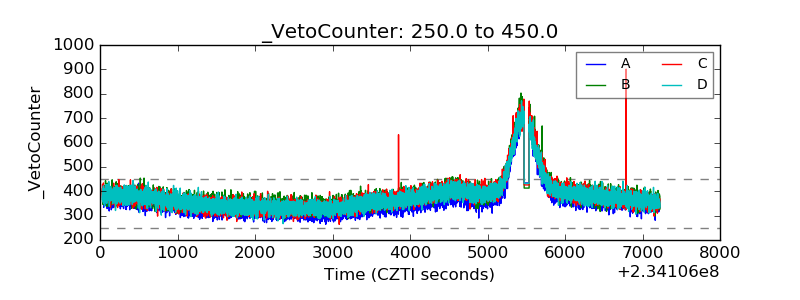 |