| Param | Original file | Final file |
|---|---|---|
| Filename | modeM0/AS1G07_057T04_9000001264_09081cztM0_level2.evt | modeM0/AS1G07_057T04_9000001264_09081cztM0_level2_quad_clean.evt |
| Size (bytes) | 279,423,360 | 49,573,440 |
| Size | 266.5 MB | 47.3 MB |
| Events in quadrant A | 4,011,222 | 302,611 |
| Events in quadrant B | 1,463,095 | 339,651 |
| Events in quadrant C | 1,274,764 | 332,433 |
| Events in quadrant D | 1,517,914 | 322,030 |
| Mode SS | |||
|---|---|---|---|
| Quadrant | BADHDUFLAG | Total packets | Discarded packets |
| A | 0 | 58 | 0 |
| B | 0 | 58 | 0 |
| C | 0 | 58 | 0 |
| D | 0 | 58 | 0 |
| Mode M0 | |||
|---|---|---|---|
| Quadrant | BADHDUFLAG | Total packets | Discarded packets |
| A | 0 | 14227 | 334 |
| B | 0 | 6442 | 141 |
| C | 0 | 6018 | 111 |
| D | 0 | 6520 | 128 |
| Quadrant | Total seconds | Saturated seconds | Saturation percentage |
|---|---|---|---|
| A | 2831 | 715 | 25.256093% |
| B | 2860 | 50 | 1.748252% |
| C | 2861 | 21 | 0.734009% |
| D | 2856 | 53 | 1.855742% |
Noise dominated data is calculated using 1-second bins in cleaned event files. If a bin has >2000 counts, and if more than 50% of those come from <1% of pixels, then it is considered to be noise-dominated and hence unusable.
| Quadrant | # 1 sec bins | Bins with >0 counts | Bins with >2000 counts | High rate bins dominated by noise | Noise dominated (total time) | Noise dominated (detector-on time) | Marked lightcurve |
|---|---|---|---|---|---|---|---|
| A | 2904 | 2883 | 542 | 542 | 18.66% | 18.80% |  |
| B | 2904 | 2889 | 1 | 1 | 0.03% | 0.03% |  |
| C | 2904 | 2895 | 0 | 0 | 0.00% | 0.00% | 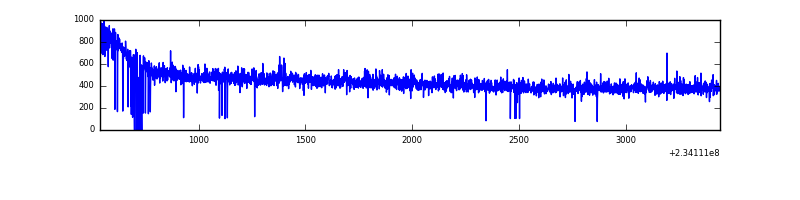 |
| D | 2905 | 2895 | 19 | 19 | 0.65% | 0.66% | 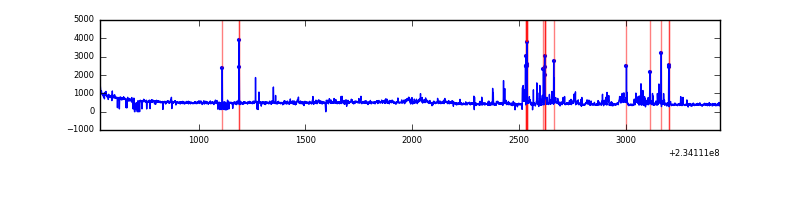 |
Top three noisy pixels from each quadrant. If the there are fewer than three noisy pixels in the level2.evt file, extra rows are filled as -1
| Pixel properties | Quadrant properties | ||||||
|---|---|---|---|---|---|---|---|
| Quadrant | DetID | PixID | Counts | Sigma | Mean | Median | Sigma |
| A | 8 | 5 | 2726393 | 40478.95 | 320 | 313 | 67.3 |
| A | 1 | 162 | 26697 | 391.77 | 320 | 313 | 67.3 |
| A | 1 | 178 | 6096 | 85.87 | 320 | 313 | 67.3 |
| B | 4 | 48 | 64799 | 954.28 | 338 | 330 | 67.6 |
| B | 0 | 214 | 56590 | 832.77 | 338 | 330 | 67.6 |
| B | 0 | 230 | 13804 | 199.45 | 338 | 330 | 67.6 |
| C | 13 | 61 | 2497 | 28.01 | 326 | 326 | 77.5 |
| C | 14 | 234 | 2256 | 24.9 | 326 | 326 | 77.5 |
| C | 3 | 202 | 842 | 6.66 | 326 | 326 | 77.5 |
| D | 7 | 71 | 123223 | 1466.43 | 331 | 320 | 83.8 |
| D | 6 | 225 | 46011 | 545.17 | 331 | 320 | 83.8 |
| D | 8 | 195 | 30845 | 364.21 | 331 | 320 | 83.8 |
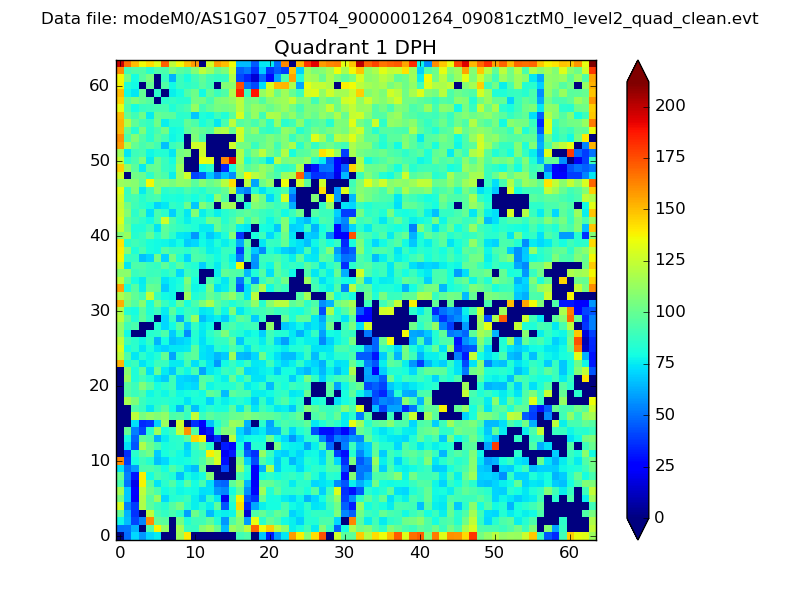
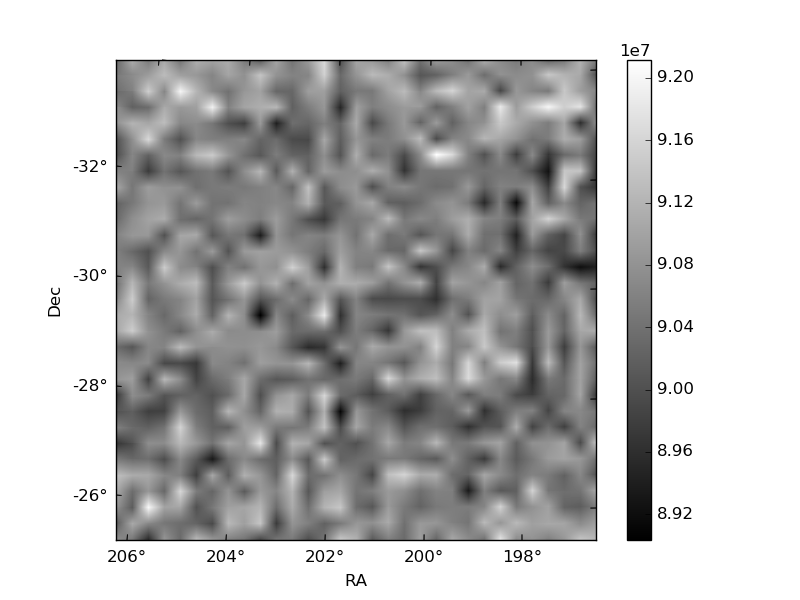
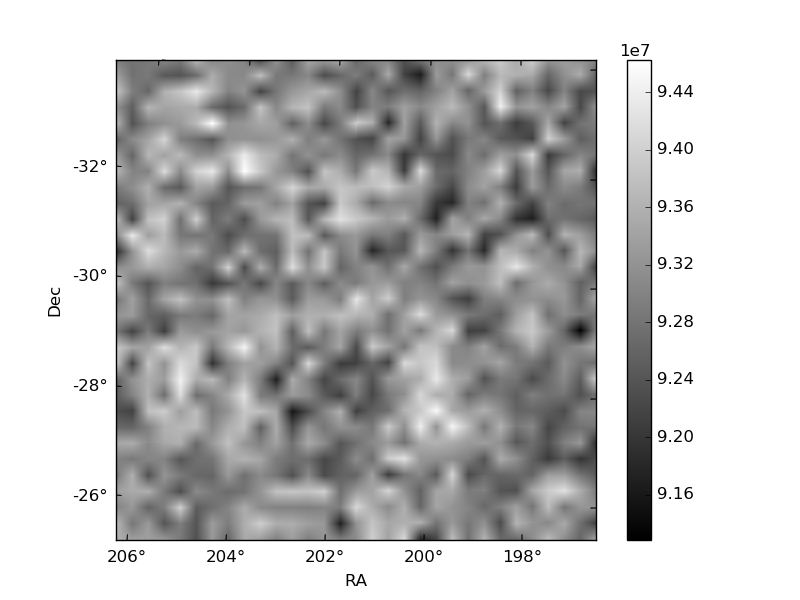
Histogram calculated using DETX and DETY for each event in the final _common_clean file
| Quadrant A |  |
 |
Quadrant B |
|---|---|---|---|
| Quadrant D | 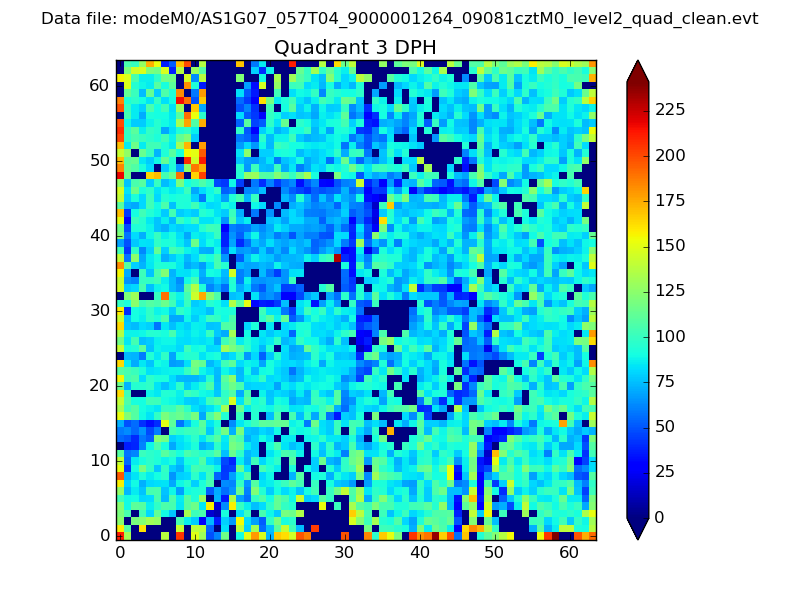 |
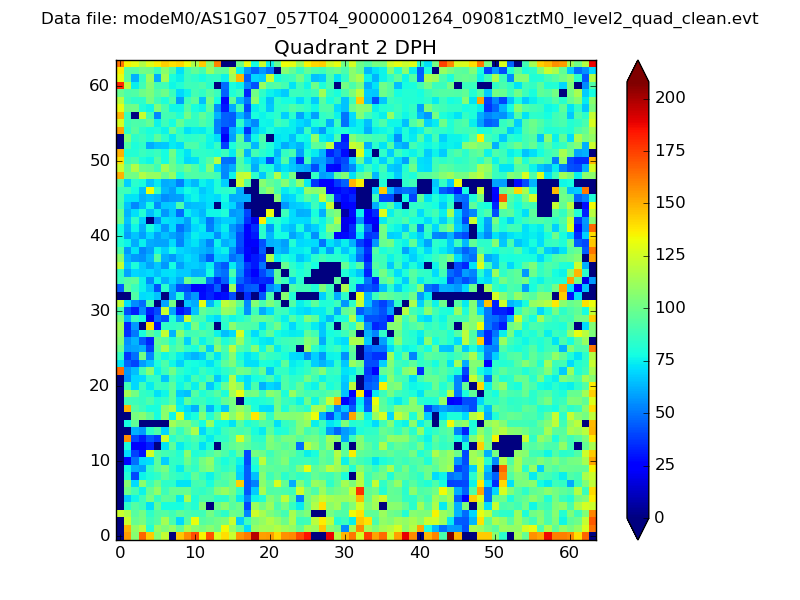 |
Quadrant C |
| Plot type | Count rate plots | Images |
|---|---|---|
| Comparison with Poisson distribution Blue bars denote a histogram of data divided into 1 sec bins. Red curve is a Poisson curve with rate = median count rate of data. |
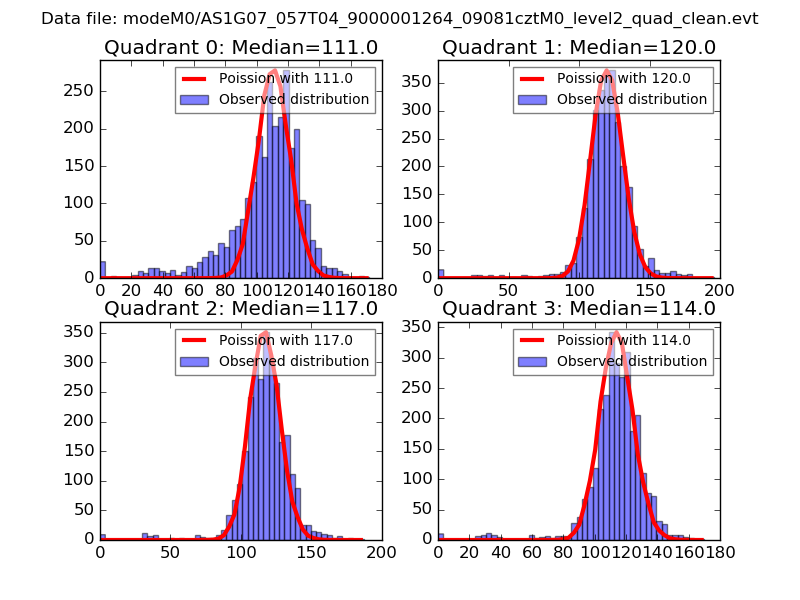 |
 |
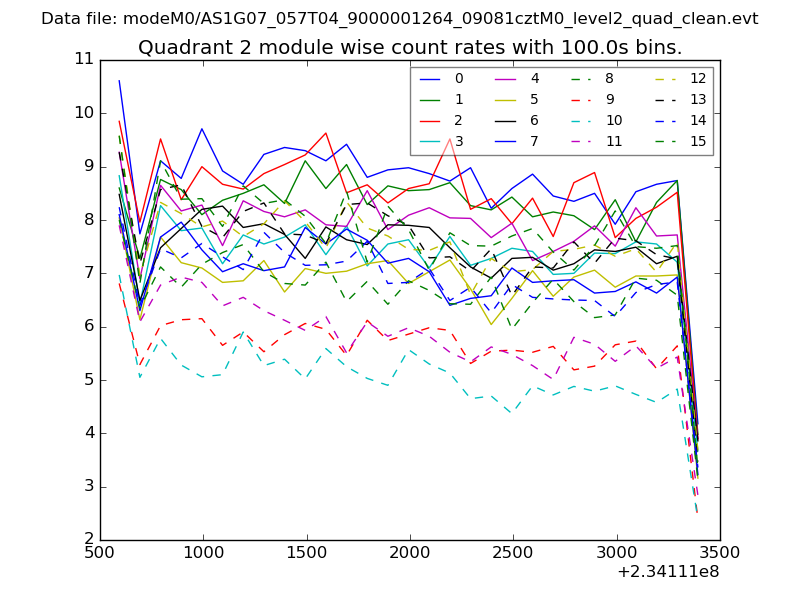
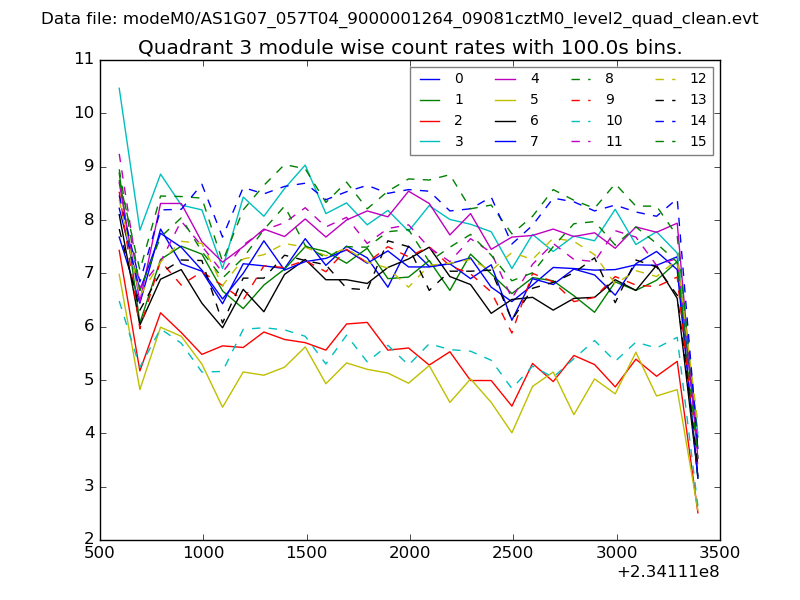
| Quadrant-wise count rates Data is divided into 100 sec bins |
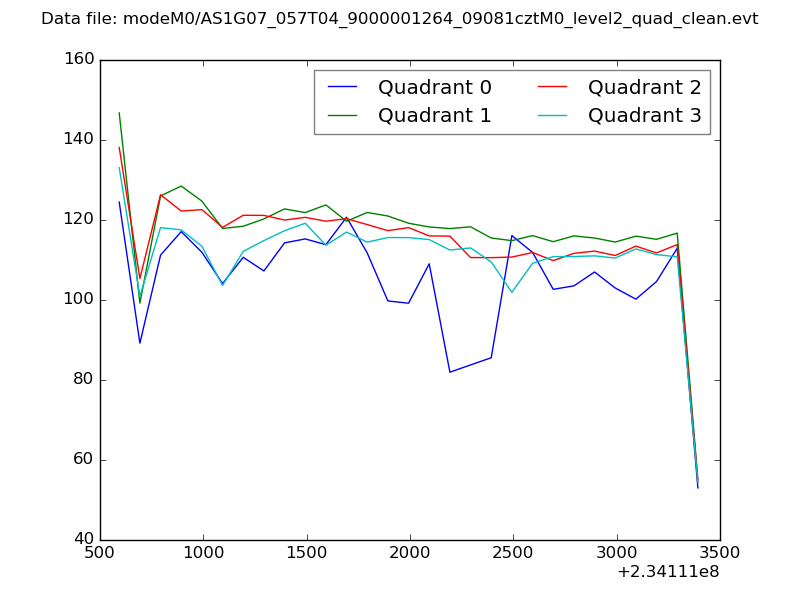 |
|
| Module-wise count rates for Quadrant A Data is divided into 100 sec bins |
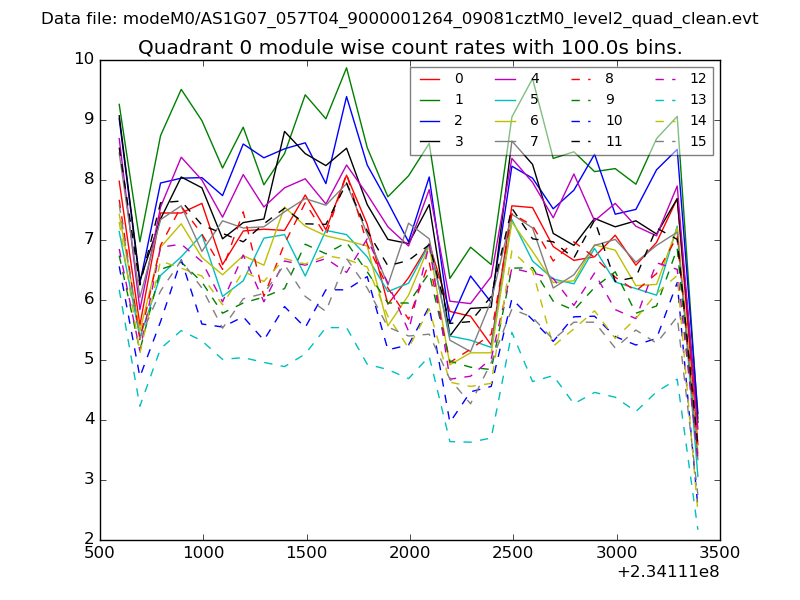 |
 |
| Module-wise count rates for Quadrant B Data is divided into 100 sec bins |
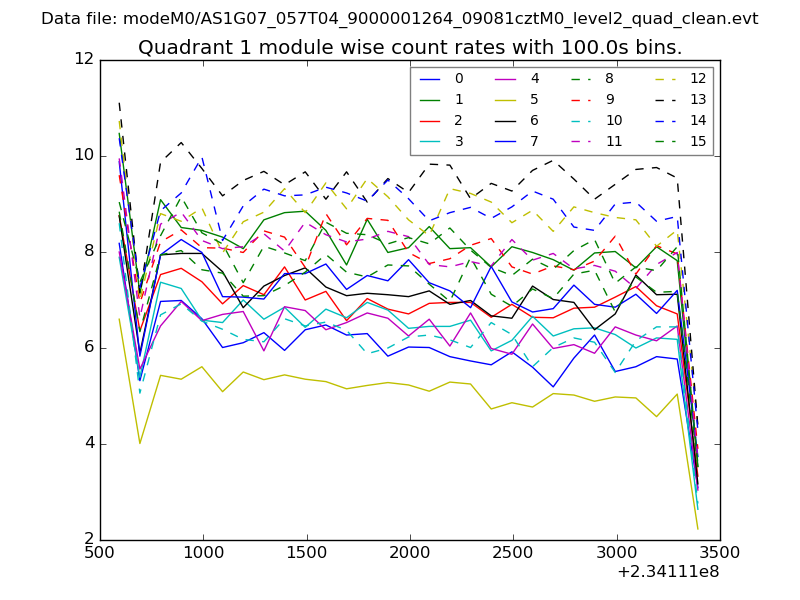 |
 |
| Module-wise count rates for Quadrant C Data is divided into 100 sec bins |
 |
 |
| Module-wise count rates for Quadrant D Data is divided into 100 sec bins |
 |
 |
| Parameter | Plot |
|---|---|
| CZT HV Monitor | 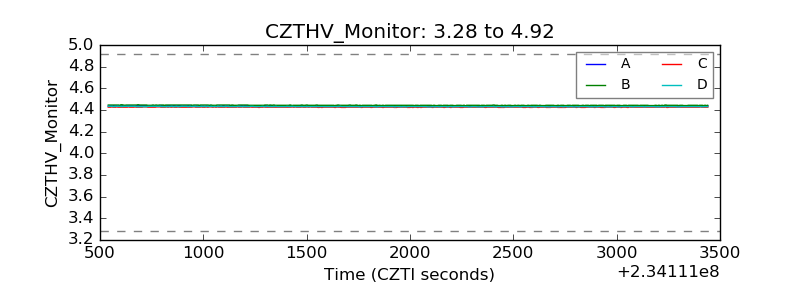 |
| D_VDD | 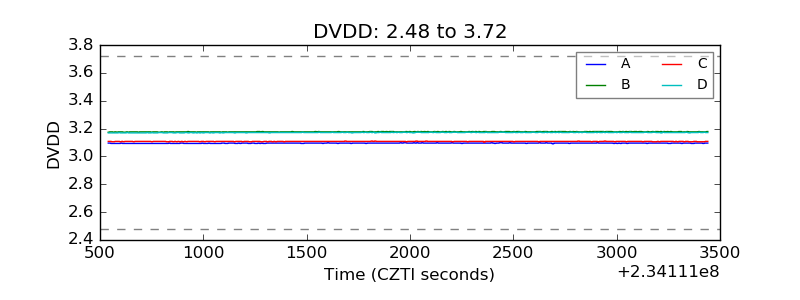 |
| Temperature 1 | 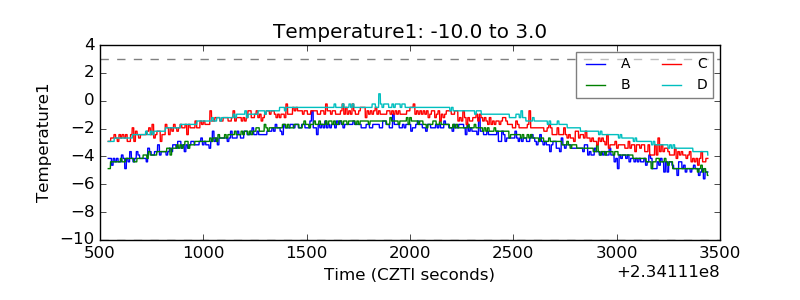 |
| Veto HV Monitor | 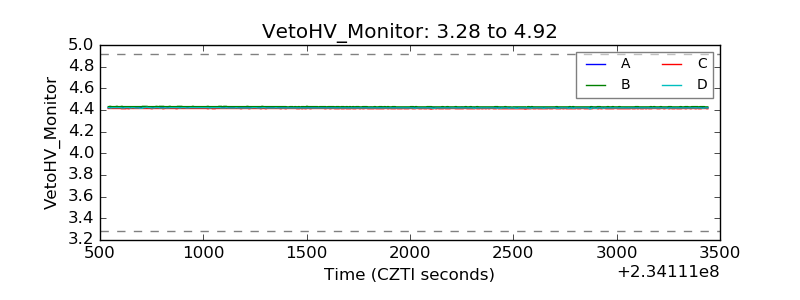 |
| Veto LLD |  |
| Alpha Counter | 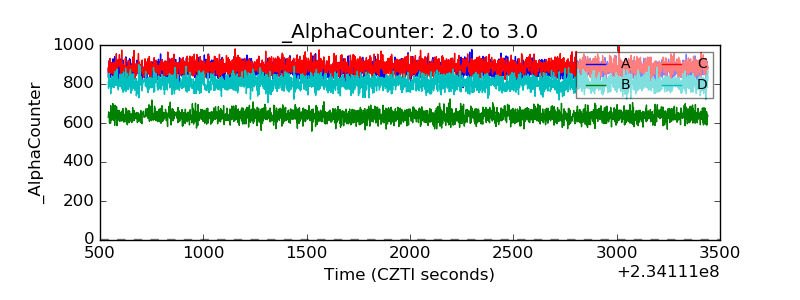 |
| _CPM_Rate | 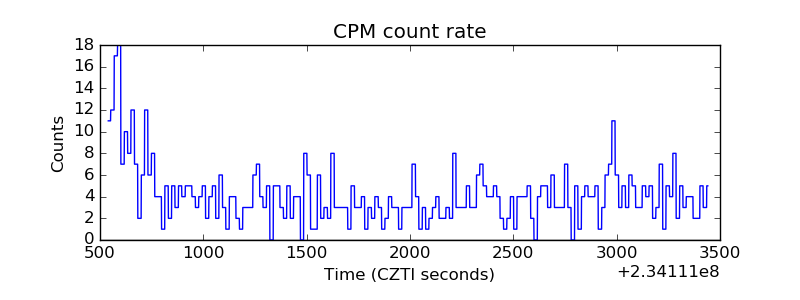 |
| CZT Counter | 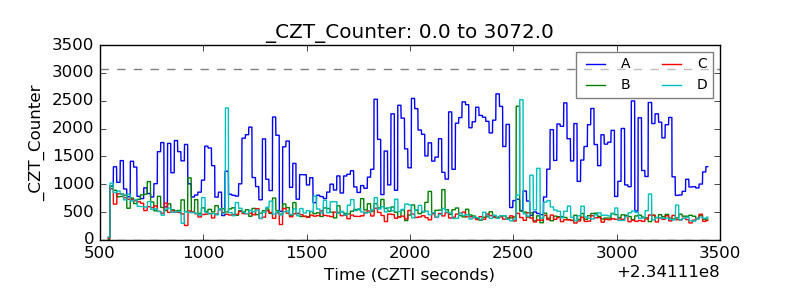 |
| +2.5 Volts monitor |  |
| +5 Volts monitor |  |
| _ROLL_ROT | 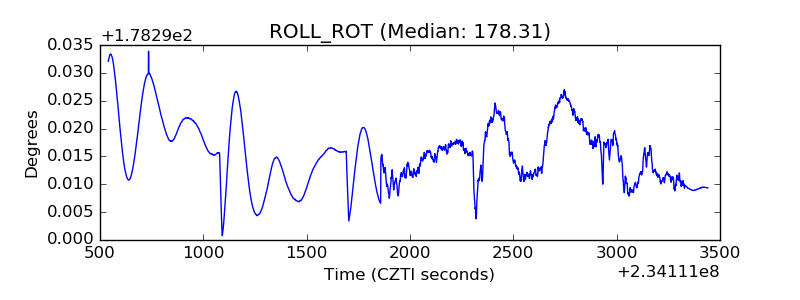 |
| _Roll_DEC | 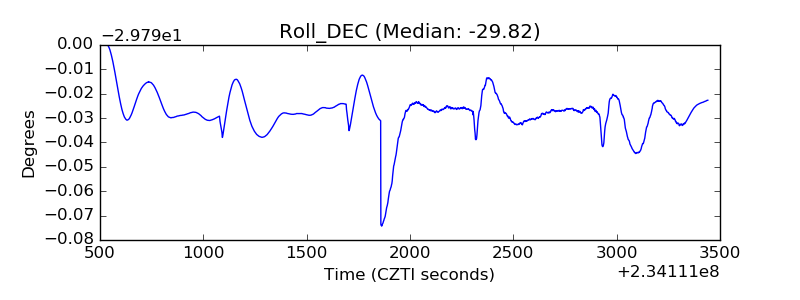 |
| _Roll_RA | 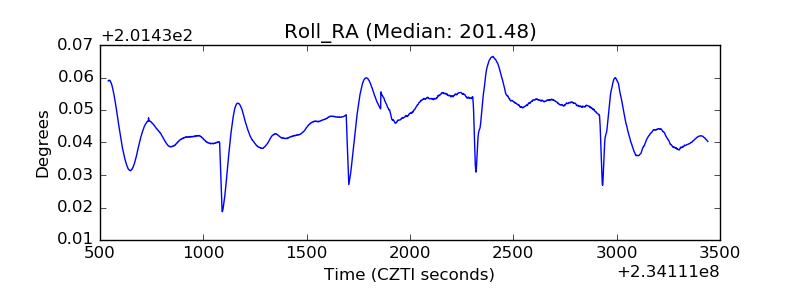 |
| Veto Counter | 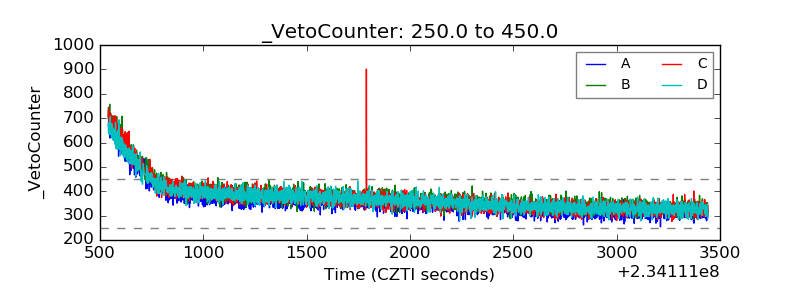 |