| Param | Original file | Final file |
|---|---|---|
| Filename | modeM0/AS1A03_105T01_9000001268_09106cztM0_level2.evt | modeM0/AS1A03_105T01_9000001268_09106cztM0_level2_quad_clean.evt |
| Size (bytes) | 136,111,680 | 18,861,120 |
| Size | 129.8 MB | 18.0 MB |
| Events in quadrant A | 1,000,740 | 109,549 |
| Events in quadrant B | 944,552 | 113,192 |
| Events in quadrant C | 880,202 | 112,189 |
| Events in quadrant D | 1,173,110 | 105,129 |
| Mode M0 | |||
|---|---|---|---|
| Quadrant | BADHDUFLAG | Total packets | Discarded packets |
| A | 0 | 4039 | 2 |
| B | 0 | 3880 | 1 |
| C | 0 | 3798 | 1 |
| D | 0 | 4641 | 1 |
| Mode SS | |||
|---|---|---|---|
| Quadrant | BADHDUFLAG | Total packets | Discarded packets |
| A | 0 | 38 | 0 |
| B | 0 | 38 | 0 |
| C | 0 | 38 | 0 |
| D | 0 | 38 | 0 |
| Mode M9 | |||
|---|---|---|---|
| Quadrant | BADHDUFLAG | Total packets | Discarded packets |
| A | 0 | 10 | 0 |
| B | 0 | 10 | 0 |
| C | 0 | 10 | 0 |
| D | 0 | 10 | 0 |
| Quadrant | Total seconds | Saturated seconds | Saturation percentage |
|---|---|---|---|
| A | 1780 | 80 | 4.494382% |
| B | 1780 | 86 | 4.831461% |
| C | 1780 | 35 | 1.966292% |
| D | 1780 | 105 | 5.898876% |
Noise dominated data is calculated using 1-second bins in cleaned event files. If a bin has >2000 counts, and if more than 50% of those come from <1% of pixels, then it is considered to be noise-dominated and hence unusable.
| Quadrant | # 1 sec bins | Bins with >0 counts | Bins with >2000 counts | High rate bins dominated by noise | Noise dominated (total time) | Noise dominated (detector-on time) | Marked lightcurve |
|---|---|---|---|---|---|---|---|
| A | 2770 | 1780 | 0 | 0 | 0.00% | 0.00% | 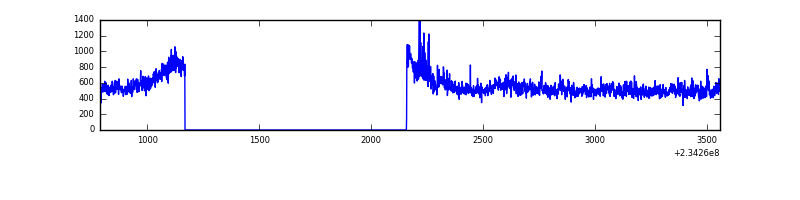 |
| B | 2770 | 1780 | 2 | 2 | 0.07% | 0.11% | 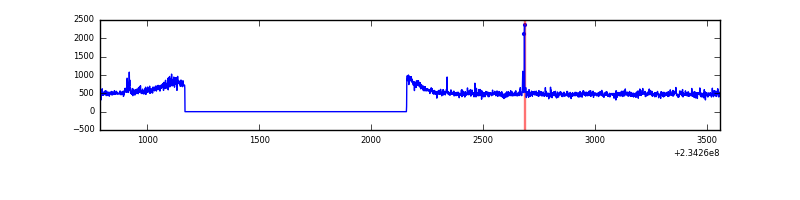 |
| C | 2770 | 1780 | 1 | 1 | 0.04% | 0.06% |  |
| D | 2770 | 1780 | 49 | 49 | 1.77% | 2.75% | 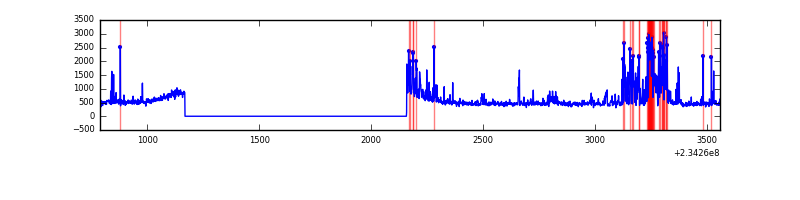 |
Top three noisy pixels from each quadrant. If the there are fewer than three noisy pixels in the level2.evt file, extra rows are filled as -1
| Pixel properties | Quadrant properties | ||||||
|---|---|---|---|---|---|---|---|
| Quadrant | DetID | PixID | Counts | Sigma | Mean | Median | Sigma |
| A | 8 | 5 | 60005 | 1199.1 | 234 | 229 | 49.9 |
| A | 1 | 162 | 17245 | 341.34 | 234 | 229 | 49.9 |
| A | 15 | 174 | 12560 | 247.36 | 234 | 229 | 49.9 |
| B | 0 | 214 | 20364 | 420.96 | 233 | 228 | 47.8 |
| B | 0 | 229 | 14313 | 294.46 | 233 | 228 | 47.8 |
| B | 12 | 111 | 5203 | 104.01 | 233 | 228 | 47.8 |
| C | 12 | 4 | 7121 | 128.3 | 223 | 224 | 53.8 |
| C | 13 | 61 | 1715 | 27.74 | 223 | 224 | 53.8 |
| C | 3 | 202 | 545 | 5.97 | 223 | 224 | 53.8 |
| D | 12 | 233 | 223158 | 3949.29 | 223 | 216 | 56.5 |
| D | 13 | 104 | 49461 | 872.35 | 223 | 216 | 56.5 |
| D | 1 | 52 | 29888 | 525.62 | 223 | 216 | 56.5 |
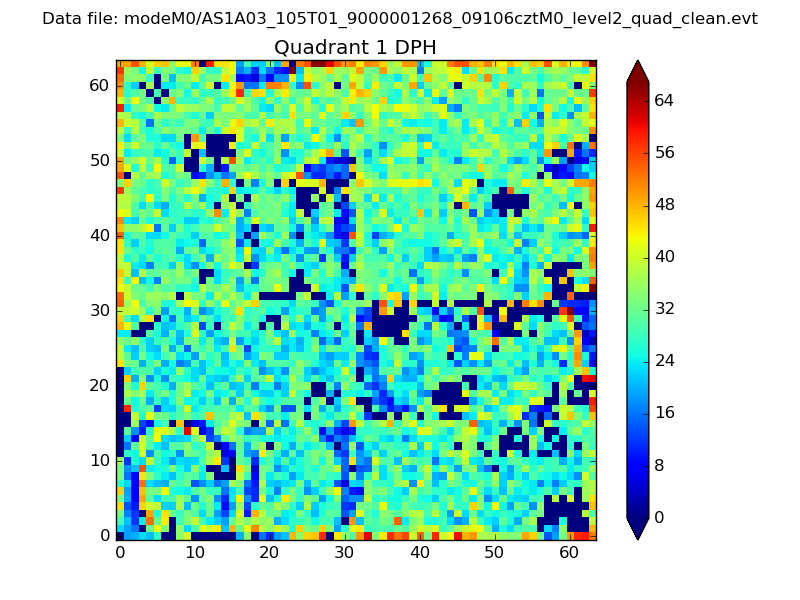
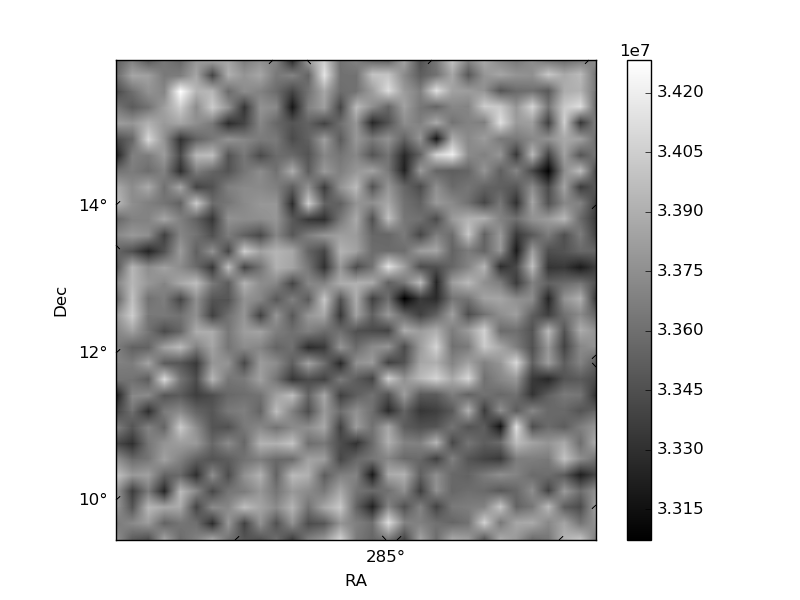
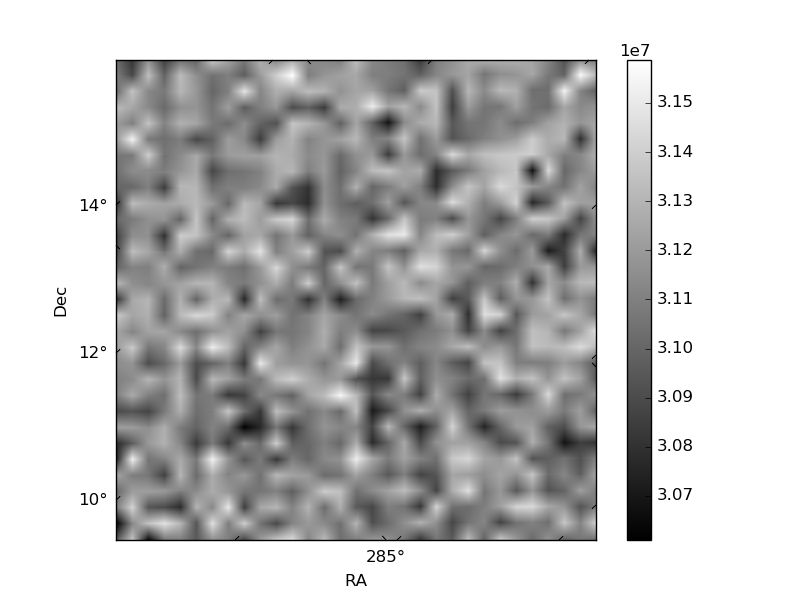
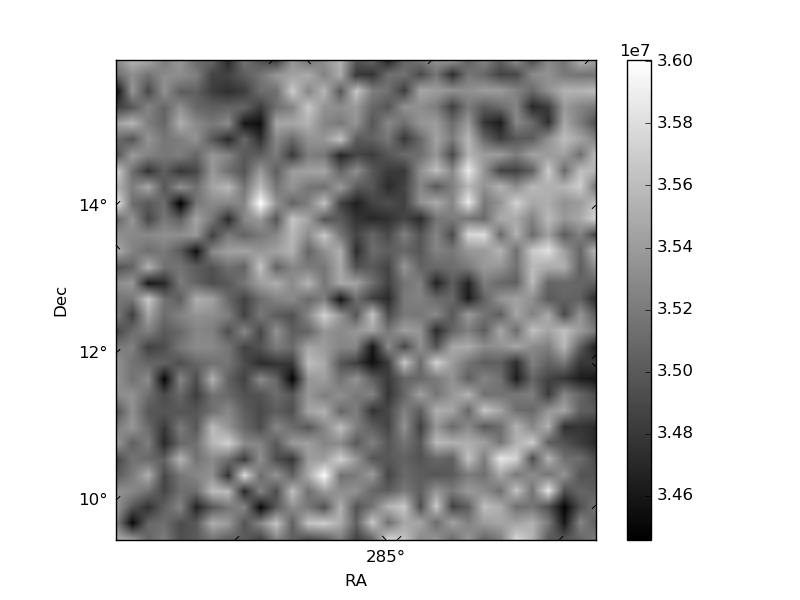
Histogram calculated using DETX and DETY for each event in the final _common_clean file
| Quadrant A |  |
 |
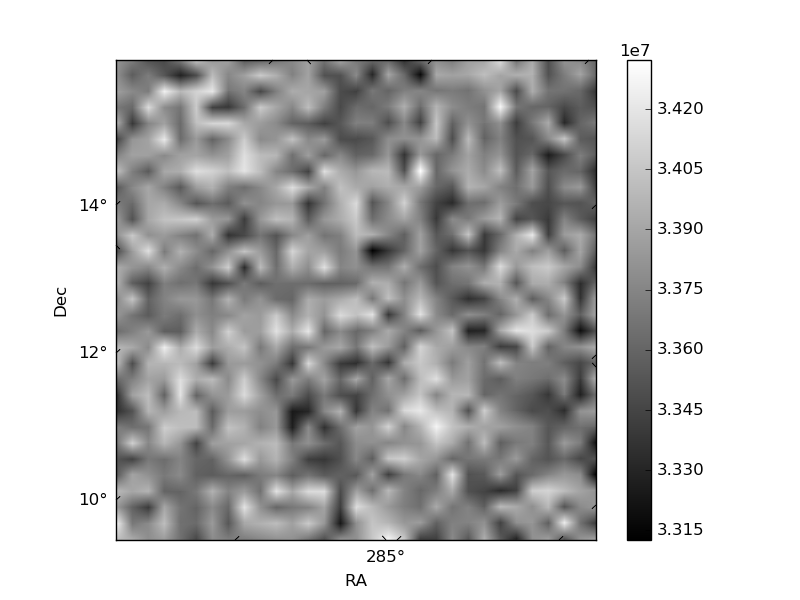
Quadrant B |
|---|---|---|---|
| Quadrant D |  |
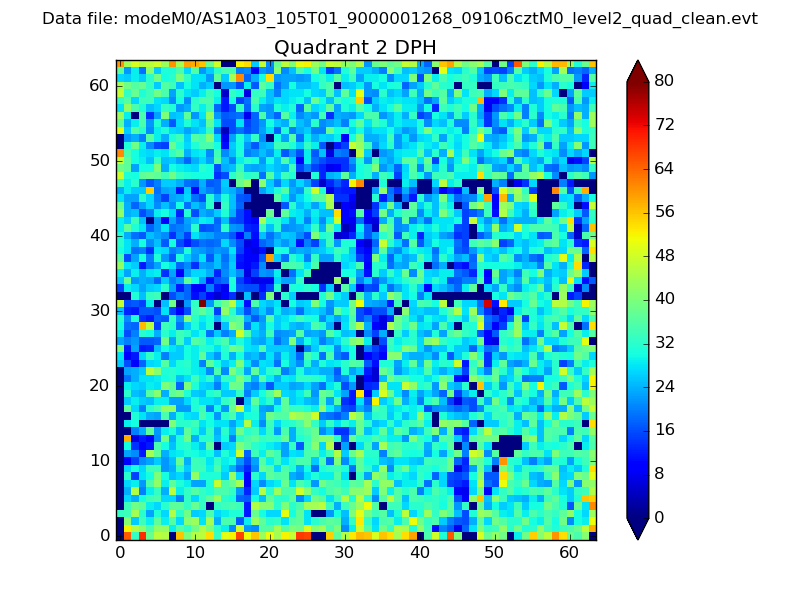 |
Quadrant C |
| Plot type | Count rate plots | Images |
|---|---|---|
| Comparison with Poisson distribution Blue bars denote a histogram of data divided into 1 sec bins. Red curve is a Poisson curve with rate = median count rate of data. |
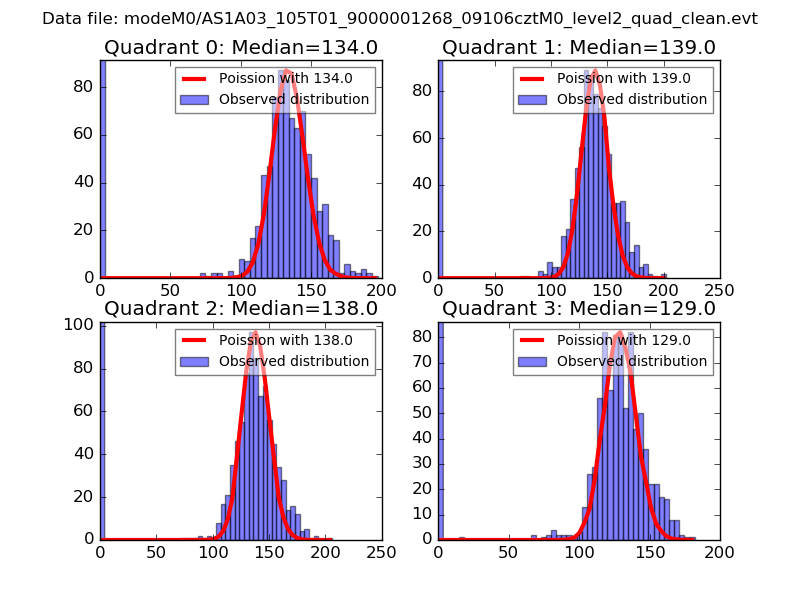 |
 |
| Quadrant-wise count rates Data is divided into 100 sec bins |
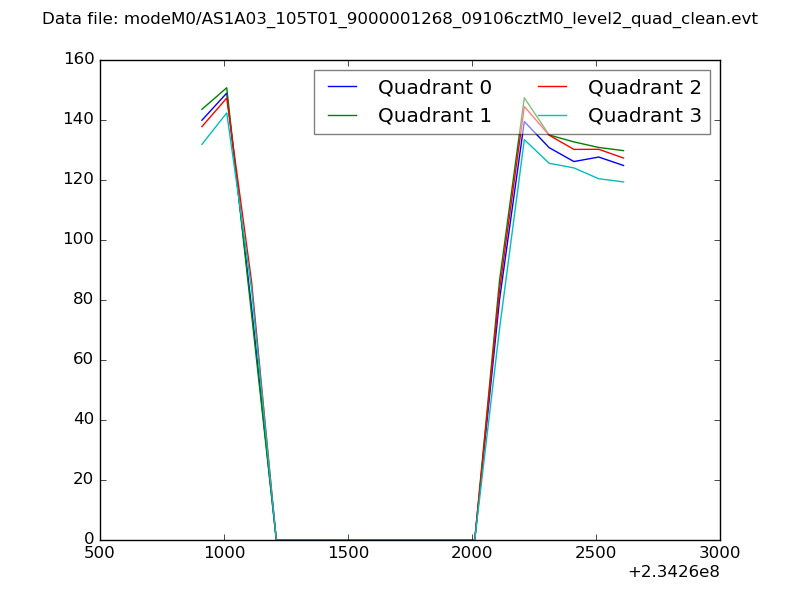 |
|
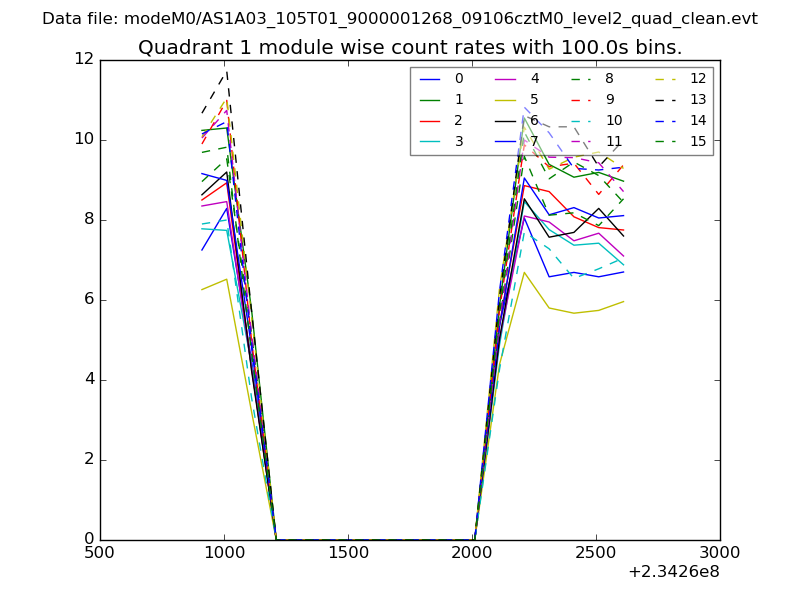
| Module-wise count rates for Quadrant A Data is divided into 100 sec bins |
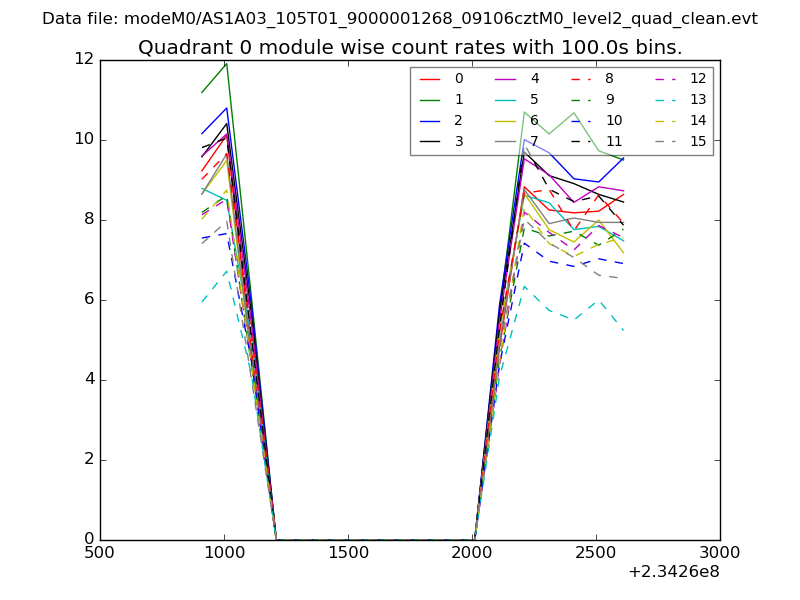 |
 |
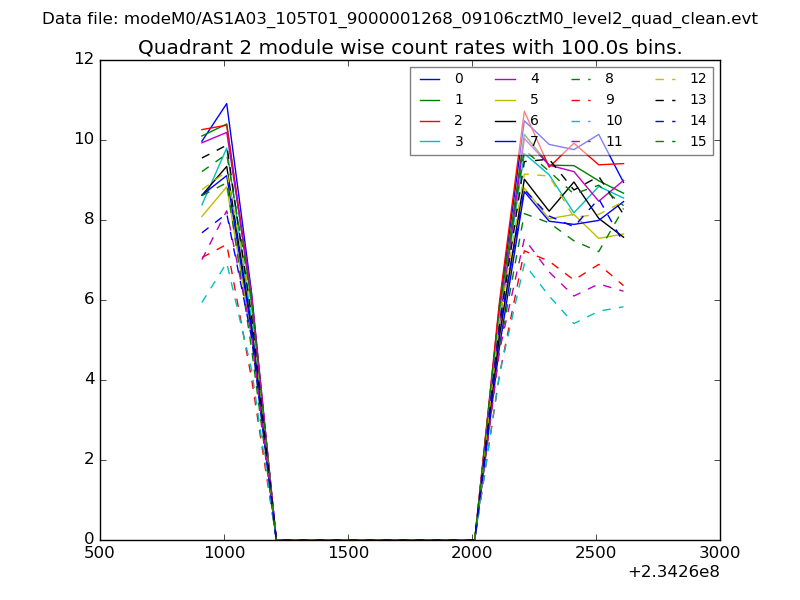
| Module-wise count rates for Quadrant B Data is divided into 100 sec bins |
 |
 |
| Module-wise count rates for Quadrant C Data is divided into 100 sec bins |
 |
 |
| Module-wise count rates for Quadrant D Data is divided into 100 sec bins |
 |
 |
| Parameter | Plot |
|---|---|
| CZT HV Monitor | 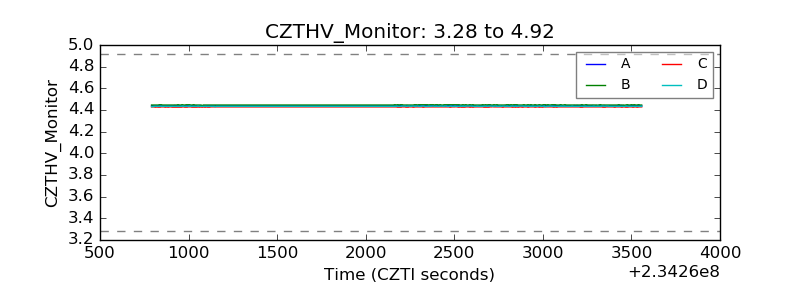 |
| D_VDD | 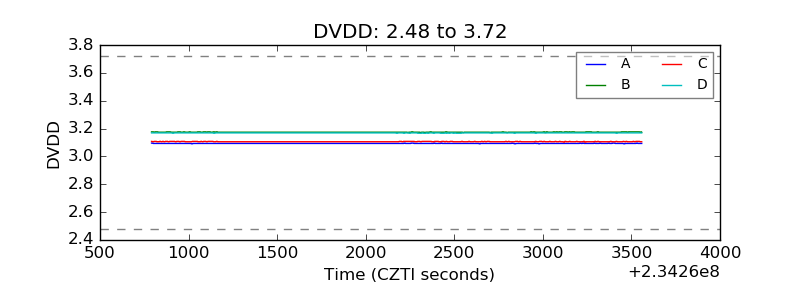 |
| Temperature 1 | 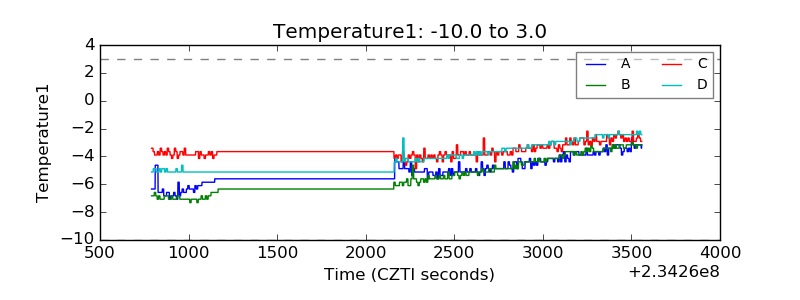 |
| Veto HV Monitor | 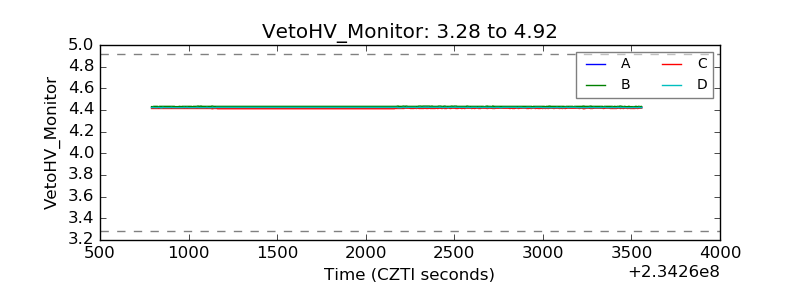 |
| Veto LLD | 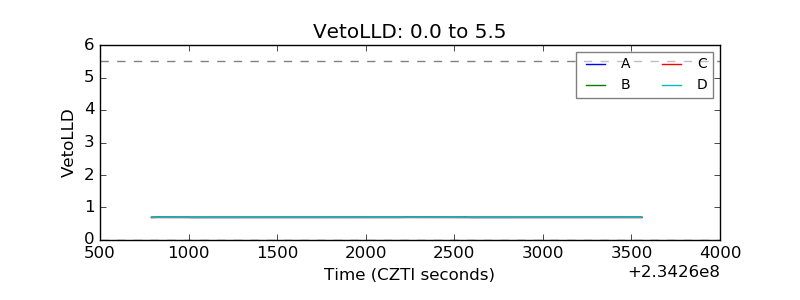 |
| Alpha Counter | 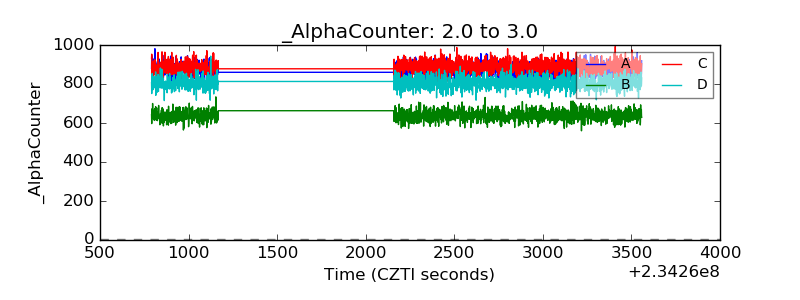 |
| _CPM_Rate | 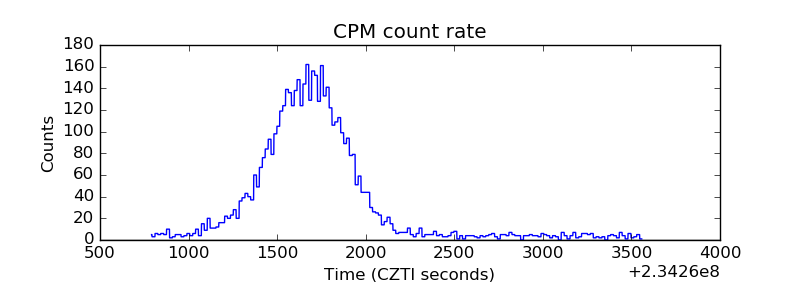 |
| CZT Counter | 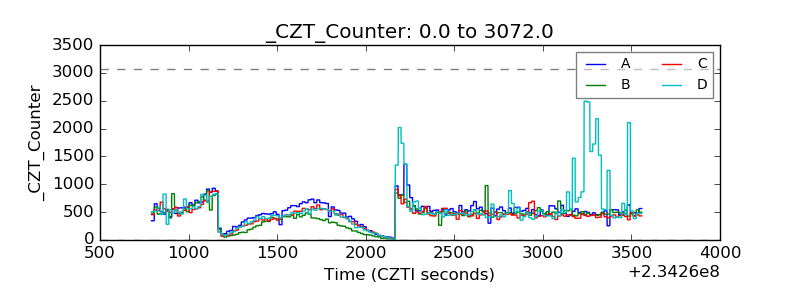 |
| +2.5 Volts monitor |  |
| +5 Volts monitor |  |
| _ROLL_ROT | 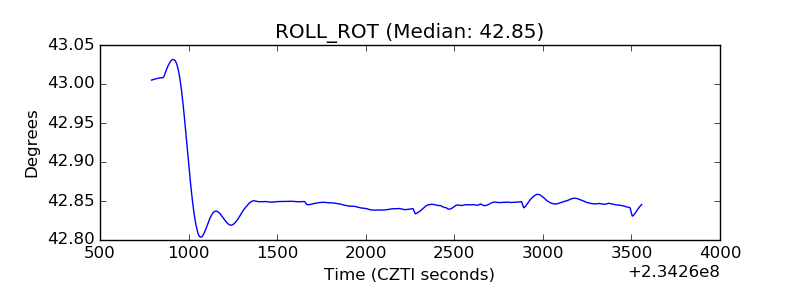 |
| _Roll_DEC | 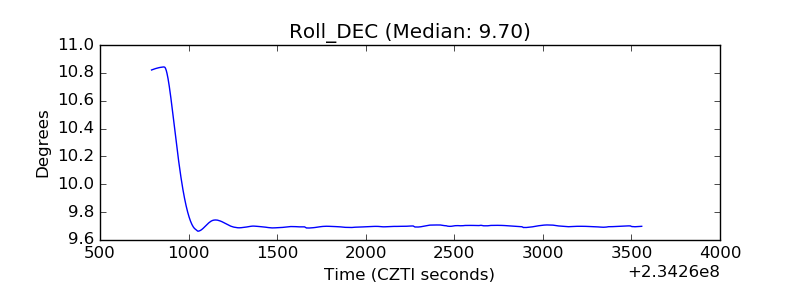 |
| _Roll_RA |  |
| Veto Counter | 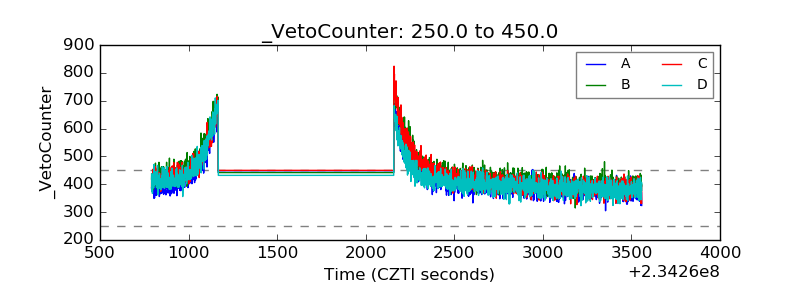 |