| Param | Original file | Final file |
|---|---|---|
| Filename | modeM0/AS1A03_105T01_9000001268_09107cztM0_level2.evt | modeM0/AS1A03_105T01_9000001268_09107cztM0_level2_quad_clean.evt |
| Size (bytes) | 493,729,920 | 77,244,480 |
| Size | 470.9 MB | 73.7 MB |
| Events in quadrant A | 3,763,785 | 466,697 |
| Events in quadrant B | 3,484,570 | 471,819 |
| Events in quadrant C | 3,313,511 | 460,326 |
| Events in quadrant D | 3,907,579 | 444,783 |
| Mode M0 | |||
|---|---|---|---|
| Quadrant | BADHDUFLAG | Total packets | Discarded packets |
| A | 0 | 15370 | 3 |
| B | 0 | 14801 | 4 |
| C | 0 | 14778 | 2 |
| D | 0 | 16391 | 7 |
| Mode SS | |||
|---|---|---|---|
| Quadrant | BADHDUFLAG | Total packets | Discarded packets |
| A | 0 | 146 | 0 |
| B | 0 | 146 | 0 |
| C | 0 | 146 | 0 |
| D | 0 | 146 | 0 |
| Mode M9 | |||
|---|---|---|---|
| Quadrant | BADHDUFLAG | Total packets | Discarded packets |
| A | 0 | 9 | 0 |
| B | 0 | 9 | 0 |
| C | 0 | 9 | 0 |
| D | 0 | 10 | 0 |
| Quadrant | Total seconds | Saturated seconds | Saturation percentage |
|---|---|---|---|
| A | 7106 | 145 | 2.040529% |
| B | 7105 | 140 | 1.970443% |
| C | 7106 | 97 | 1.365044% |
| D | 7104 | 174 | 2.449324% |
Noise dominated data is calculated using 1-second bins in cleaned event files. If a bin has >2000 counts, and if more than 50% of those come from <1% of pixels, then it is considered to be noise-dominated and hence unusable.
| Quadrant | # 1 sec bins | Bins with >0 counts | Bins with >2000 counts | High rate bins dominated by noise | Noise dominated (total time) | Noise dominated (detector-on time) | Marked lightcurve |
|---|---|---|---|---|---|---|---|
| A | 7661 | 7106 | 1 | 1 | 0.01% | 0.01% | 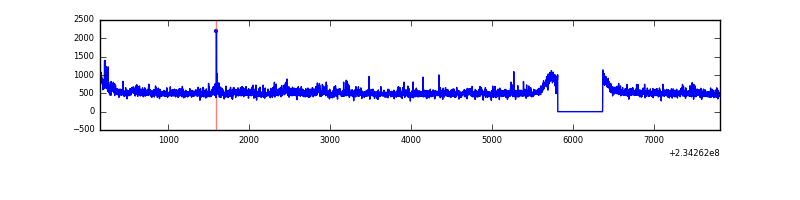 |
| B | 7661 | 7106 | 4 | 4 | 0.05% | 0.06% | 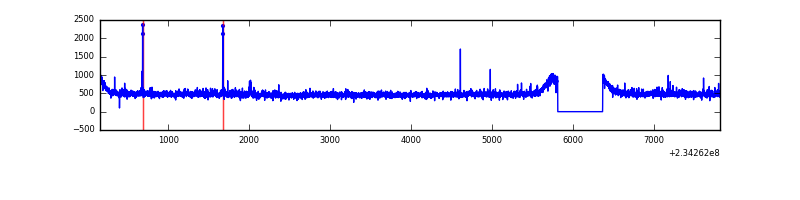 |
| C | 7661 | 7106 | 8 | 8 | 0.10% | 0.11% | 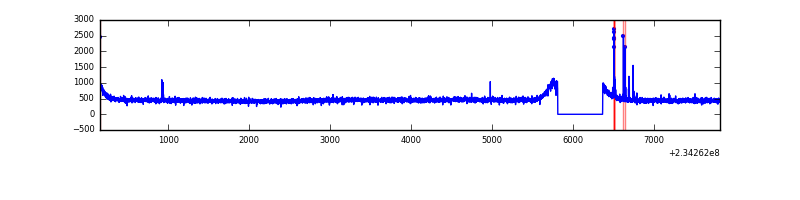 |
| D | 7661 | 7106 | 71 | 71 | 0.93% | 1.00% |  |
Top three noisy pixels from each quadrant. If the there are fewer than three noisy pixels in the level2.evt file, extra rows are filled as -1
| Pixel properties | Quadrant properties | ||||||
|---|---|---|---|---|---|---|---|
| Quadrant | DetID | PixID | Counts | Sigma | Mean | Median | Sigma |
| A | 8 | 5 | 274716 | 1521.38 | 875 | 856 | 180.0 |
| A | 1 | 162 | 69406 | 380.82 | 875 | 856 | 180.0 |
| A | 15 | 174 | 24243 | 129.92 | 875 | 856 | 180.0 |
| B | 0 | 214 | 55575 | 322.96 | 872 | 854 | 169.4 |
| B | 12 | 111 | 19257 | 108.61 | 872 | 854 | 169.4 |
| B | 0 | 229 | 17691 | 99.37 | 872 | 854 | 169.4 |
| C | 14 | 234 | 32702 | 162.42 | 839 | 845 | 196.1 |
| C | 12 | 4 | 8259 | 37.8 | 839 | 845 | 196.1 |
| C | 13 | 61 | 6278 | 27.7 | 839 | 845 | 196.1 |
| D | 12 | 233 | 340595 | 1542.94 | 835 | 816 | 220.2 |
| D | 1 | 52 | 256321 | 1160.25 | 835 | 816 | 220.2 |
| D | 13 | 104 | 64790 | 290.51 | 835 | 816 | 220.2 |
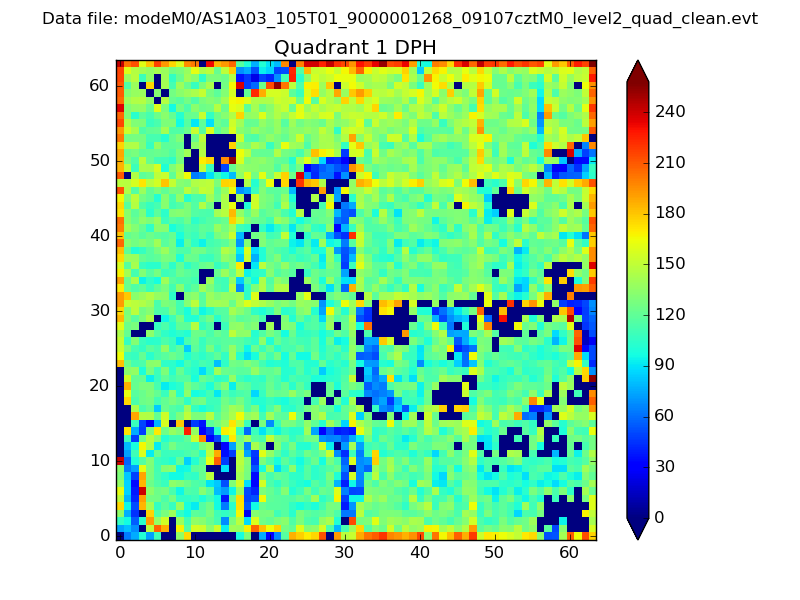
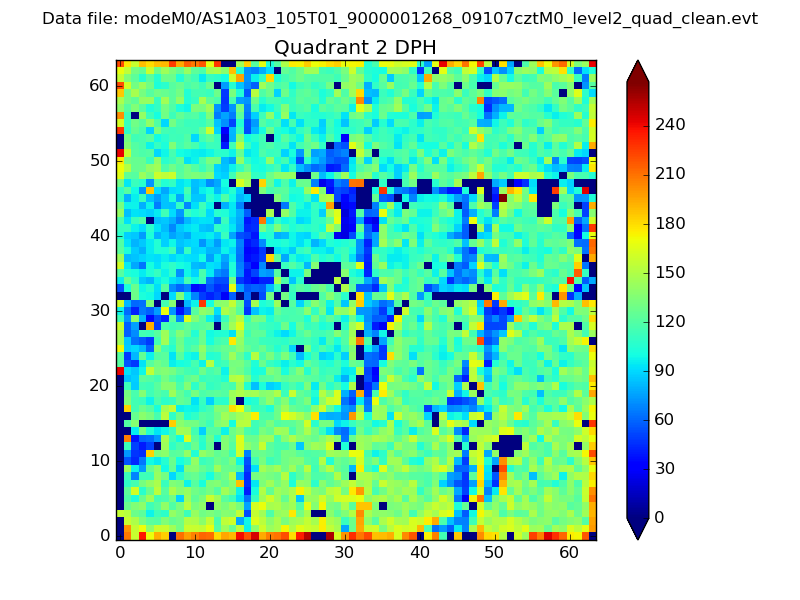
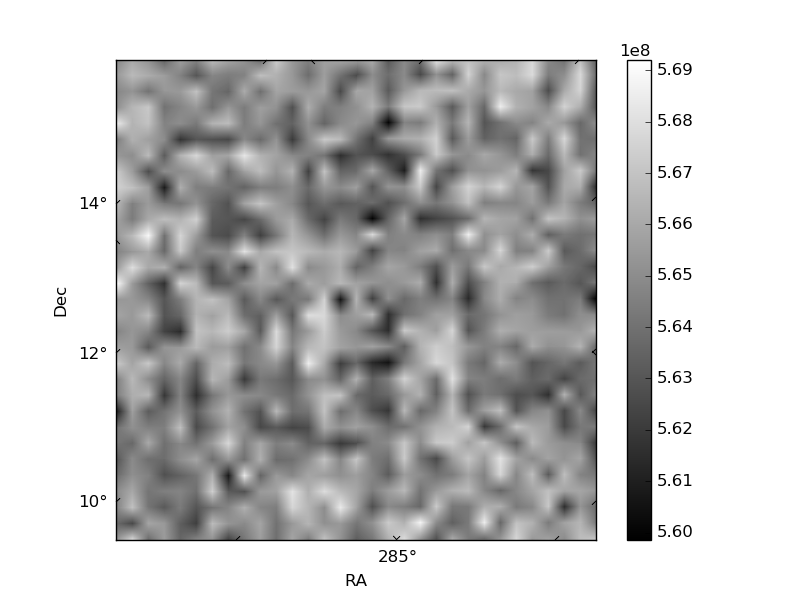
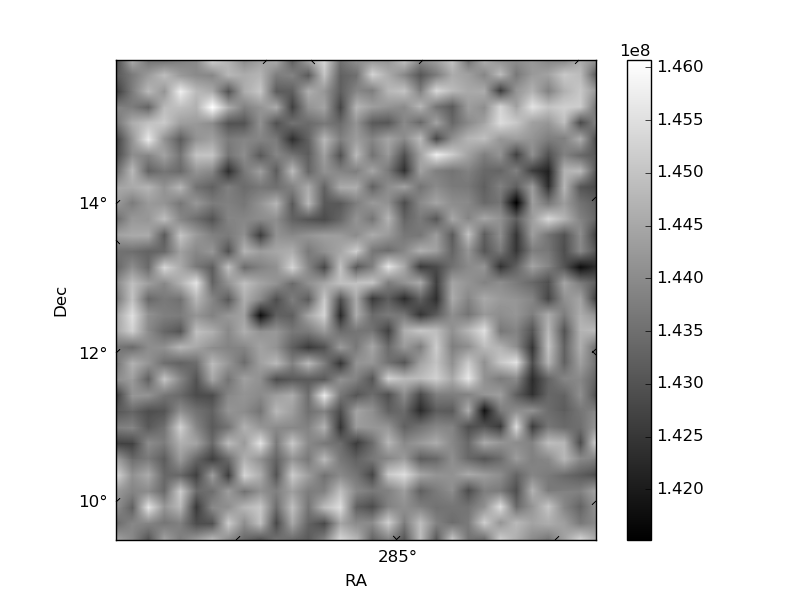
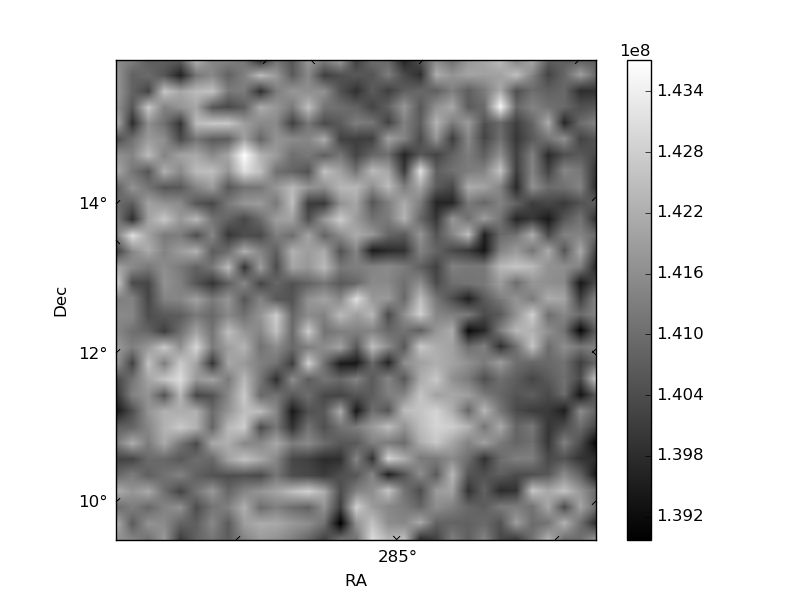
Histogram calculated using DETX and DETY for each event in the final _common_clean file
| Quadrant A | 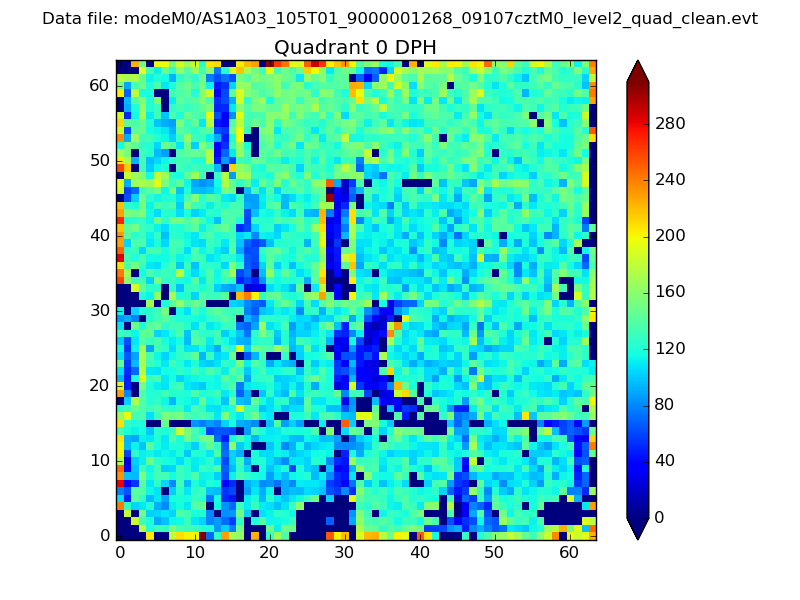 |
 |
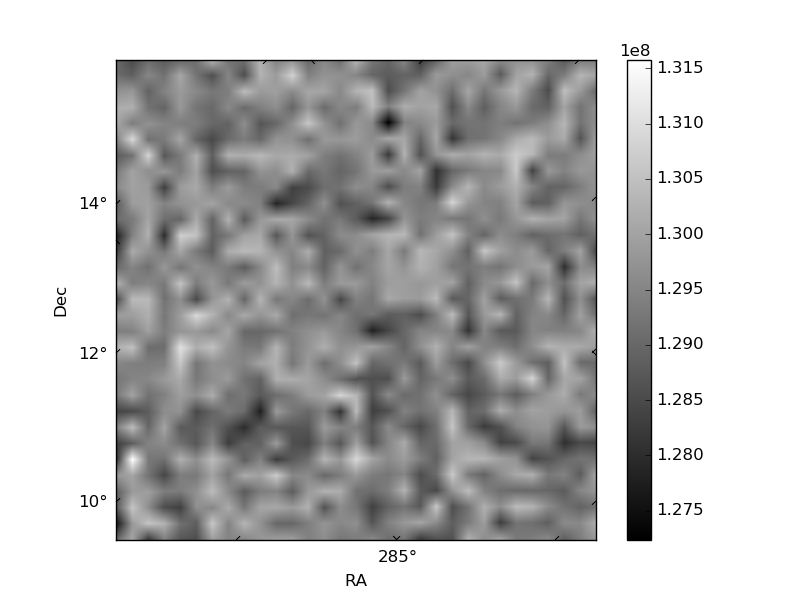
Quadrant B |
|---|---|---|---|
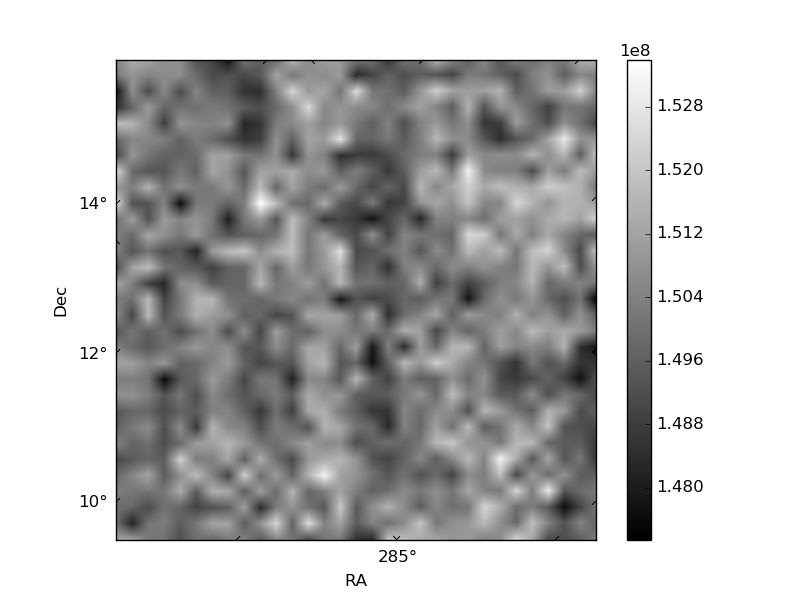
| Quadrant D | 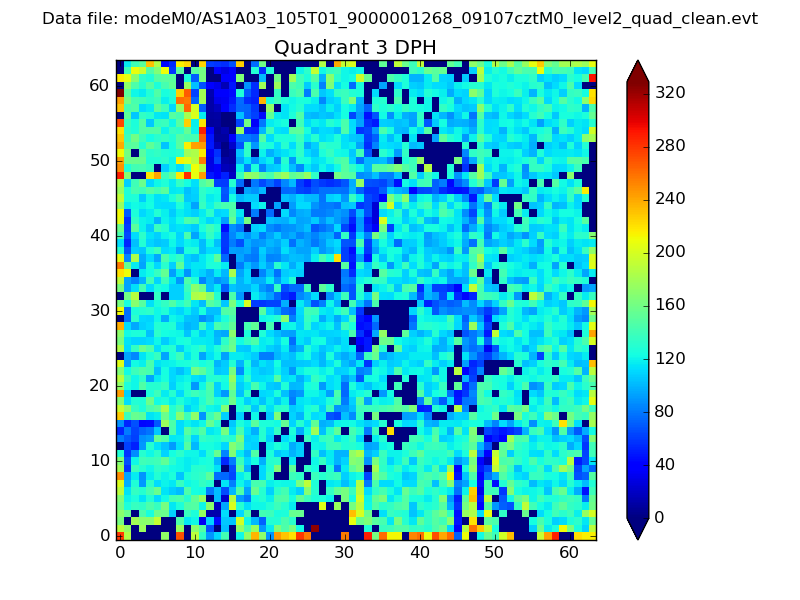 |
 |
Quadrant C |
| Plot type | Count rate plots | Images |
|---|---|---|
| Comparison with Poisson distribution Blue bars denote a histogram of data divided into 1 sec bins. Red curve is a Poisson curve with rate = median count rate of data. |
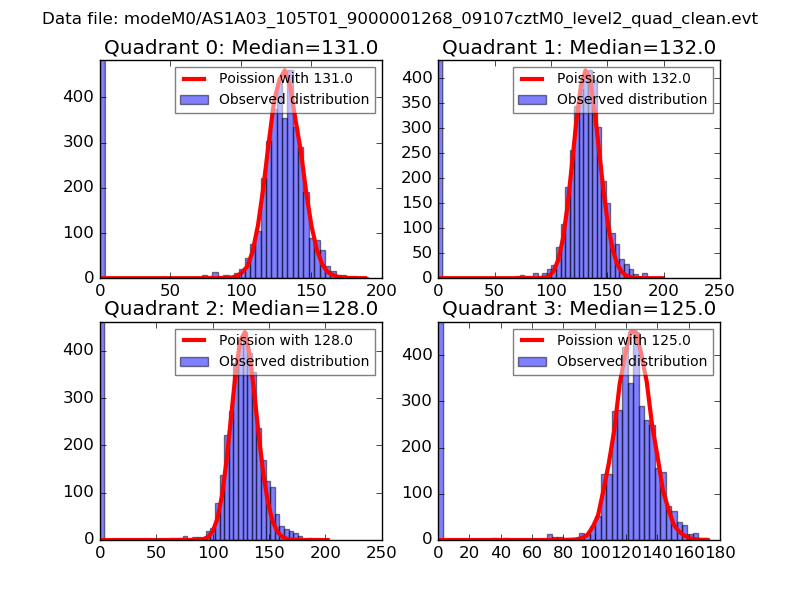 |
 |
| Quadrant-wise count rates Data is divided into 100 sec bins |
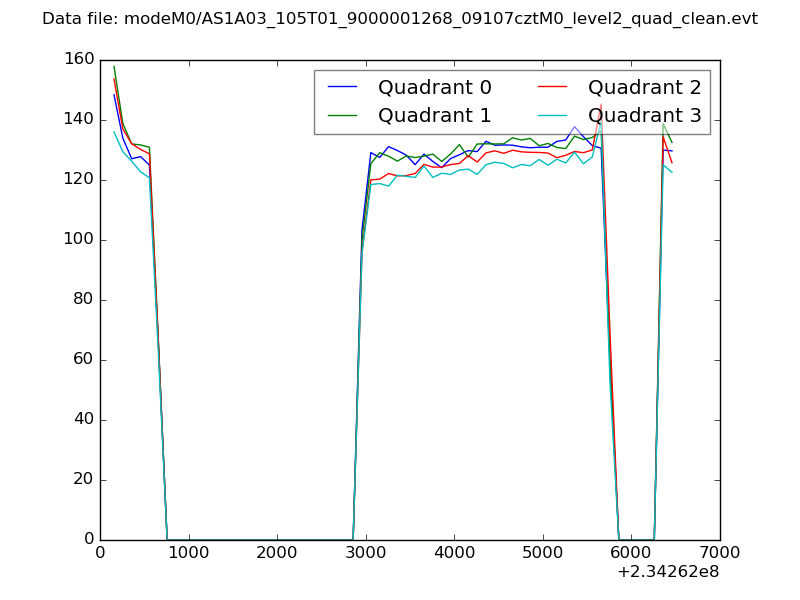 |
|
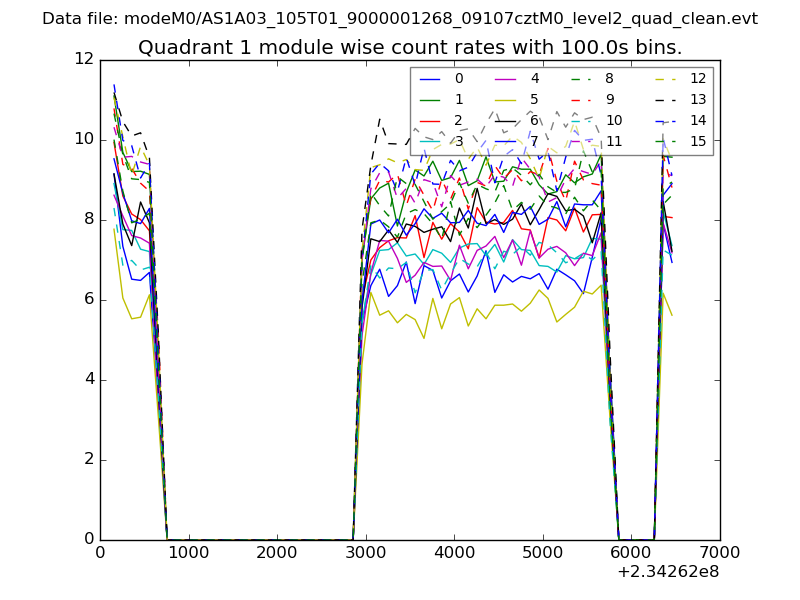
| Module-wise count rates for Quadrant A Data is divided into 100 sec bins |
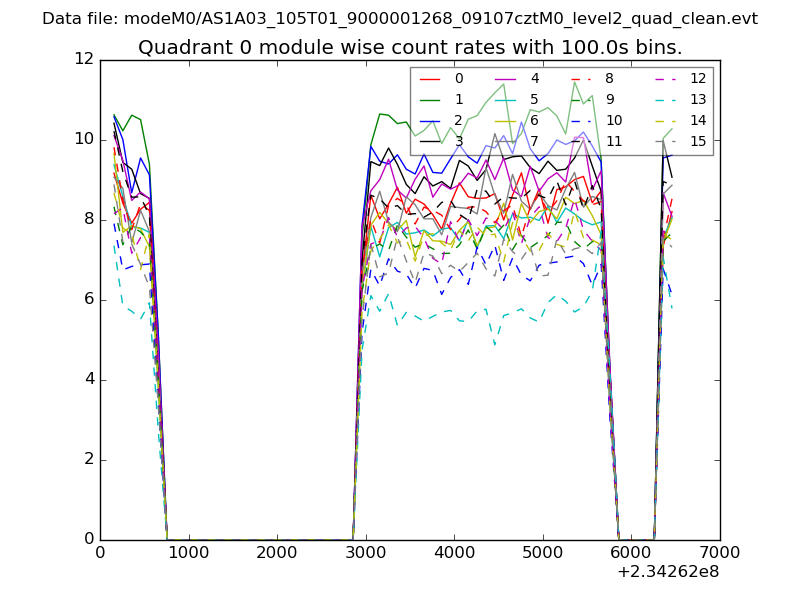 |
 |
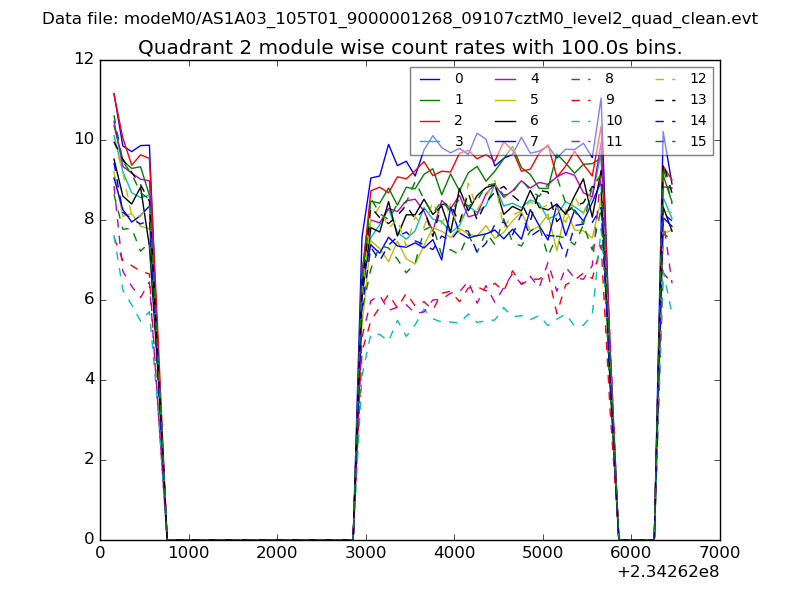
| Module-wise count rates for Quadrant B Data is divided into 100 sec bins |
 |
 |
| Module-wise count rates for Quadrant C Data is divided into 100 sec bins |
 |
 |
| Module-wise count rates for Quadrant D Data is divided into 100 sec bins |
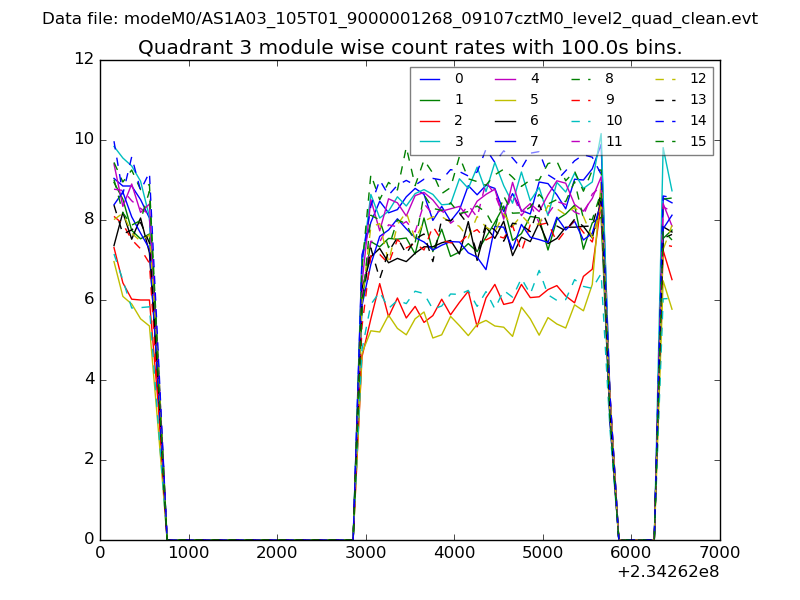 |
 |
| Parameter | Plot |
|---|---|
| CZT HV Monitor | 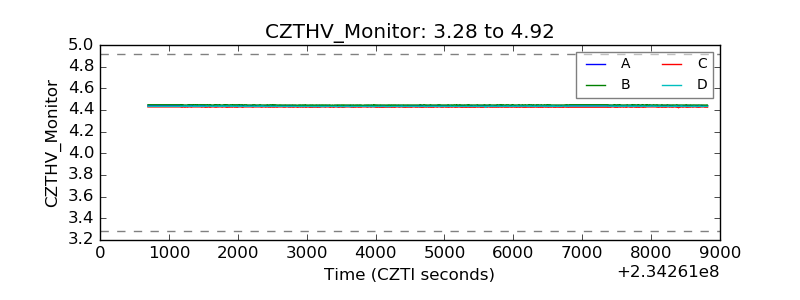 |
| D_VDD | 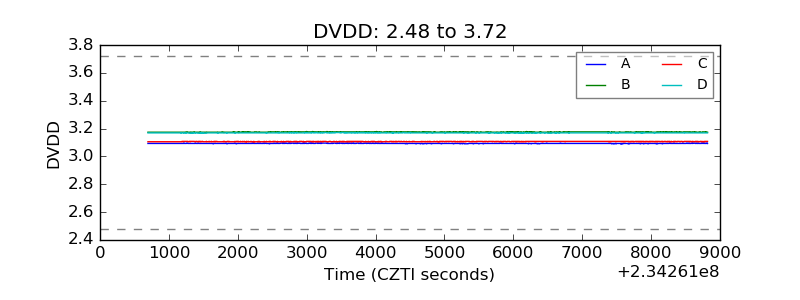 |
| Temperature 1 | 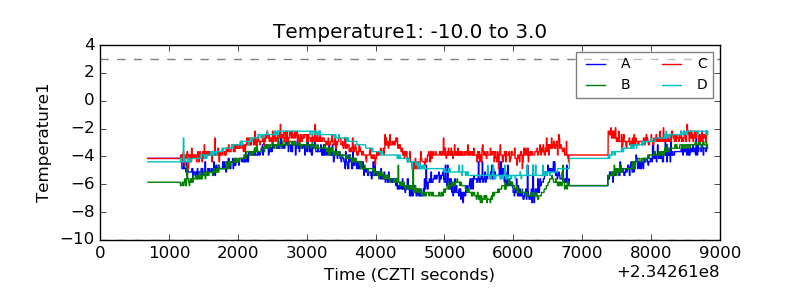 |
| Veto HV Monitor | 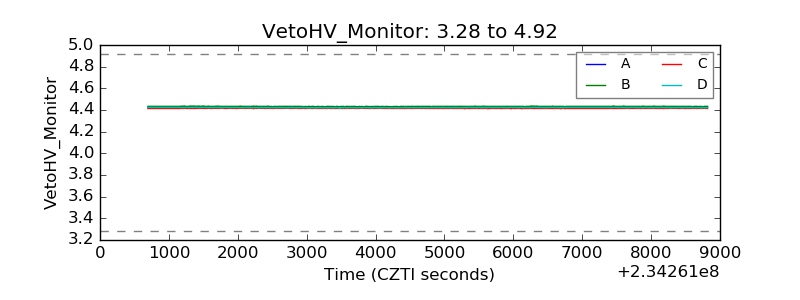 |
| Veto LLD | 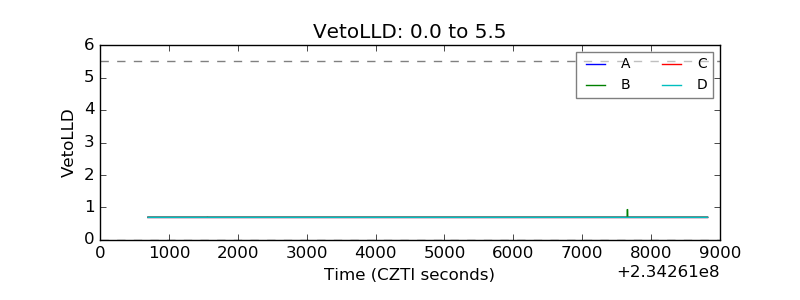 |
| Alpha Counter | 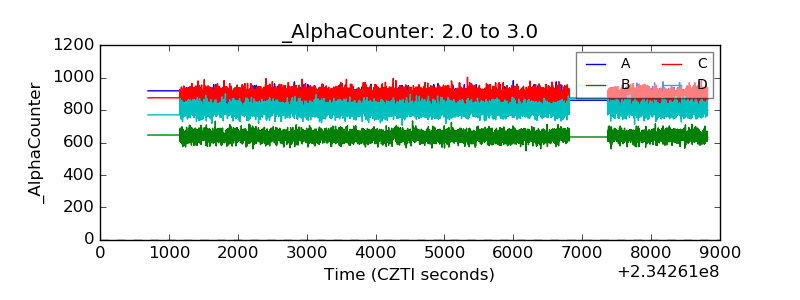 |
| _CPM_Rate | 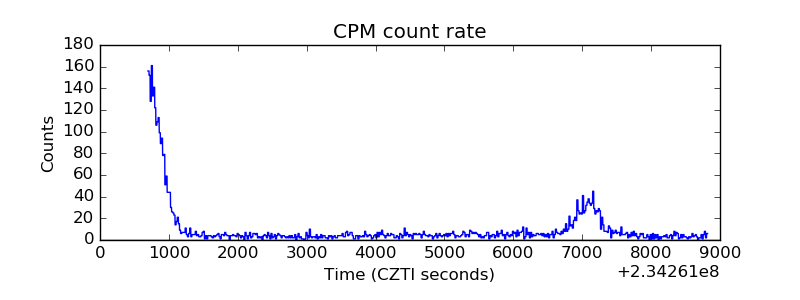 |
| CZT Counter | 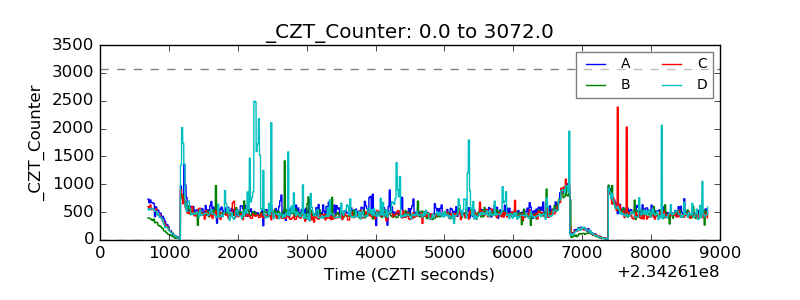 |
| +2.5 Volts monitor |  |
| +5 Volts monitor |  |
| _ROLL_ROT | 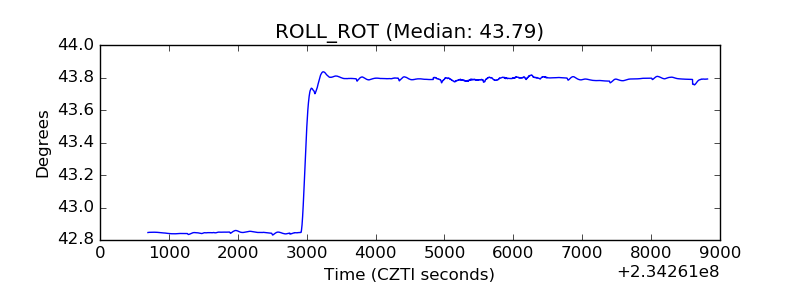 |
| _Roll_DEC | 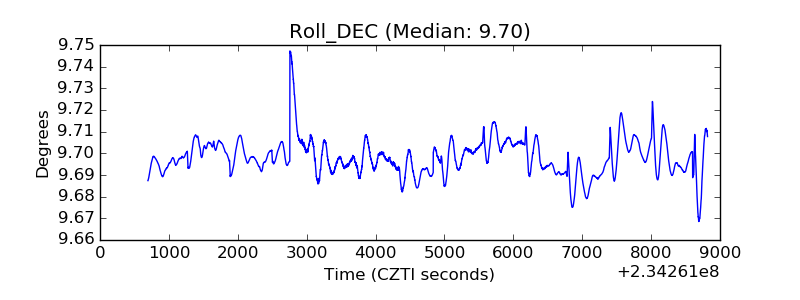 |
| _Roll_RA | 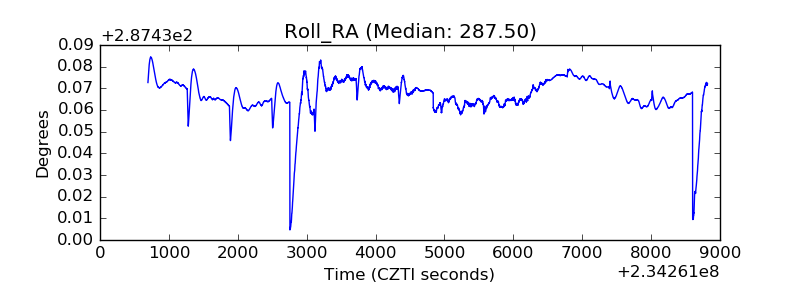 |
| Veto Counter | 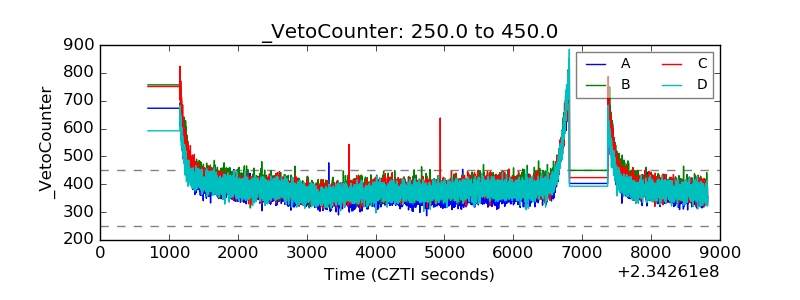 |