| Param | Original file | Final file |
|---|---|---|
| Filename | modeM0/AS1A03_105T01_9000001268_09108cztM0_level2.evt | modeM0/AS1A03_105T01_9000001268_09108cztM0_level2_quad_clean.evt |
| Size (bytes) | 567,722,880 | 88,551,360 |
| Size | 541.4 MB | 84.4 MB |
| Events in quadrant A | 4,311,664 | 536,976 |
| Events in quadrant B | 4,106,067 | 539,200 |
| Events in quadrant C | 3,875,131 | 530,116 |
| Events in quadrant D | 4,354,285 | 515,672 |
| Mode M0 | |||
|---|---|---|---|
| Quadrant | BADHDUFLAG | Total packets | Discarded packets |
| A | 0 | 17726 | 66 |
| B | 0 | 17377 | 56 |
| C | 0 | 17219 | 47 |
| D | 0 | 18406 | 48 |
| Mode SS | |||
|---|---|---|---|
| Quadrant | BADHDUFLAG | Total packets | Discarded packets |
| A | 0 | 166 | 0 |
| B | 0 | 166 | 0 |
| C | 0 | 166 | 0 |
| D | 0 | 166 | 2 |
| Mode M9 | |||
|---|---|---|---|
| Quadrant | BADHDUFLAG | Total packets | Discarded packets |
| A | 0 | 5 | 0 |
| B | 0 | 5 | 0 |
| C | 0 | 5 | 0 |
| D | 0 | 5 | 0 |
| Quadrant | Total seconds | Saturated seconds | Saturation percentage |
|---|---|---|---|
| A | 8034 | 356 | 4.431168% |
| B | 8036 | 369 | 4.591837% |
| C | 8039 | 290 | 3.607414% |
| D | 8037 | 336 | 4.180664% |
Noise dominated data is calculated using 1-second bins in cleaned event files. If a bin has >2000 counts, and if more than 50% of those come from <1% of pixels, then it is considered to be noise-dominated and hence unusable.
| Quadrant | # 1 sec bins | Bins with >0 counts | Bins with >2000 counts | High rate bins dominated by noise | Noise dominated (total time) | Noise dominated (detector-on time) | Marked lightcurve |
|---|---|---|---|---|---|---|---|
| A | 8692 | 8056 | 3 | 3 | 0.03% | 0.04% | 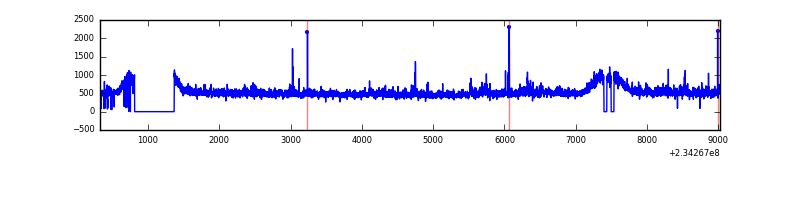 |
| B | 8692 | 8052 | 4 | 4 | 0.05% | 0.05% | 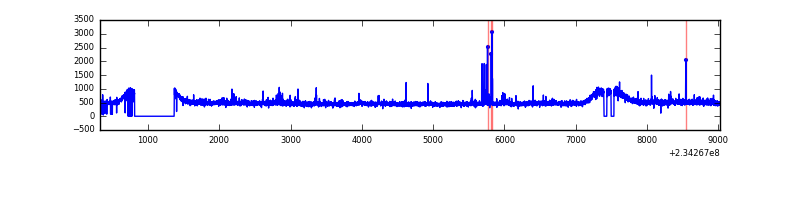 |
| C | 8692 | 8058 | 7 | 7 | 0.08% | 0.09% | 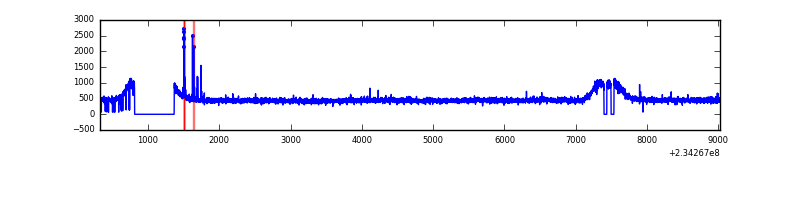 |
| D | 8692 | 8054 | 39 | 39 | 0.45% | 0.48% | 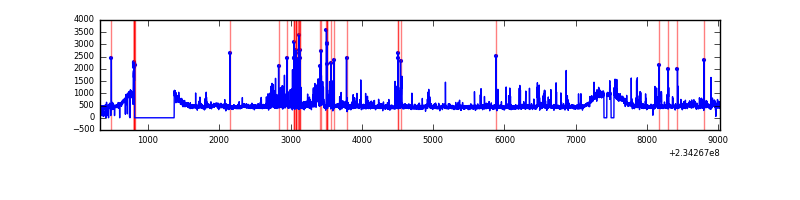 |
Top three noisy pixels from each quadrant. If the there are fewer than three noisy pixels in the level2.evt file, extra rows are filled as -1
| Pixel properties | Quadrant properties | ||||||
|---|---|---|---|---|---|---|---|
| Quadrant | DetID | PixID | Counts | Sigma | Mean | Median | Sigma |
| A | 8 | 5 | 251664 | 1205.81 | 1015 | 990 | 207.9 |
| A | 1 | 162 | 87266 | 415.01 | 1015 | 990 | 207.9 |
| A | 15 | 174 | 30077 | 139.92 | 1015 | 990 | 207.9 |
| B | 4 | 173 | 69374 | 344.19 | 1013 | 986 | 198.7 |
| B | 0 | 214 | 62693 | 310.57 | 1013 | 986 | 198.7 |
| B | 12 | 111 | 22996 | 110.77 | 1013 | 986 | 198.7 |
| C | 14 | 234 | 33482 | 139.61 | 984 | 990 | 232.7 |
| C | 13 | 61 | 7425 | 27.65 | 984 | 990 | 232.7 |
| C | 10 | 22 | 3300 | 9.93 | 984 | 990 | 232.7 |
| D | 1 | 52 | 415433 | 1689.03 | 981 | 955 | 245.4 |
| D | 6 | 225 | 57427 | 230.13 | 981 | 955 | 245.4 |
| D | 7 | 71 | 42038 | 167.42 | 981 | 955 | 245.4 |
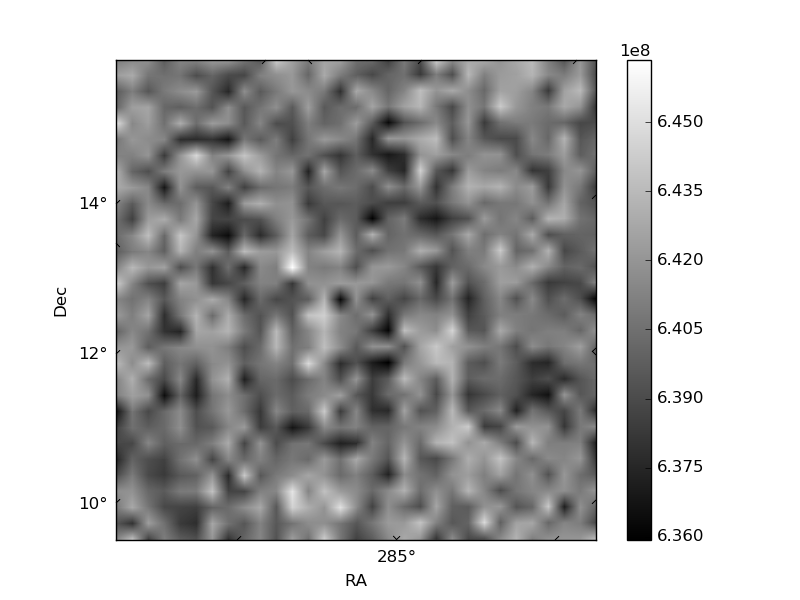
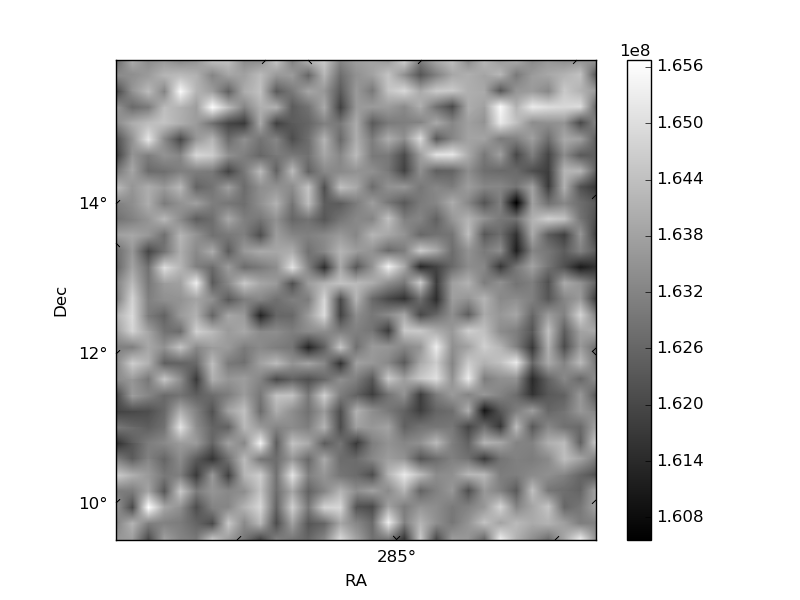
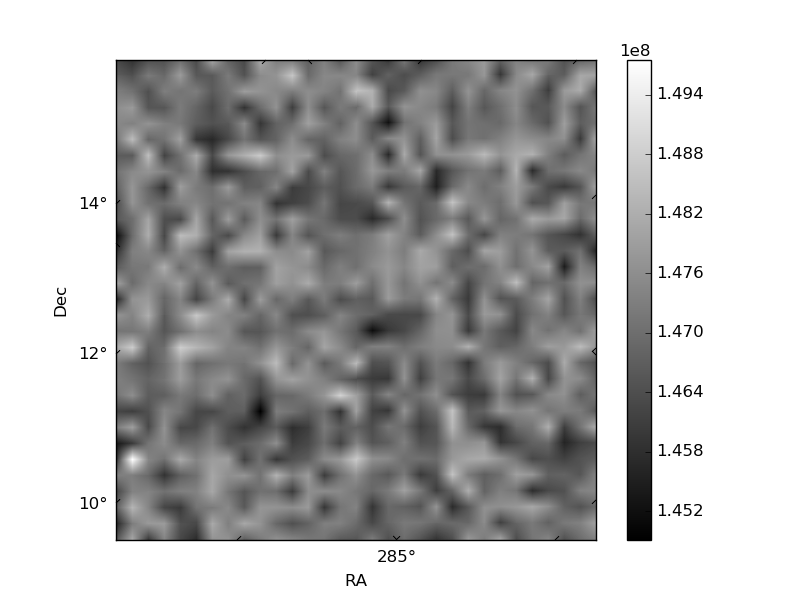
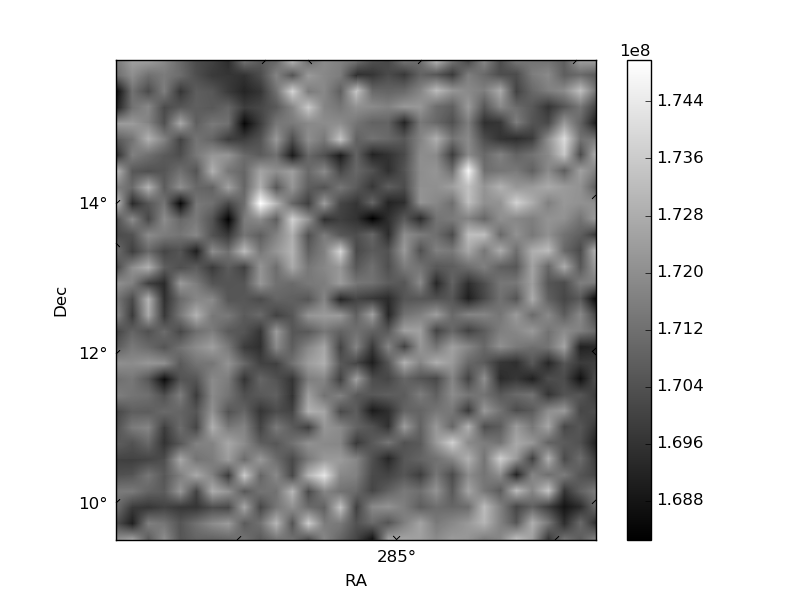
Histogram calculated using DETX and DETY for each event in the final _common_clean file
| Quadrant A | 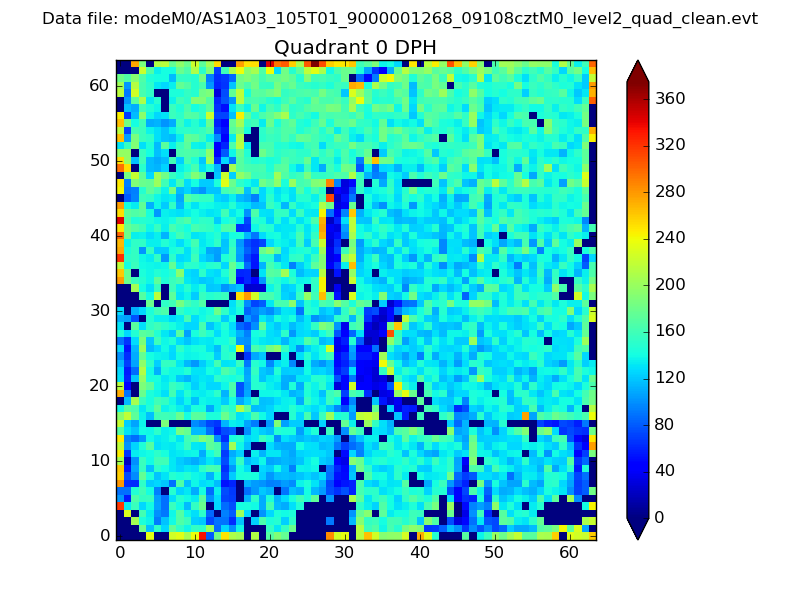 |
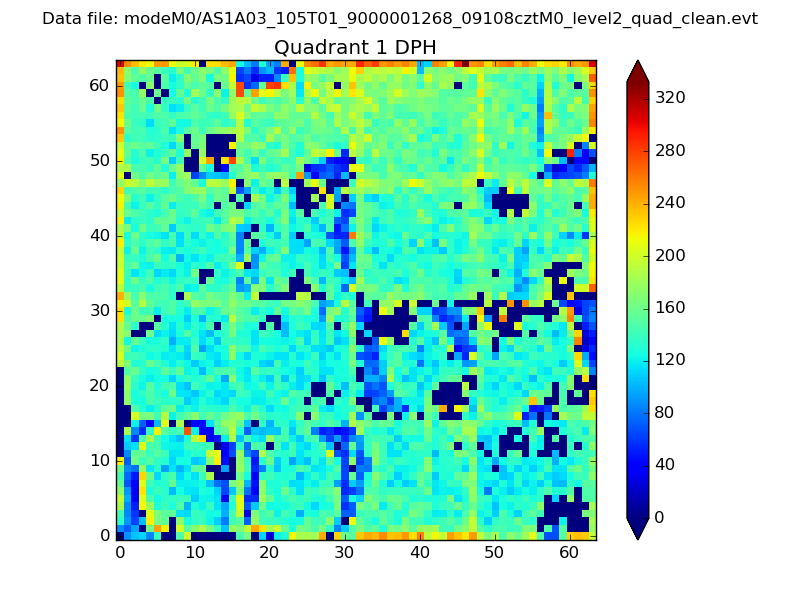 |
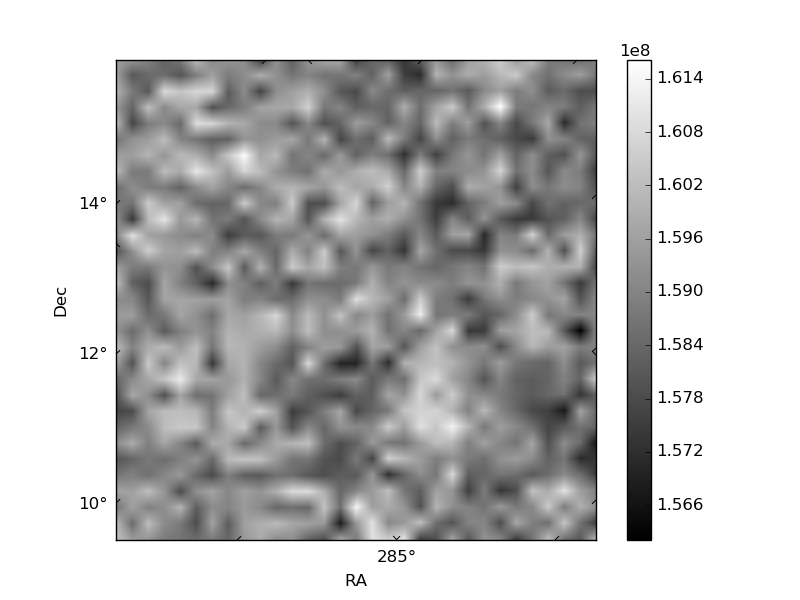
Quadrant B |
|---|---|---|---|
| Quadrant D | 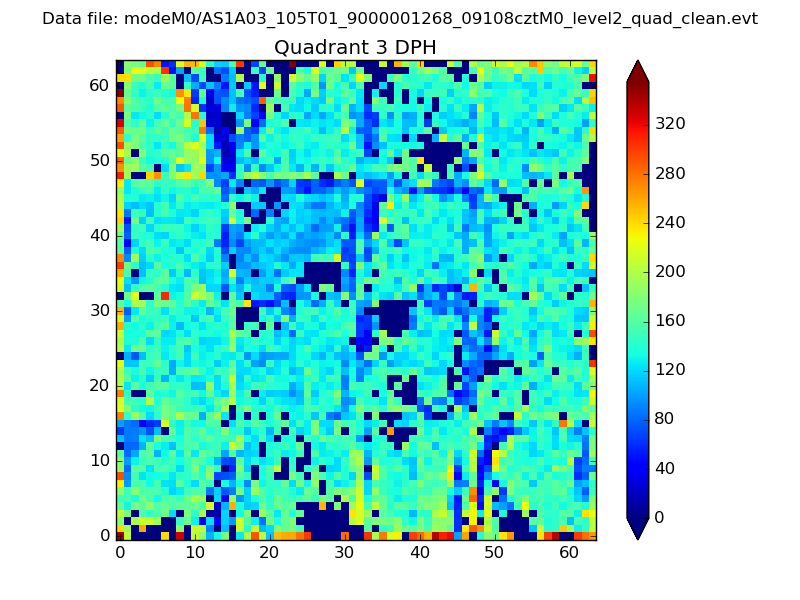 |
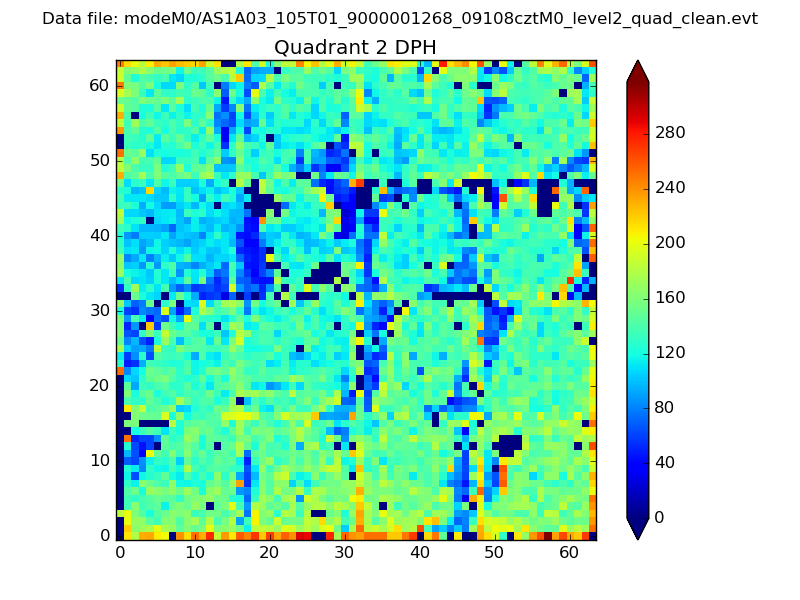 |
Quadrant C |
| Plot type | Count rate plots | Images |
|---|---|---|
| Comparison with Poisson distribution Blue bars denote a histogram of data divided into 1 sec bins. Red curve is a Poisson curve with rate = median count rate of data. |
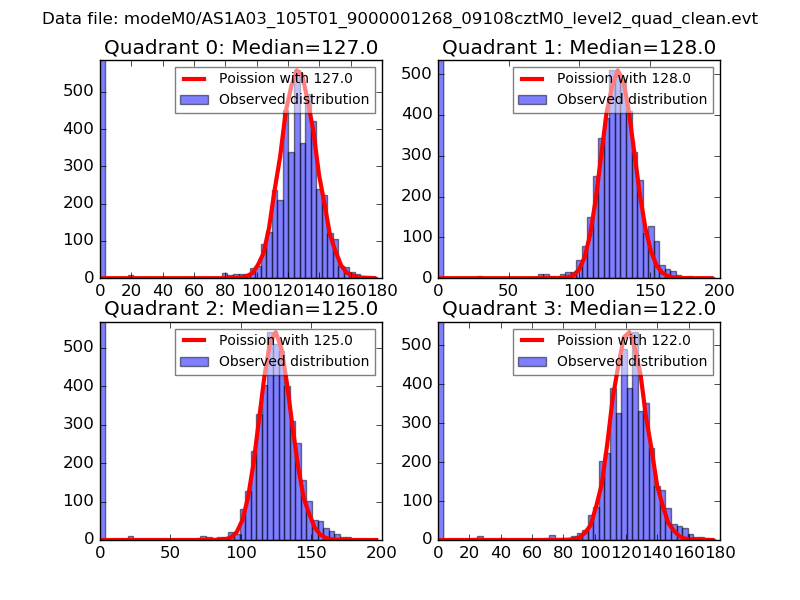 |
 |
| Quadrant-wise count rates Data is divided into 100 sec bins |
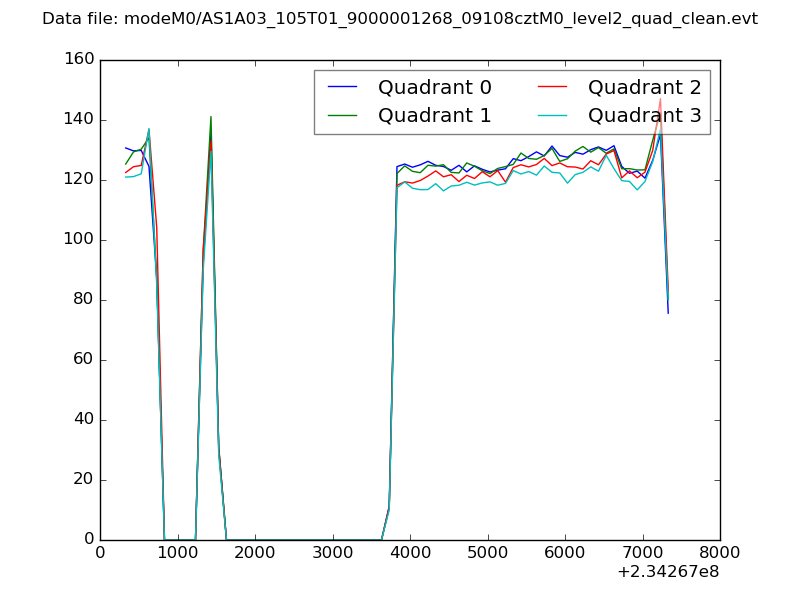 |
|
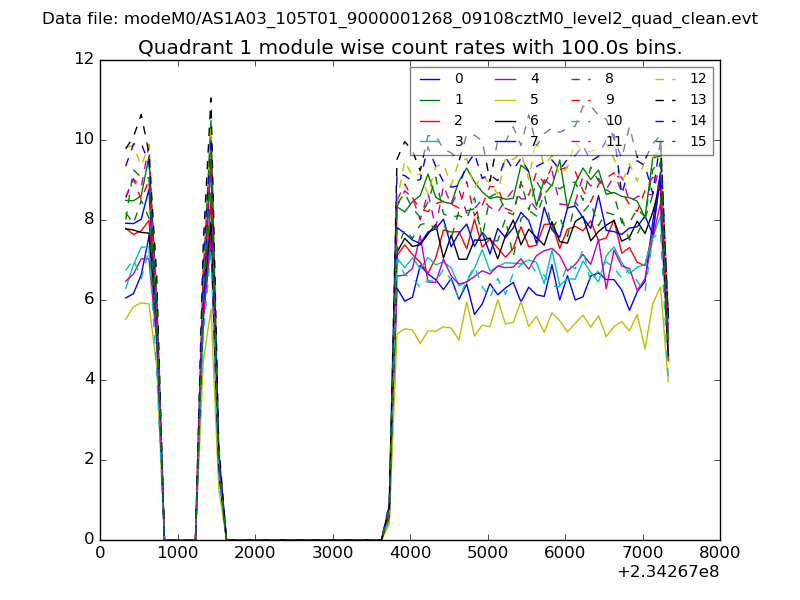
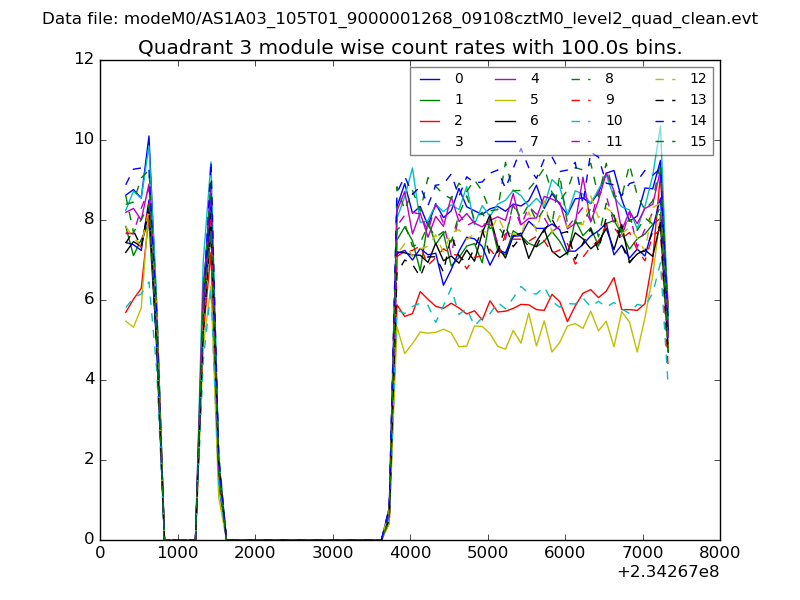
| Module-wise count rates for Quadrant A Data is divided into 100 sec bins |
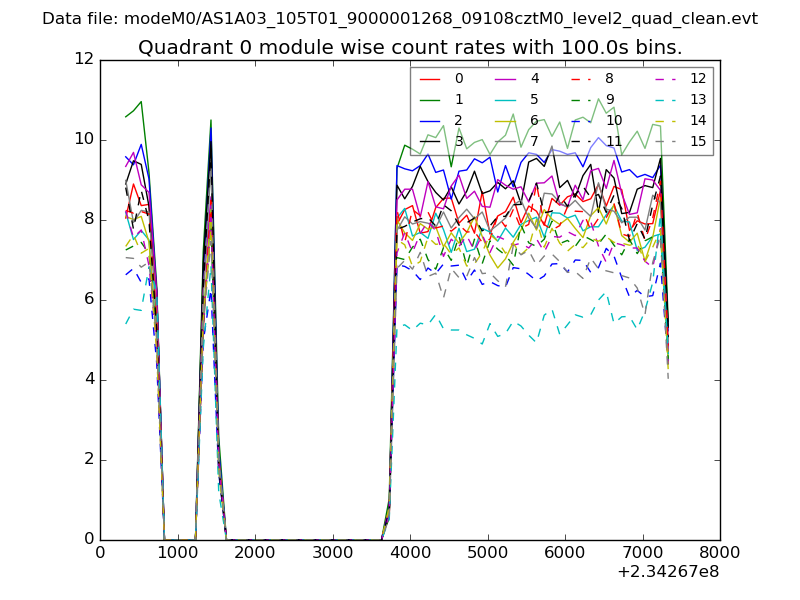 |
 |
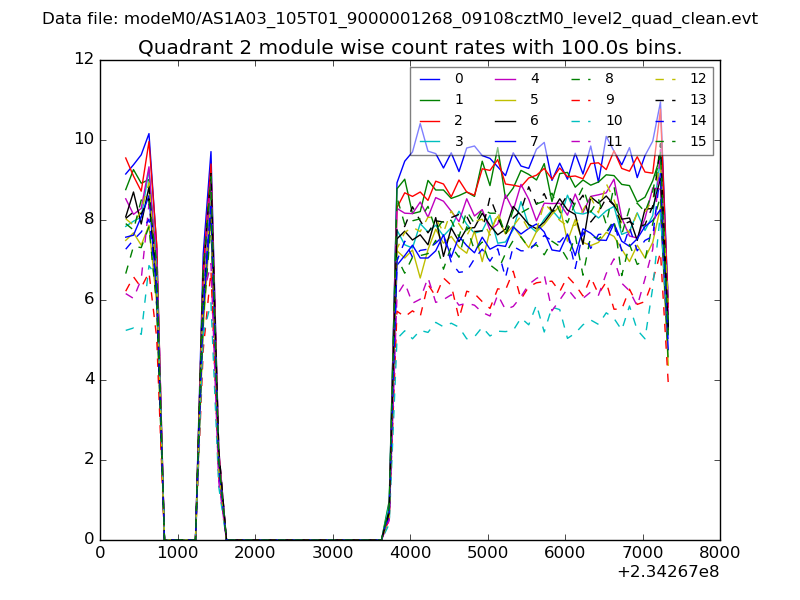
| Module-wise count rates for Quadrant B Data is divided into 100 sec bins |
 |
 |
| Module-wise count rates for Quadrant C Data is divided into 100 sec bins |
 |
 |
| Module-wise count rates for Quadrant D Data is divided into 100 sec bins |
 |
 |
| Parameter | Plot |
|---|---|
| CZT HV Monitor | 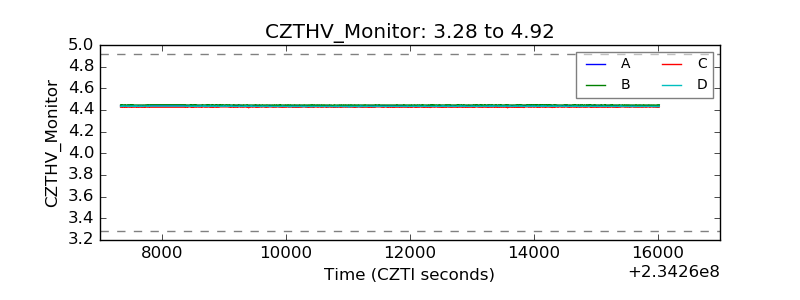 |
| D_VDD | 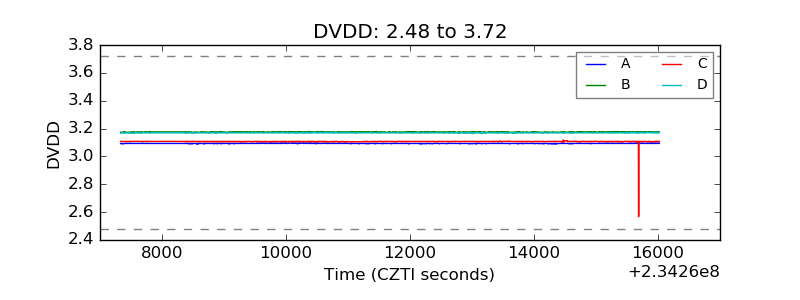 |
| Temperature 1 | 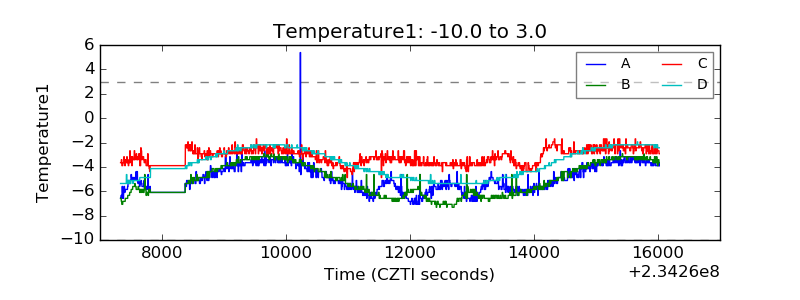 |
| Veto HV Monitor | 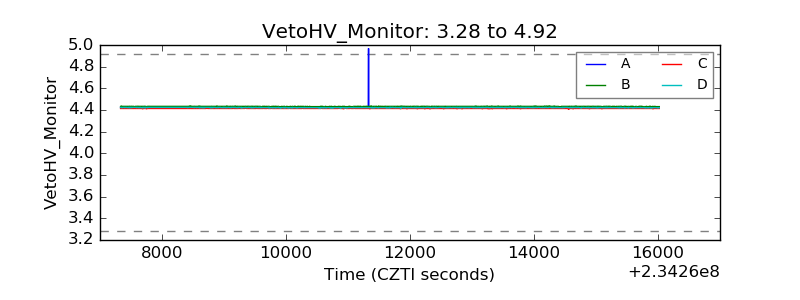 |
| Veto LLD | 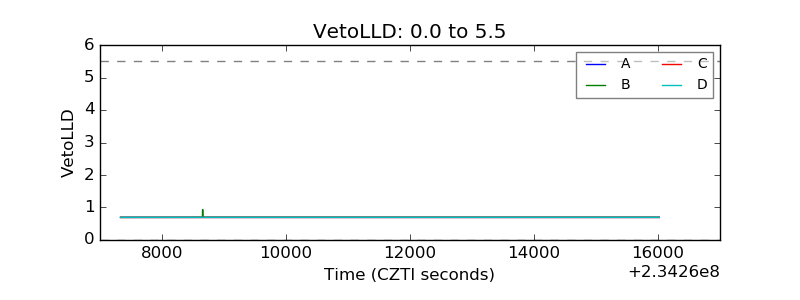 |
| Alpha Counter | 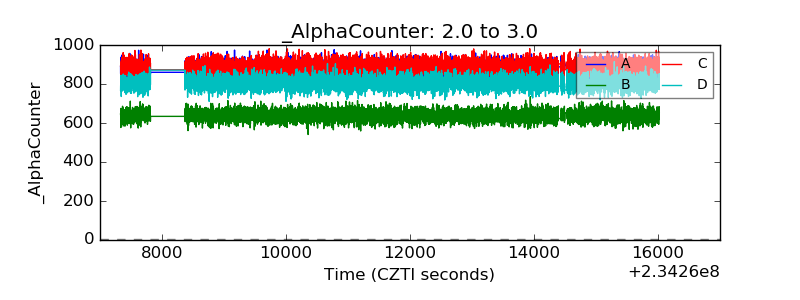 |
| _CPM_Rate | 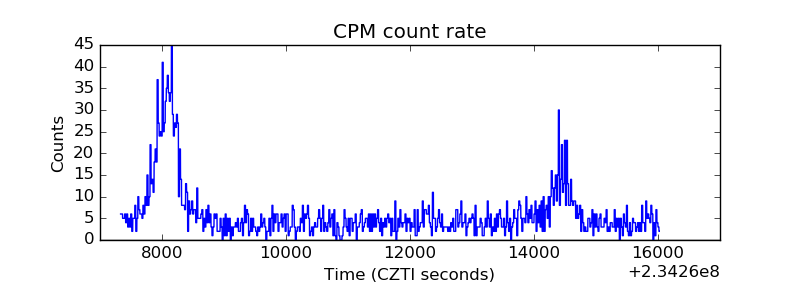 |
| CZT Counter | 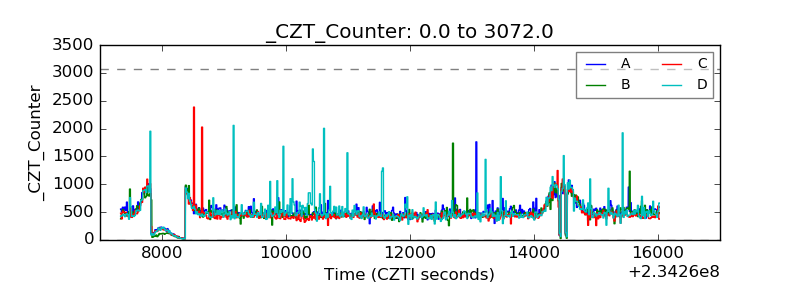 |
| +2.5 Volts monitor | 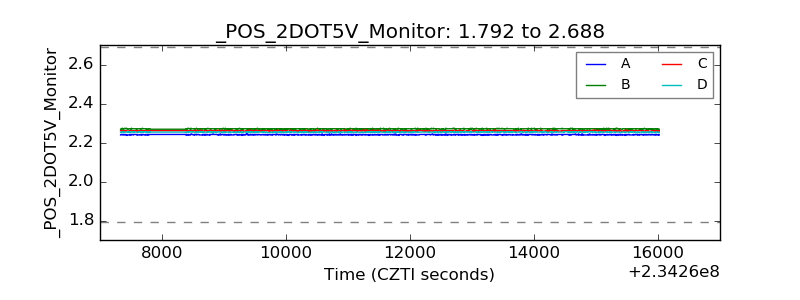 |
| +5 Volts monitor | 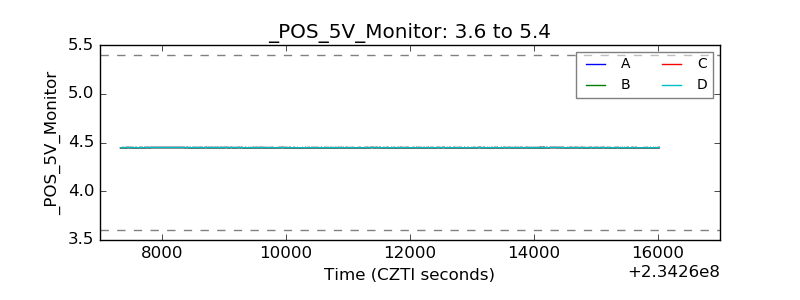 |
| _ROLL_ROT | 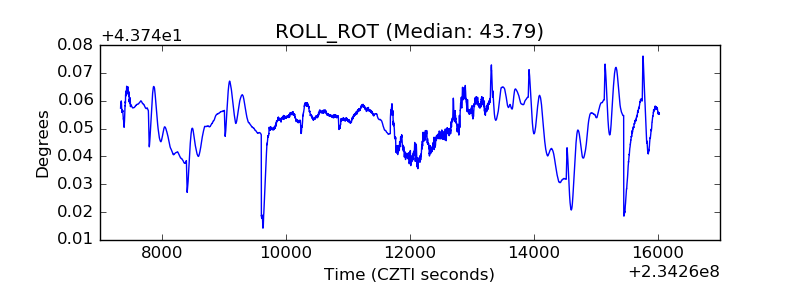 |
| _Roll_DEC | 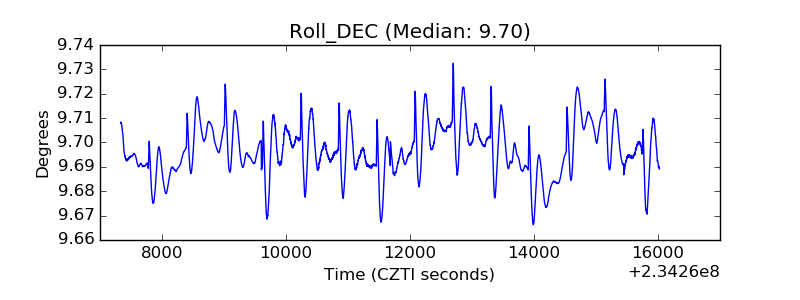 |
| _Roll_RA | 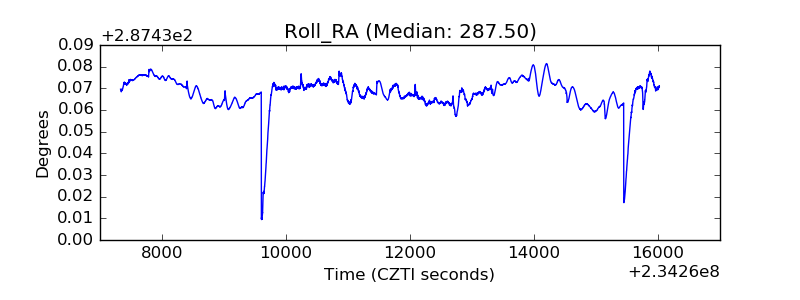 |
| Veto Counter | 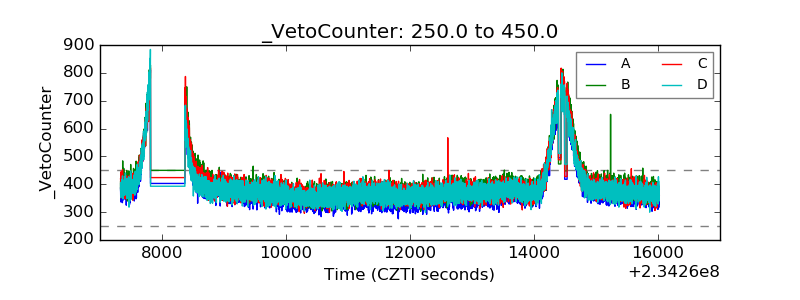 |