| Param | Original file | Final file |
|---|---|---|
| Filename | modeM0/AS1A03_105T01_9000001268_09109cztM0_level2.evt | modeM0/AS1A03_105T01_9000001268_09109cztM0_level2_quad_clean.evt |
| Size (bytes) | 564,837,120 | 81,509,760 |
| Size | 538.7 MB | 77.7 MB |
| Events in quadrant A | 4,289,645 | 482,686 |
| Events in quadrant B | 4,041,744 | 486,272 |
| Events in quadrant C | 3,830,475 | 474,111 |
| Events in quadrant D | 4,397,233 | 465,312 |
| Mode M0 | |||
|---|---|---|---|
| Quadrant | BADHDUFLAG | Total packets | Discarded packets |
| A | 0 | 17681 | 4 |
| B | 0 | 17199 | 5 |
| C | 0 | 17039 | 3 |
| D | 0 | 18418 | 5 |
| Mode SS | |||
|---|---|---|---|
| Quadrant | BADHDUFLAG | Total packets | Discarded packets |
| A | 0 | 166 | 0 |
| B | 0 | 166 | 0 |
| C | 0 | 166 | 0 |
| D | 0 | 166 | 0 |
| Mode M9 | |||
|---|---|---|---|
| Quadrant | BADHDUFLAG | Total packets | Discarded packets |
| A | 0 | 3 | 0 |
| B | 0 | 3 | 0 |
| C | 0 | 3 | 0 |
| D | 0 | 3 | 0 |
| Quadrant | Total seconds | Saturated seconds | Saturation percentage |
|---|---|---|---|
| A | 8050 | 342 | 4.248447% |
| B | 8049 | 355 | 4.410486% |
| C | 8050 | 286 | 3.552795% |
| D | 8049 | 380 | 4.721083% |
Noise dominated data is calculated using 1-second bins in cleaned event files. If a bin has >2000 counts, and if more than 50% of those come from <1% of pixels, then it is considered to be noise-dominated and hence unusable.
| Quadrant | # 1 sec bins | Bins with >0 counts | Bins with >2000 counts | High rate bins dominated by noise | Noise dominated (total time) | Noise dominated (detector-on time) | Marked lightcurve |
|---|---|---|---|---|---|---|---|
| A | 8370 | 8050 | 14 | 14 | 0.17% | 0.17% | 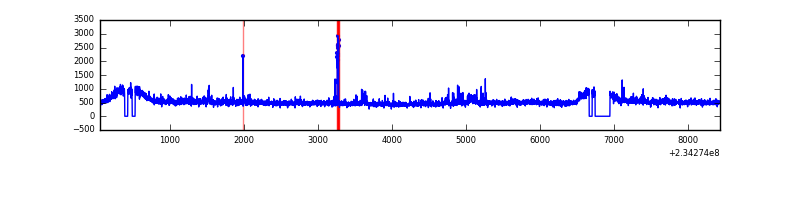 |
| B | 8370 | 8051 | 3 | 3 | 0.04% | 0.04% | 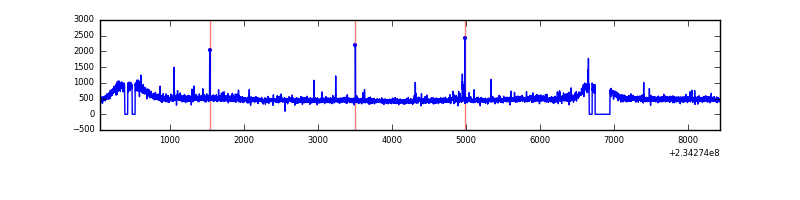 |
| C | 8370 | 8053 | 5 | 5 | 0.06% | 0.06% | 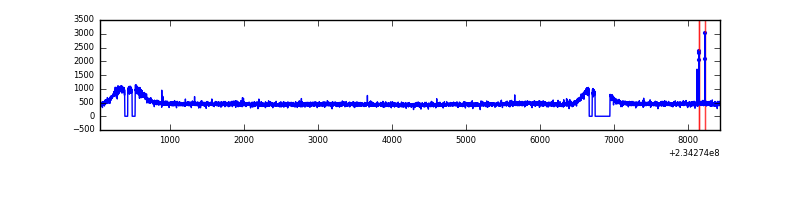 |
| D | 8370 | 8052 | 40 | 40 | 0.48% | 0.50% | 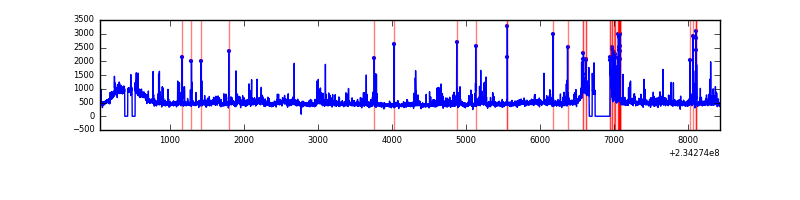 |
Top three noisy pixels from each quadrant. If the there are fewer than three noisy pixels in the level2.evt file, extra rows are filled as -1
| Pixel properties | Quadrant properties | ||||||
|---|---|---|---|---|---|---|---|
| Quadrant | DetID | PixID | Counts | Sigma | Mean | Median | Sigma |
| A | 8 | 5 | 237587 | 1137.31 | 1011 | 990 | 208.0 |
| A | 15 | 174 | 72059 | 341.63 | 1011 | 990 | 208.0 |
| A | 1 | 162 | 60196 | 284.6 | 1011 | 990 | 208.0 |
| B | 0 | 214 | 91993 | 459.52 | 1008 | 982 | 198.1 |
| B | 12 | 111 | 22836 | 110.34 | 1008 | 982 | 198.1 |
| B | 11 | 111 | 18372 | 87.8 | 1008 | 982 | 198.1 |
| C | 14 | 234 | 11608 | 46.32 | 975 | 980 | 229.5 |
| C | 13 | 61 | 7400 | 27.98 | 975 | 980 | 229.5 |
| C | 12 | 4 | 7325 | 27.65 | 975 | 980 | 229.5 |
| D | 1 | 52 | 397034 | 1600.61 | 970 | 943 | 247.5 |
| D | 13 | 104 | 79075 | 315.73 | 970 | 943 | 247.5 |
| D | 6 | 225 | 76850 | 306.74 | 970 | 943 | 247.5 |
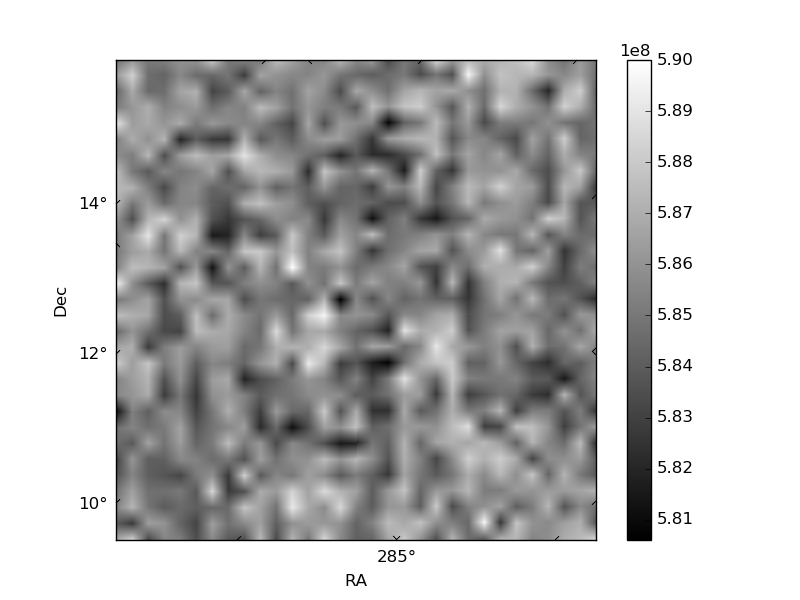
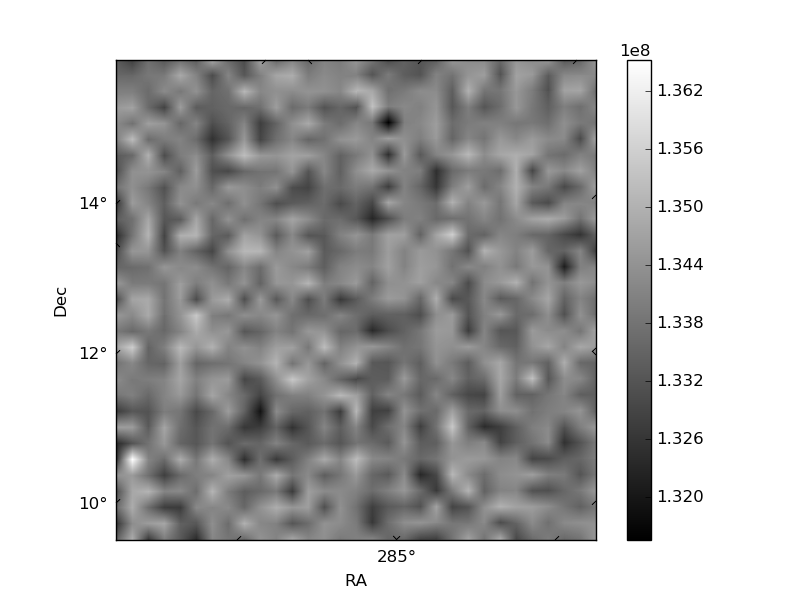
Histogram calculated using DETX and DETY for each event in the final _common_clean file
| Quadrant A | 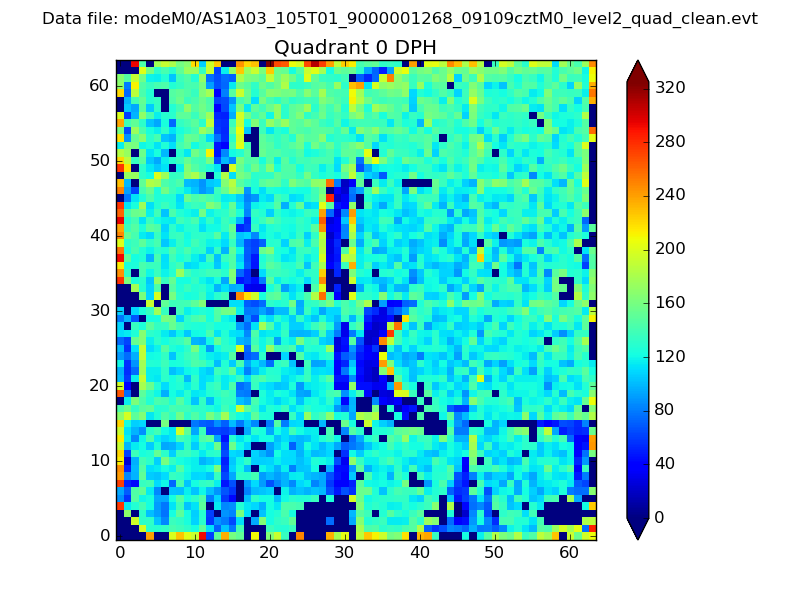 |
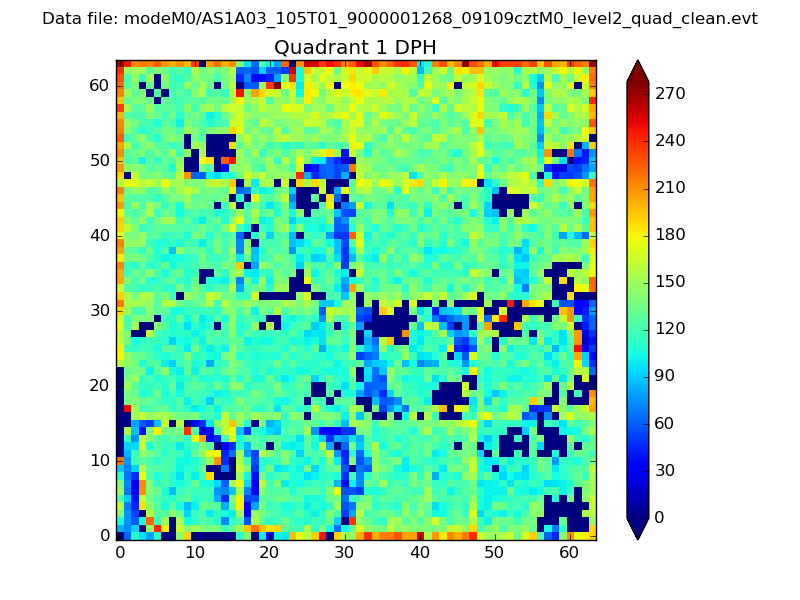 |
Quadrant B |
|---|---|---|---|
| Quadrant D |  |
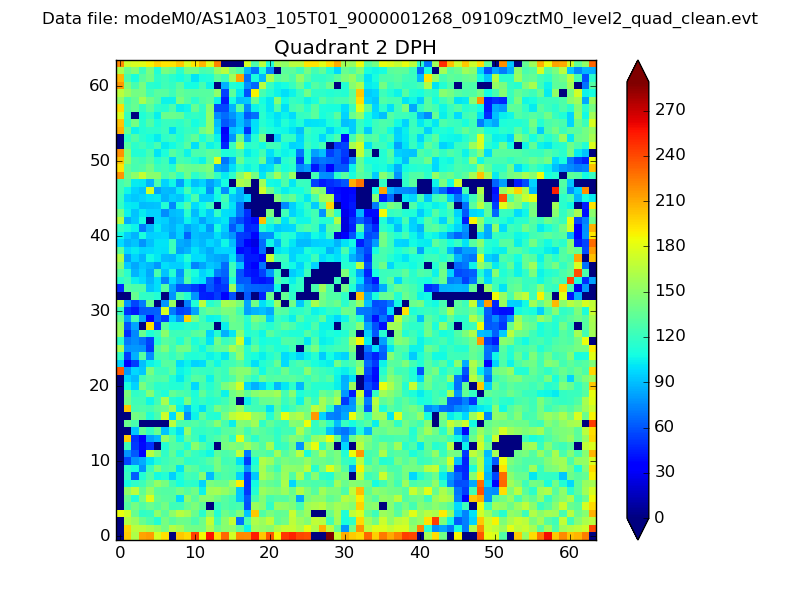 |
Quadrant C |
| Plot type | Count rate plots | Images |
|---|---|---|
| Comparison with Poisson distribution Blue bars denote a histogram of data divided into 1 sec bins. Red curve is a Poisson curve with rate = median count rate of data. |
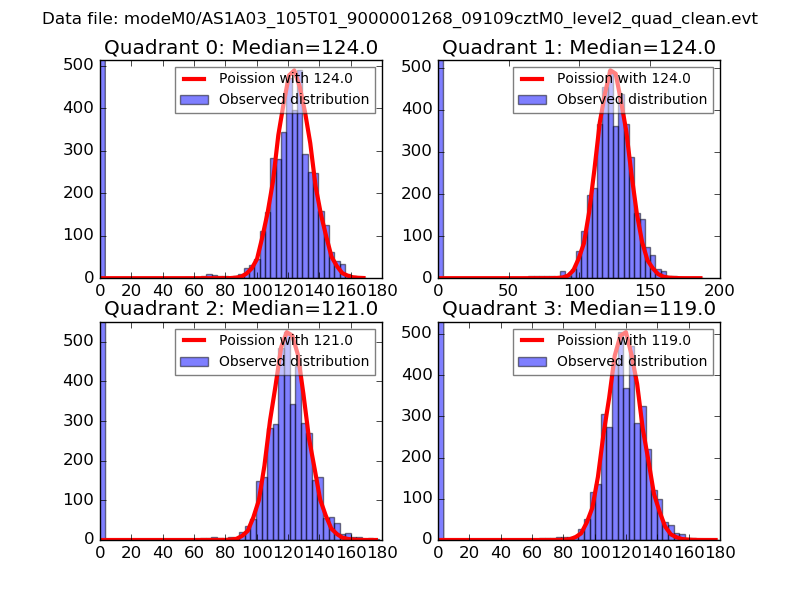 |
 |
| Quadrant-wise count rates Data is divided into 100 sec bins |
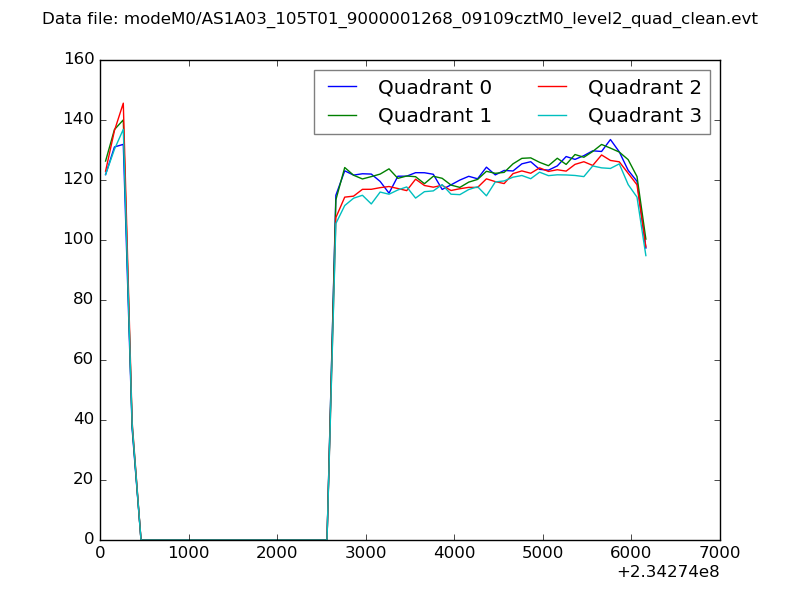 |
|
| Module-wise count rates for Quadrant A Data is divided into 100 sec bins |
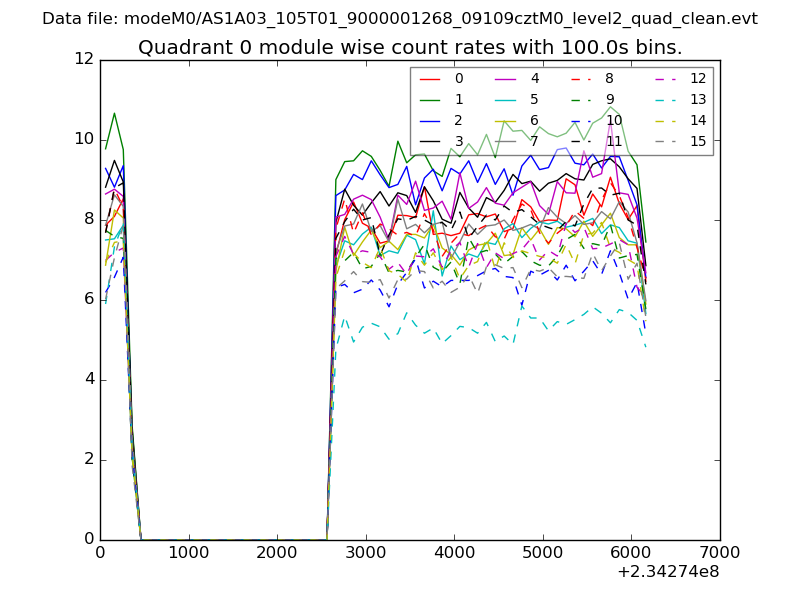 |
 |
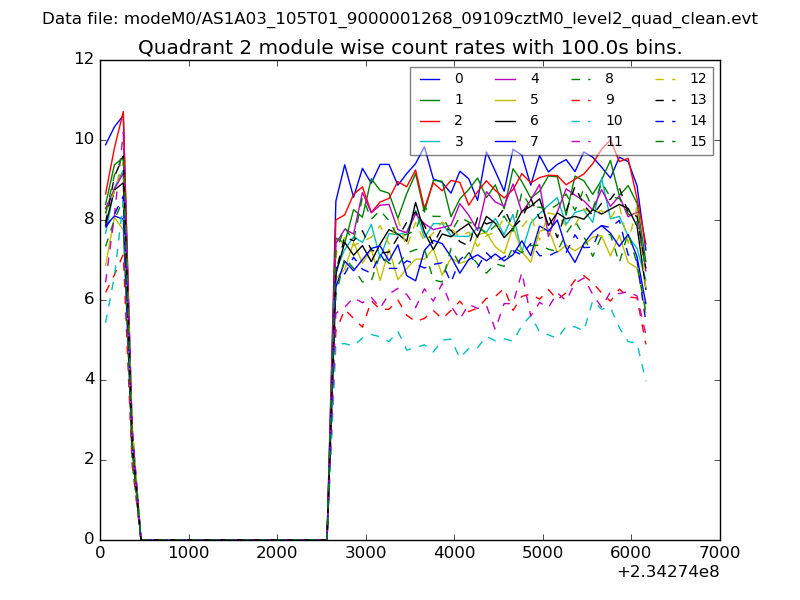
| Module-wise count rates for Quadrant B Data is divided into 100 sec bins |
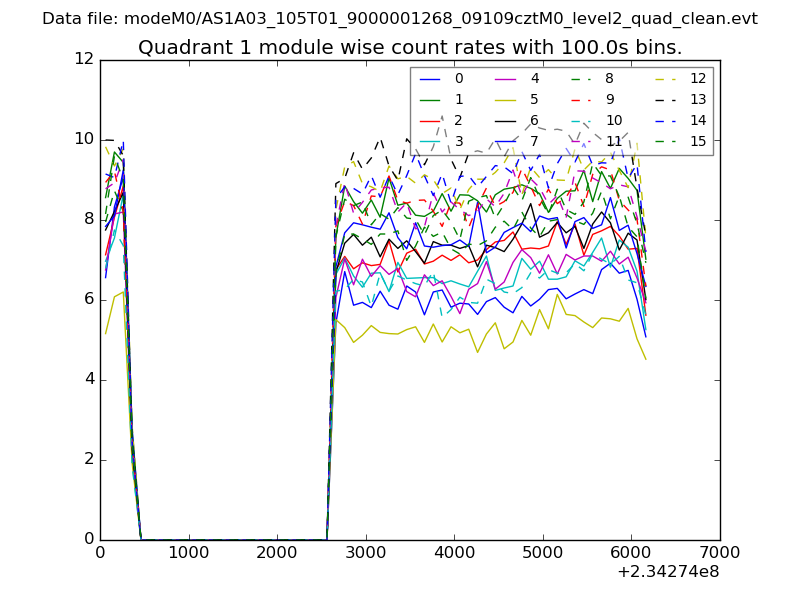 |
 |
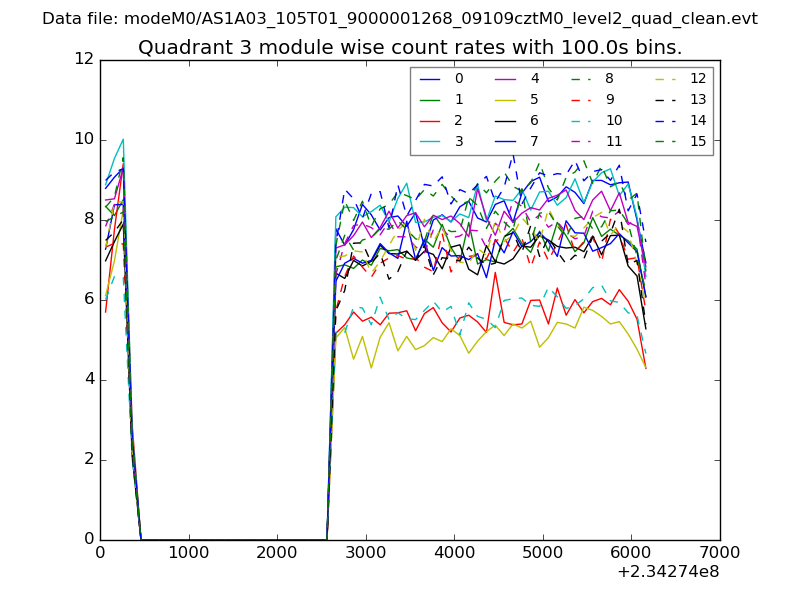
| Module-wise count rates for Quadrant C Data is divided into 100 sec bins |
 |
 |
| Module-wise count rates for Quadrant D Data is divided into 100 sec bins |
 |
 |
| Parameter | Plot |
|---|---|
| CZT HV Monitor | 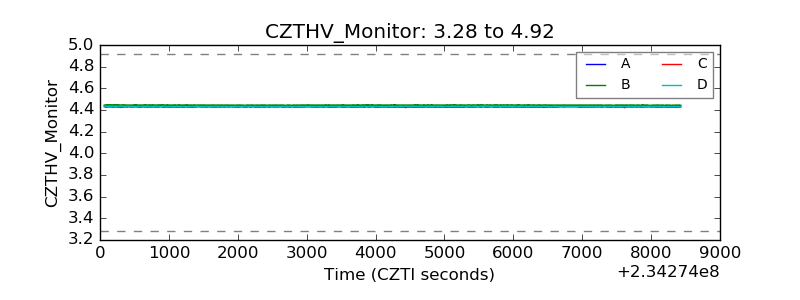 |
| D_VDD | 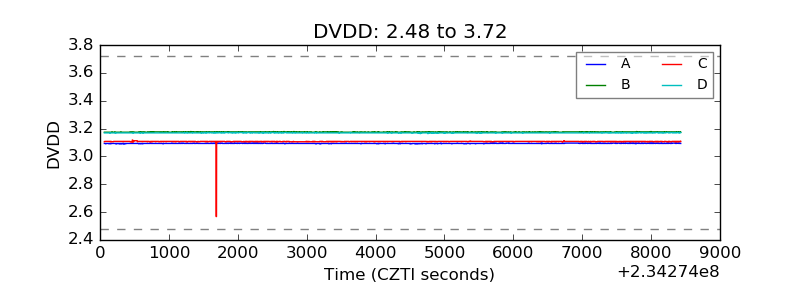 |
| Temperature 1 | 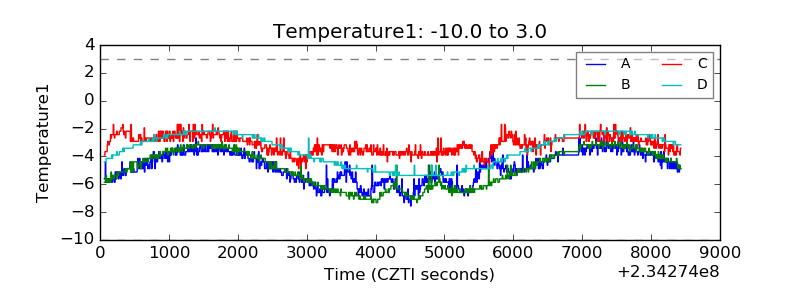 |
| Veto HV Monitor | 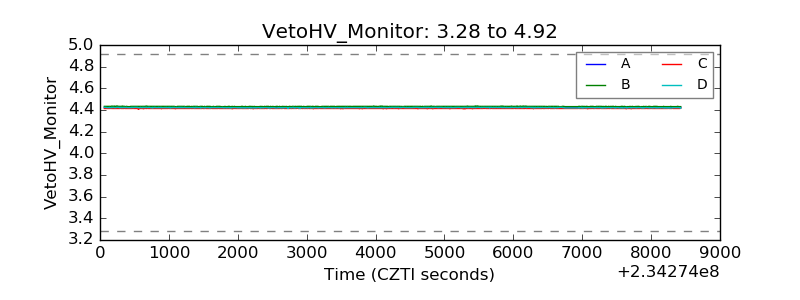 |
| Veto LLD | 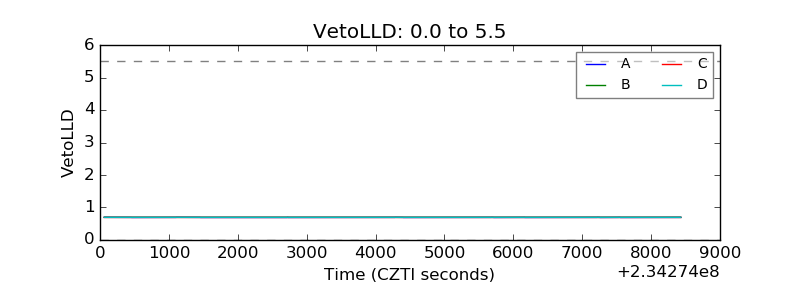 |
| Alpha Counter | 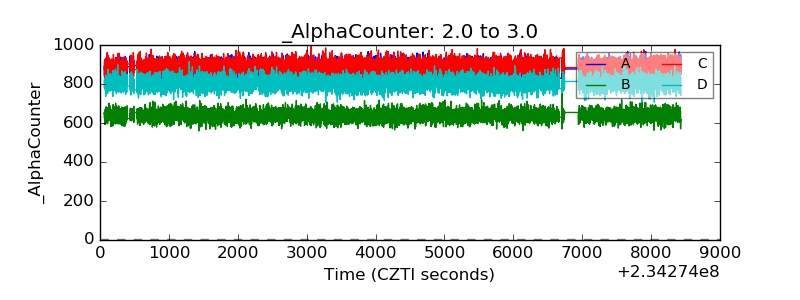 |
| _CPM_Rate | 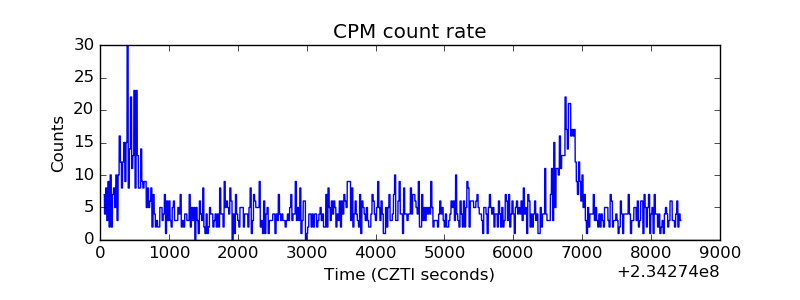 |
| CZT Counter | 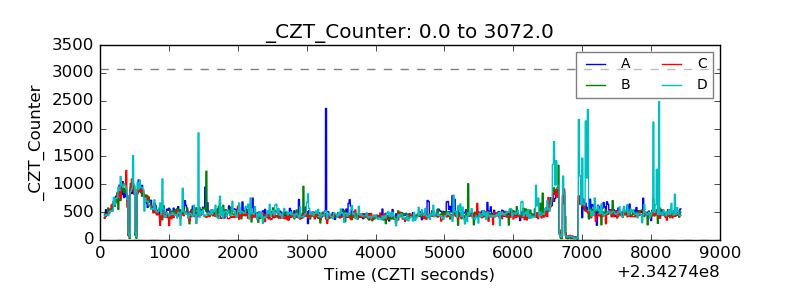 |
| +2.5 Volts monitor |  |
| +5 Volts monitor |  |
| _ROLL_ROT | 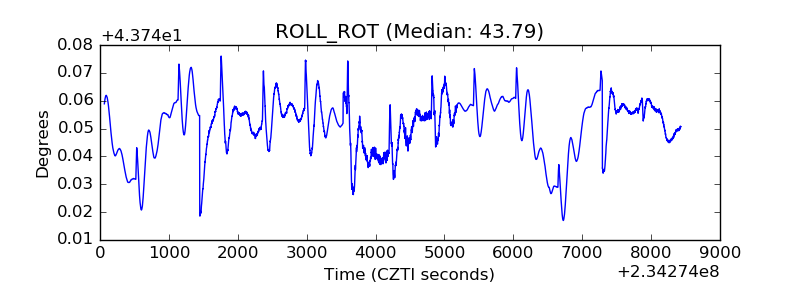 |
| _Roll_DEC | 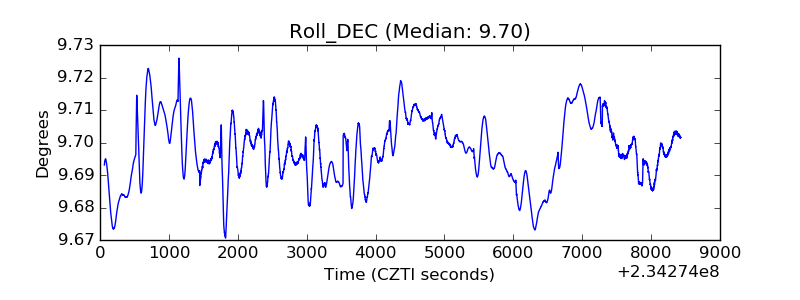 |
| _Roll_RA | 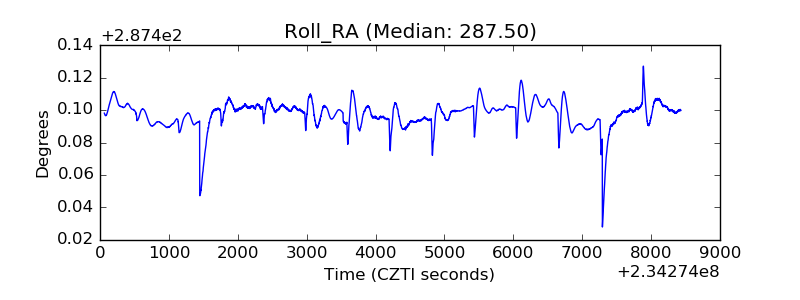 |
| Veto Counter | 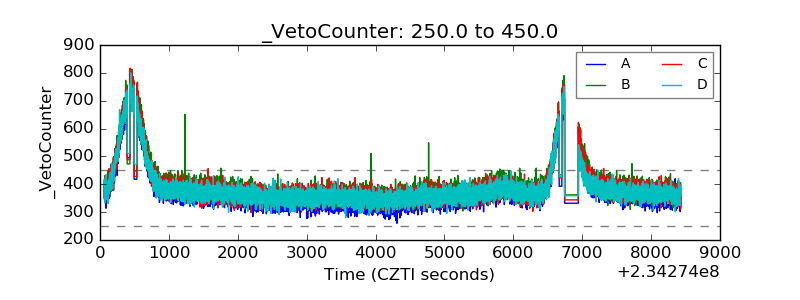 |