| Param | Original file | Final file |
|---|---|---|
| Filename | modeM0/AS1A03_105T01_9000001268_09110cztM0_level2.evt | modeM0/AS1A03_105T01_9000001268_09110cztM0_level2_quad_clean.evt |
| Size (bytes) | 455,230,080 | 74,851,200 |
| Size | 434.1 MB | 71.4 MB |
| Events in quadrant A | 3,415,913 | 455,642 |
| Events in quadrant B | 3,270,415 | 451,686 |
| Events in quadrant C | 3,162,957 | 442,678 |
| Events in quadrant D | 3,463,256 | 431,476 |
| Mode M0 | |||
|---|---|---|---|
| Quadrant | BADHDUFLAG | Total packets | Discarded packets |
| A | 0 | 15403 | 880 |
| B | 0 | 15170 | 908 |
| C | 0 | 15108 | 901 |
| D | 0 | 16229 | 1150 |
| Mode SS | |||
|---|---|---|---|
| Quadrant | BADHDUFLAG | Total packets | Discarded packets |
| A | 0 | 152 | 2 |
| B | 0 | 152 | 4 |
| C | 0 | 152 | 12 |
| D | 0 | 152 | 10 |
| Mode M9 | |||
|---|---|---|---|
| Quadrant | BADHDUFLAG | Total packets | Discarded packets |
| A | 0 | 6 | 0 |
| B | 0 | 6 | 0 |
| C | 0 | 6 | 0 |
| D | 0 | 6 | 0 |
| Quadrant | Total seconds | Saturated seconds | Saturation percentage |
|---|---|---|---|
| A | 6975 | 48 | 0.688172% |
| B | 6958 | 78 | 1.121012% |
| C | 6958 | 58 | 0.833573% |
| D | 6916 | 109 | 1.576056% |
Noise dominated data is calculated using 1-second bins in cleaned event files. If a bin has >2000 counts, and if more than 50% of those come from <1% of pixels, then it is considered to be noise-dominated and hence unusable.
| Quadrant | # 1 sec bins | Bins with >0 counts | Bins with >2000 counts | High rate bins dominated by noise | Noise dominated (total time) | Noise dominated (detector-on time) | Marked lightcurve |
|---|---|---|---|---|---|---|---|
| A | 8049 | 7340 | 0 | 0 | 0.00% | 0.00% | 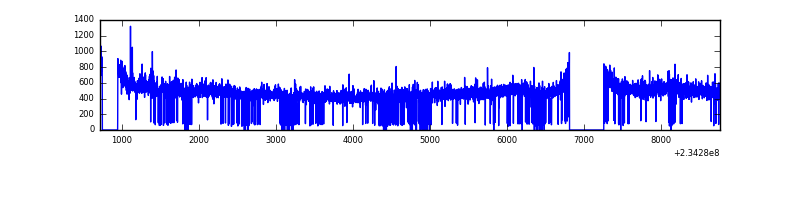 |
| B | 8049 | 7310 | 0 | 0 | 0.00% | 0.00% | 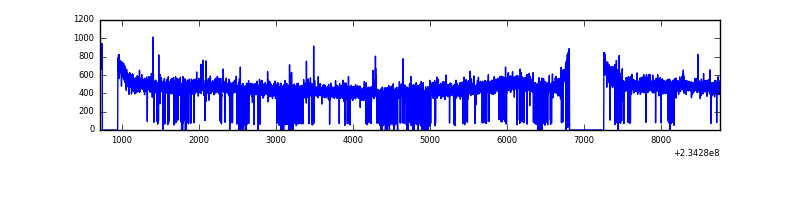 |
| C | 8049 | 7325 | 5 | 5 | 0.06% | 0.07% |  |
| D | 8049 | 7311 | 41 | 41 | 0.51% | 0.56% | 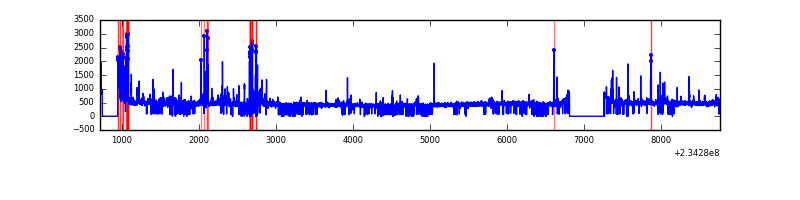 |
Top three noisy pixels from each quadrant. If the there are fewer than three noisy pixels in the level2.evt file, extra rows are filled as -1
| Pixel properties | Quadrant properties | ||||||
|---|---|---|---|---|---|---|---|
| Quadrant | DetID | PixID | Counts | Sigma | Mean | Median | Sigma |
| A | 8 | 5 | 139649 | 800.14 | 838 | 819 | 173.5 |
| A | 1 | 162 | 35140 | 197.81 | 838 | 819 | 173.5 |
| A | 0 | 226 | 7586 | 39.0 | 838 | 819 | 173.5 |
| B | 12 | 111 | 18391 | 107.83 | 836 | 816 | 163.0 |
| B | 11 | 111 | 14949 | 86.71 | 836 | 816 | 163.0 |
| B | 14 | 111 | 10933 | 62.07 | 836 | 816 | 163.0 |
| C | 14 | 234 | 22189 | 113.9 | 803 | 805 | 187.8 |
| C | 12 | 4 | 7468 | 35.49 | 803 | 805 | 187.8 |
| C | 13 | 61 | 5923 | 27.26 | 803 | 805 | 187.8 |
| D | 1 | 52 | 308146 | 1477.96 | 795 | 776 | 208.0 |
| D | 12 | 233 | 37045 | 174.4 | 795 | 776 | 208.0 |
| D | 2 | 234 | 24957 | 116.27 | 795 | 776 | 208.0 |
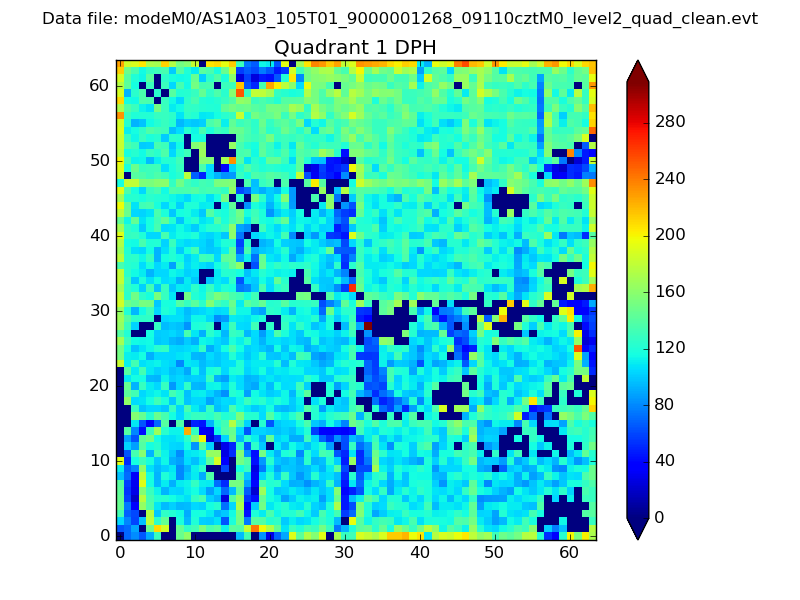
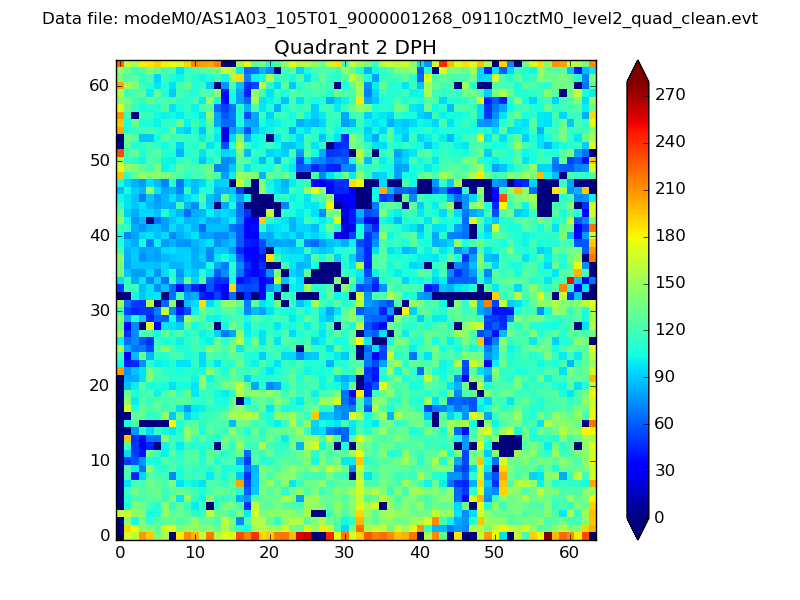
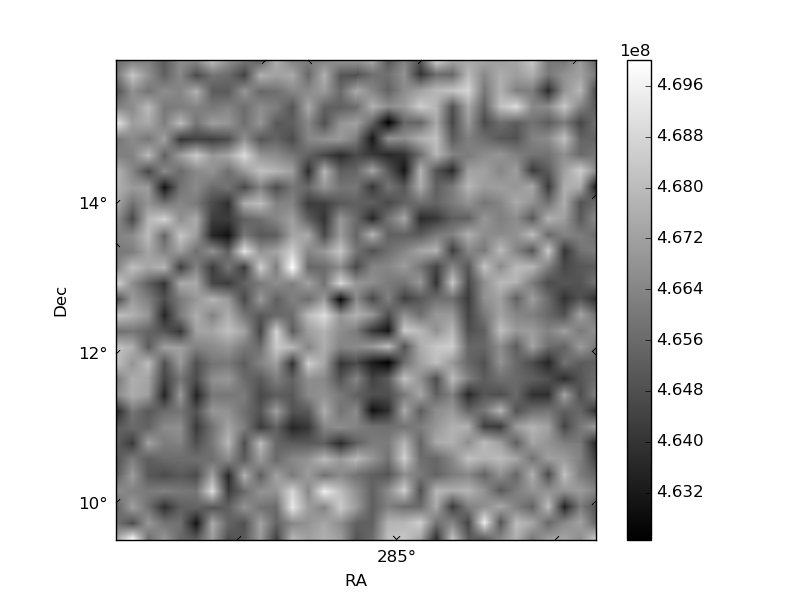
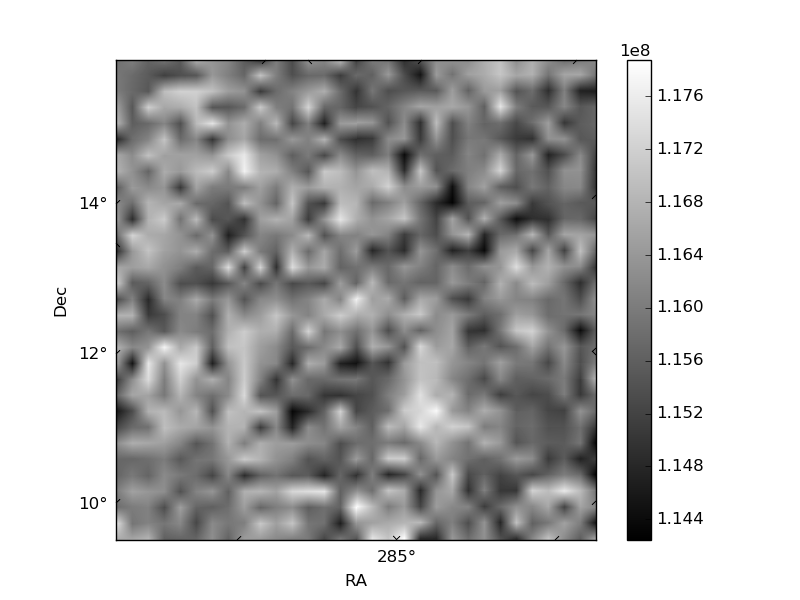
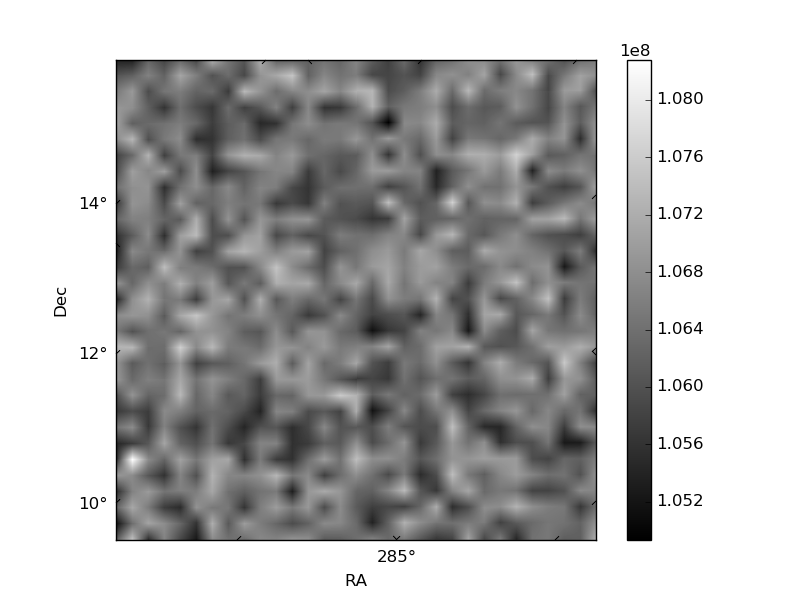
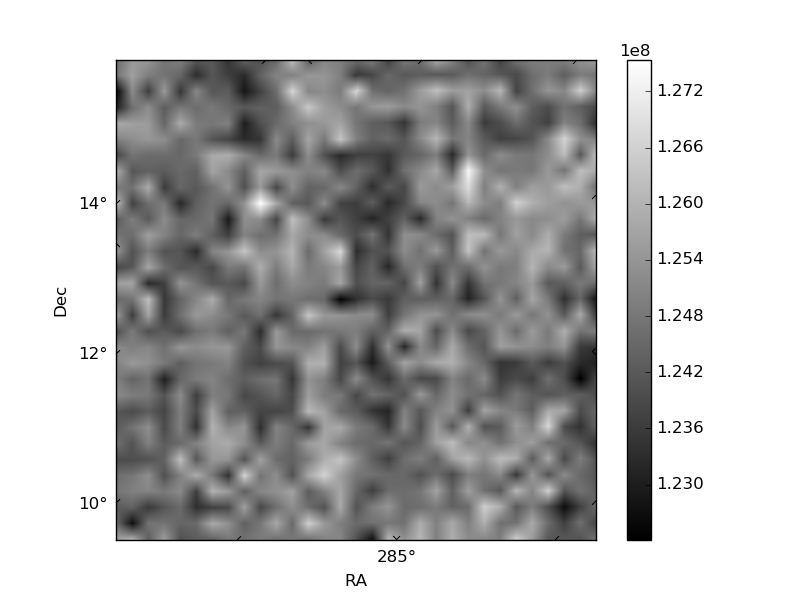
Histogram calculated using DETX and DETY for each event in the final _common_clean file
| Quadrant A | 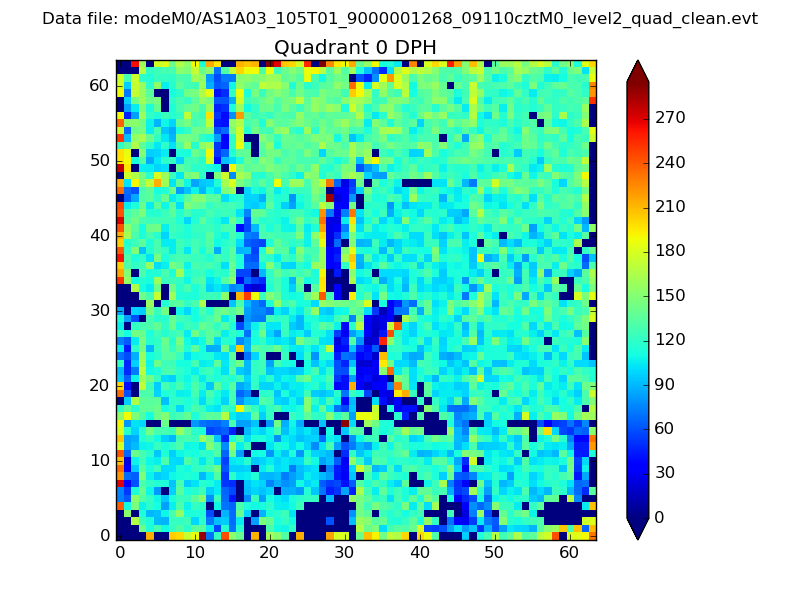 |
 |
Quadrant B |
|---|---|---|---|
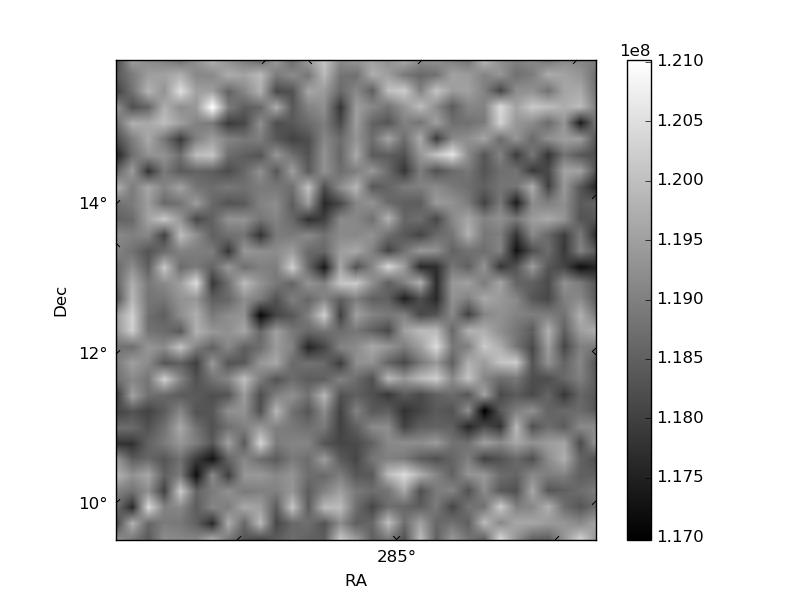
| Quadrant D | 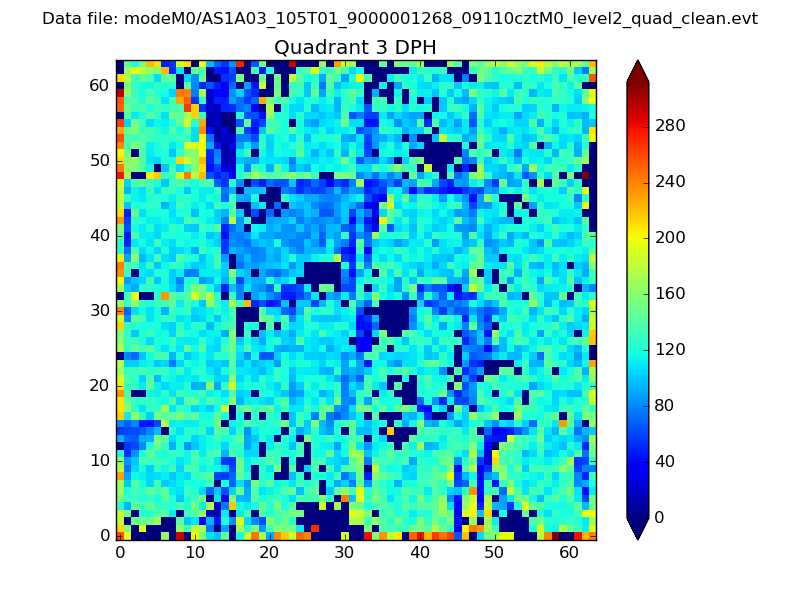 |
 |
Quadrant C |
| Plot type | Count rate plots | Images |
|---|---|---|
| Comparison with Poisson distribution Blue bars denote a histogram of data divided into 1 sec bins. Red curve is a Poisson curve with rate = median count rate of data. |
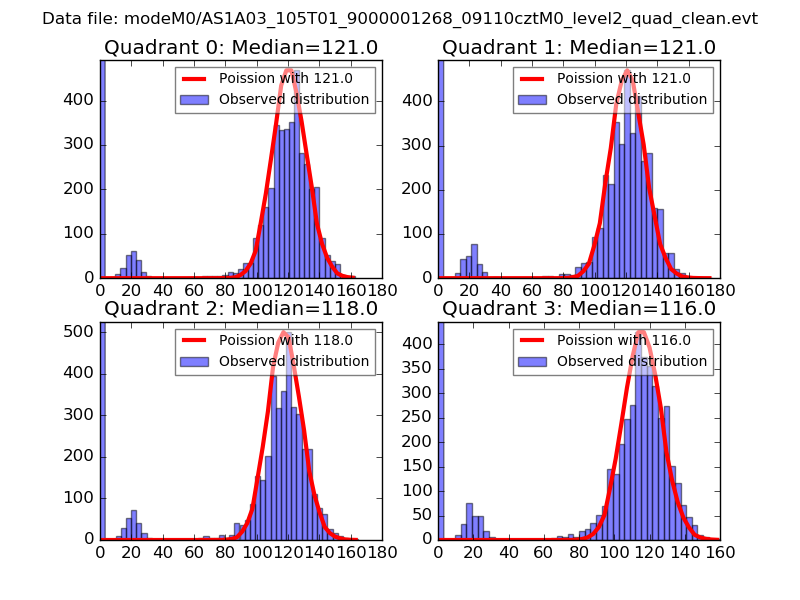 |
 |
| Quadrant-wise count rates Data is divided into 100 sec bins |
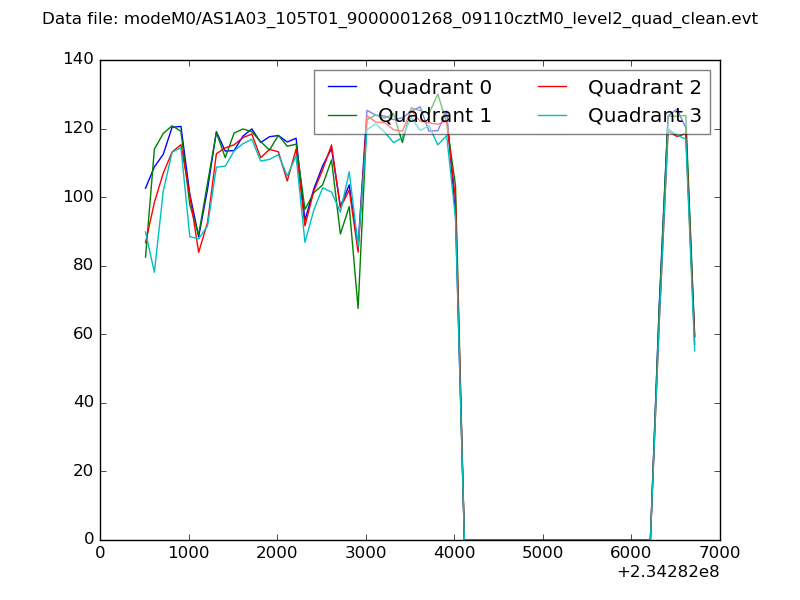 |
|
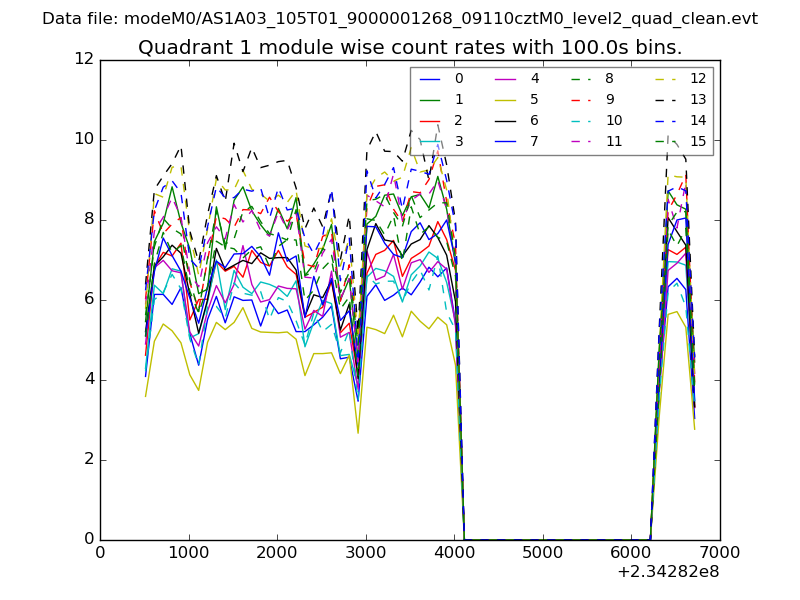
| Module-wise count rates for Quadrant A Data is divided into 100 sec bins |
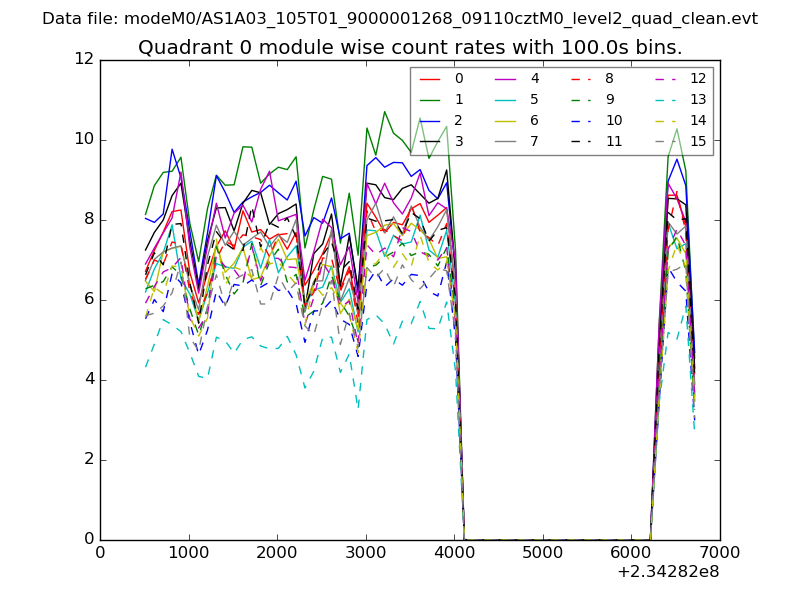 |
 |
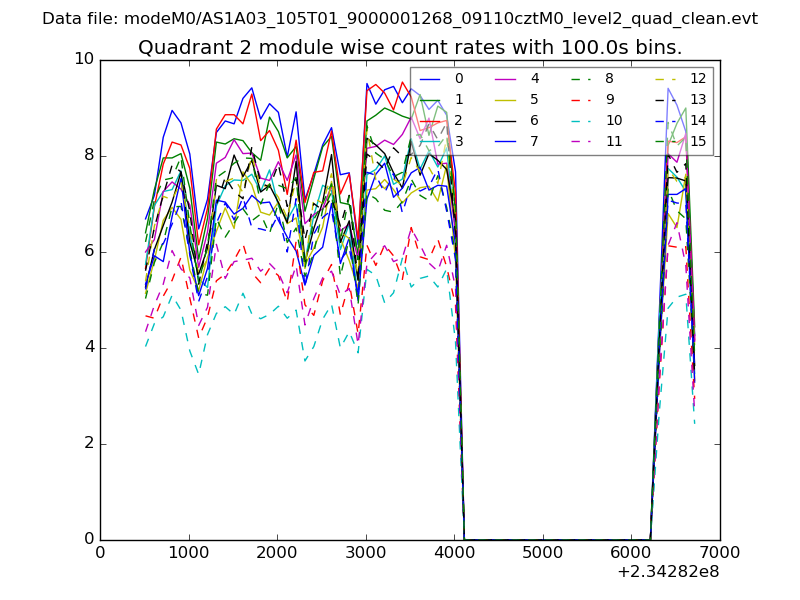
| Module-wise count rates for Quadrant B Data is divided into 100 sec bins |
 |
 |
| Module-wise count rates for Quadrant C Data is divided into 100 sec bins |
 |
 |
| Module-wise count rates for Quadrant D Data is divided into 100 sec bins |
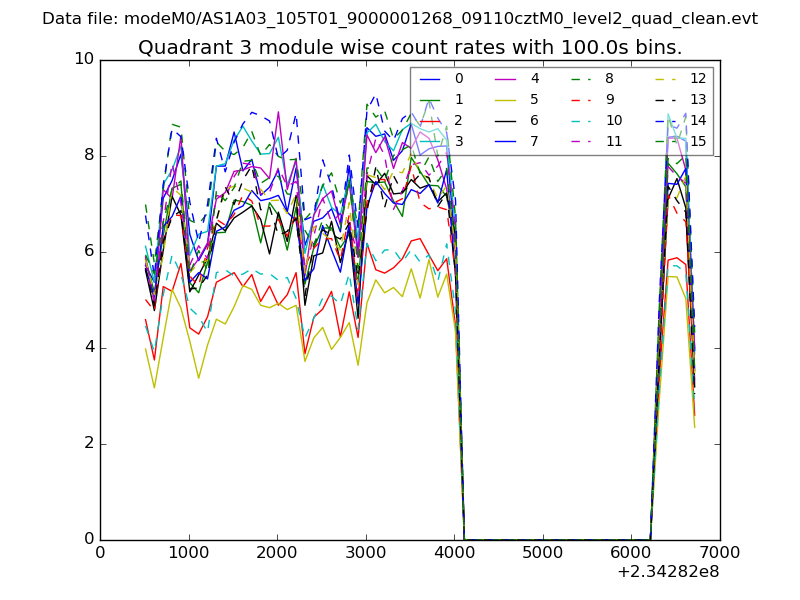 |
 |
| Parameter | Plot |
|---|---|
| CZT HV Monitor | 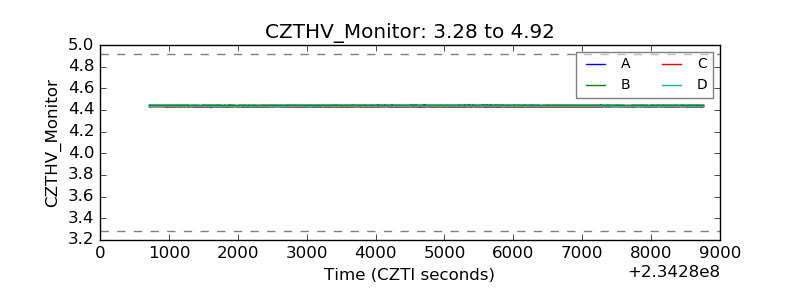 |
| D_VDD | 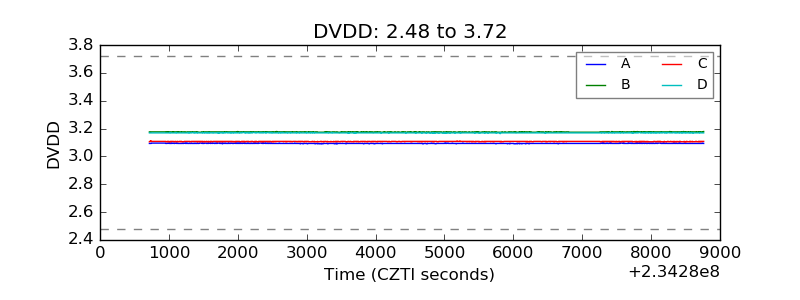 |
| Temperature 1 | 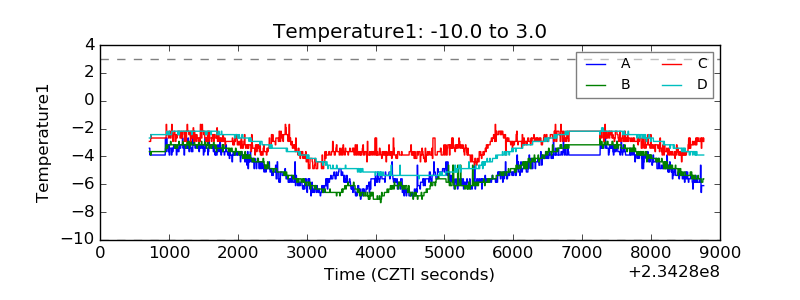 |
| Veto HV Monitor | 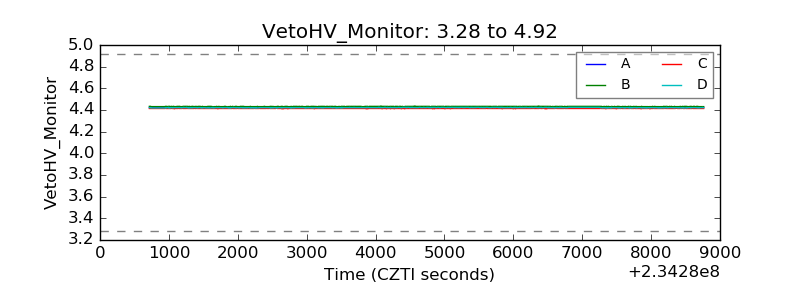 |
| Veto LLD | 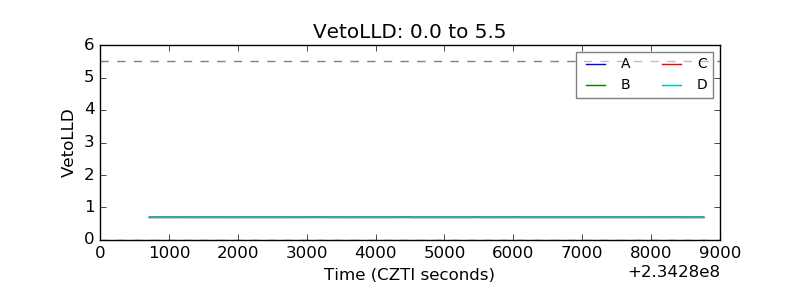 |
| Alpha Counter | 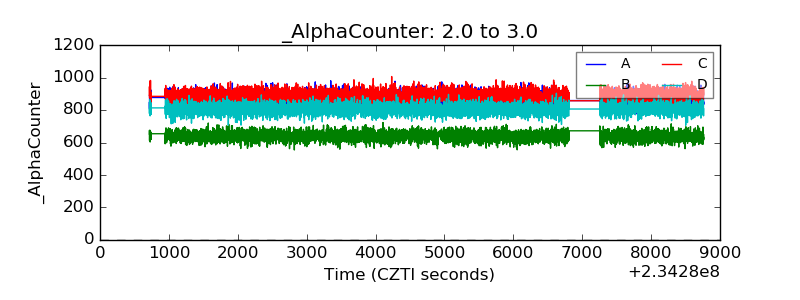 |
| _CPM_Rate | 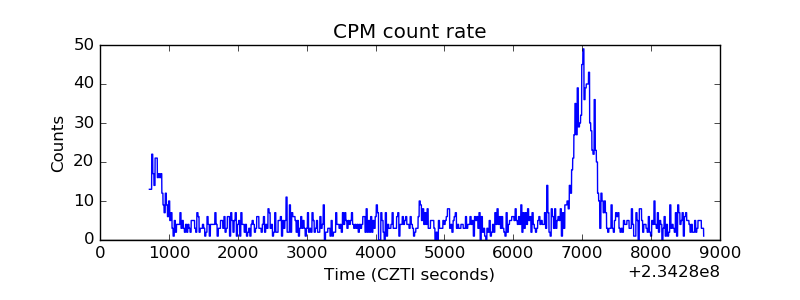 |
| CZT Counter | 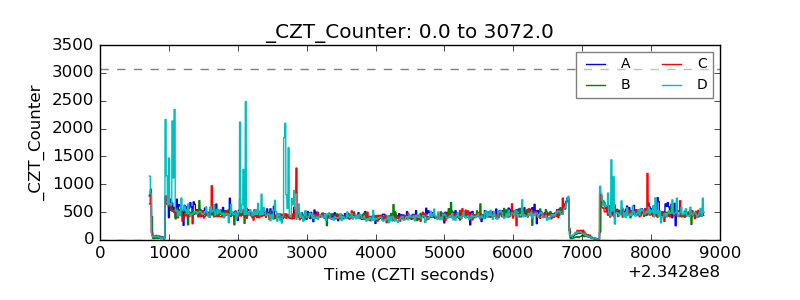 |
| +2.5 Volts monitor | 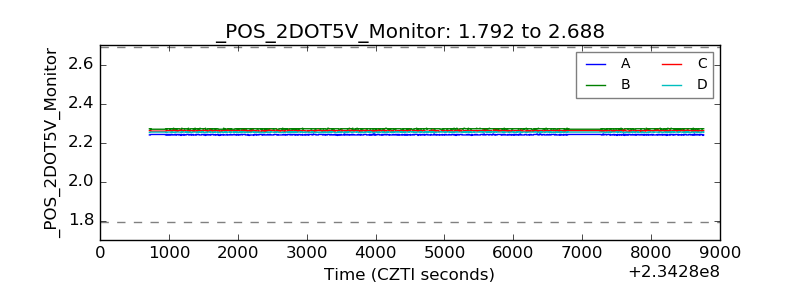 |
| +5 Volts monitor |  |
| _ROLL_ROT | 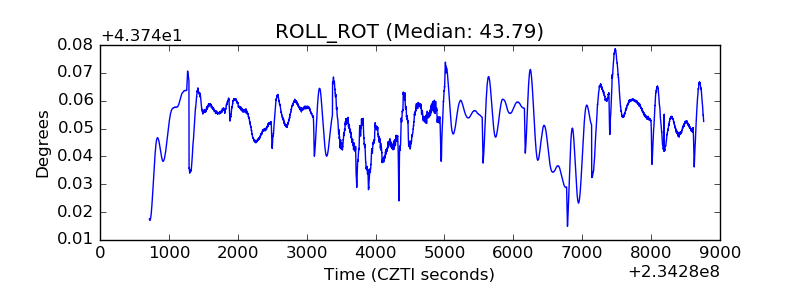 |
| _Roll_DEC | 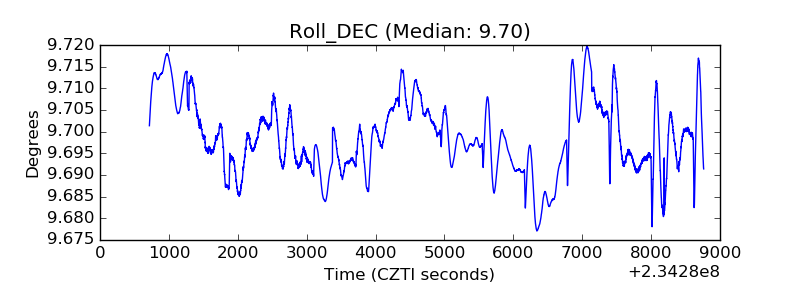 |
| _Roll_RA | 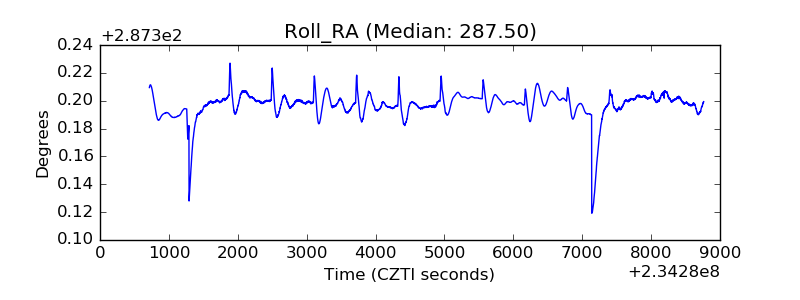 |
| Veto Counter | 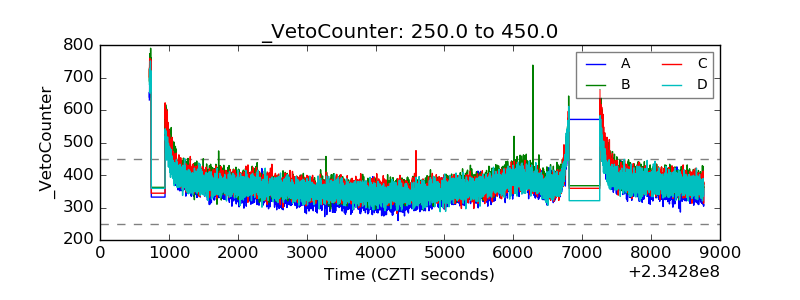 |