| Param | Original file | Final file |
|---|---|---|
| Filename | modeM0/AS1A03_105T01_9000001268_09112cztM0_level2.evt | modeM0/AS1A03_105T01_9000001268_09112cztM0_level2_quad_clean.evt |
| Size (bytes) | 862,485,120 | 161,501,760 |
| Size | 822.5 MB | 154.0 MB |
| Events in quadrant A | 6,892,923 | 1,008,107 |
| Events in quadrant B | 6,222,129 | 1,012,815 |
| Events in quadrant C | 5,870,665 | 991,898 |
| Events in quadrant D | 6,248,542 | 974,639 |
| Mode M0 | |||
|---|---|---|---|
| Quadrant | BADHDUFLAG | Total packets | Discarded packets |
| A | 0 | 28702 | 88 |
| B | 0 | 27111 | 76 |
| C | 0 | 26593 | 70 |
| D | 0 | 27880 | 140 |
| Mode SS | |||
|---|---|---|---|
| Quadrant | BADHDUFLAG | Total packets | Discarded packets |
| A | 0 | 268 | 0 |
| B | 0 | 268 | 0 |
| C | 0 | 268 | 2 |
| D | 0 | 268 | 0 |
| Mode M9 | |||
|---|---|---|---|
| Quadrant | BADHDUFLAG | Total packets | Discarded packets |
| A | 0 | 19 | 0 |
| B | 0 | 19 | 0 |
| C | 0 | 19 | 0 |
| D | 0 | 19 | 0 |
| Quadrant | Total seconds | Saturated seconds | Saturation percentage |
|---|---|---|---|
| A | 13087 | 75 | 0.573088% |
| B | 13087 | 111 | 0.848170% |
| C | 13089 | 66 | 0.504240% |
| D | 13068 | 102 | 0.780533% |
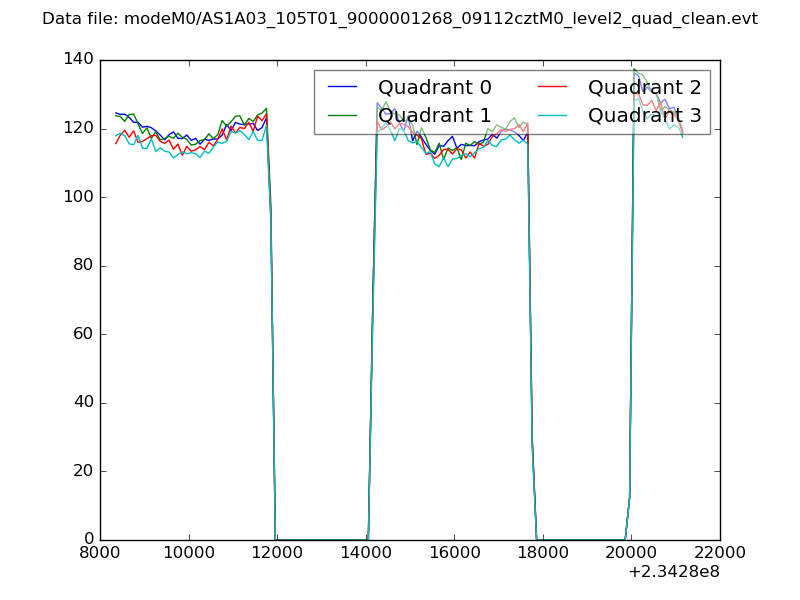
Noise dominated data is calculated using 1-second bins in cleaned event files. If a bin has >2000 counts, and if more than 50% of those come from <1% of pixels, then it is considered to be noise-dominated and hence unusable.
| Quadrant | # 1 sec bins | Bins with >0 counts | Bins with >2000 counts | High rate bins dominated by noise | Noise dominated (total time) | Noise dominated (detector-on time) | Marked lightcurve |
|---|---|---|---|---|---|---|---|
| A | 14992 | 13123 | 3 | 3 | 0.02% | 0.02% | 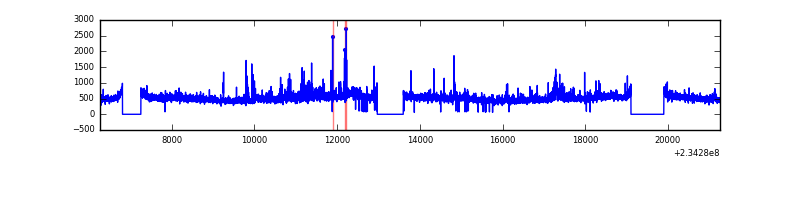 |
| B | 14992 | 13121 | 9 | 9 | 0.06% | 0.07% | 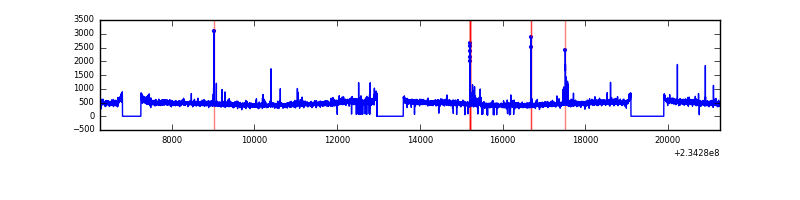 |
| C | 14992 | 13122 | 0 | 0 | 0.00% | 0.00% |  |
| D | 14992 | 13122 | 42 | 42 | 0.28% | 0.32% | 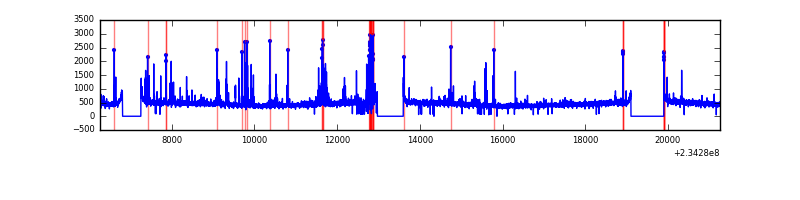 |
Top three noisy pixels from each quadrant. If the there are fewer than three noisy pixels in the level2.evt file, extra rows are filled as -1
| Pixel properties | Quadrant properties | ||||||
|---|---|---|---|---|---|---|---|
| Quadrant | DetID | PixID | Counts | Sigma | Mean | Median | Sigma |
| A | 8 | 5 | 692805 | 2194.12 | 1551 | 1517 | 315.1 |
| A | 1 | 162 | 103799 | 324.64 | 1551 | 1517 | 315.1 |
| A | 15 | 174 | 75950 | 236.25 | 1551 | 1517 | 315.1 |
| B | 0 | 214 | 80471 | 263.48 | 1556 | 1519 | 299.7 |
| B | 0 | 229 | 60062 | 195.37 | 1556 | 1519 | 299.7 |
| B | 12 | 111 | 34000 | 108.4 | 1556 | 1519 | 299.7 |
| C | 13 | 61 | 11034 | 27.4 | 1501 | 1506 | 347.7 |
| C | 1 | 3 | 6388 | 14.04 | 1501 | 1506 | 347.7 |
| C | 9 | 68 | 4975 | 9.98 | 1501 | 1506 | 347.7 |
| D | 1 | 52 | 252395 | 657.04 | 1496 | 1457 | 381.9 |
| D | 2 | 14 | 113292 | 292.82 | 1496 | 1457 | 381.9 |
| D | 7 | 71 | 46943 | 119.1 | 1496 | 1457 | 381.9 |
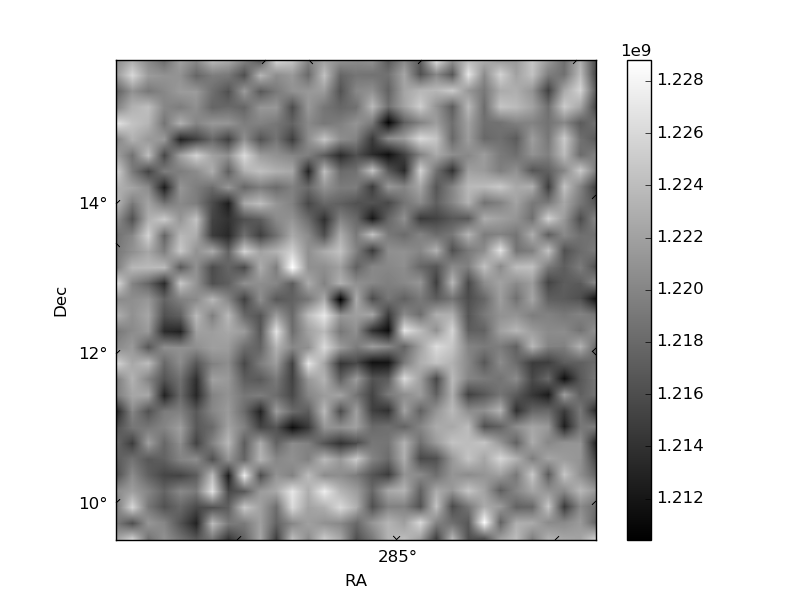
Histogram calculated using DETX and DETY for each event in the final _common_clean file
| Quadrant A | 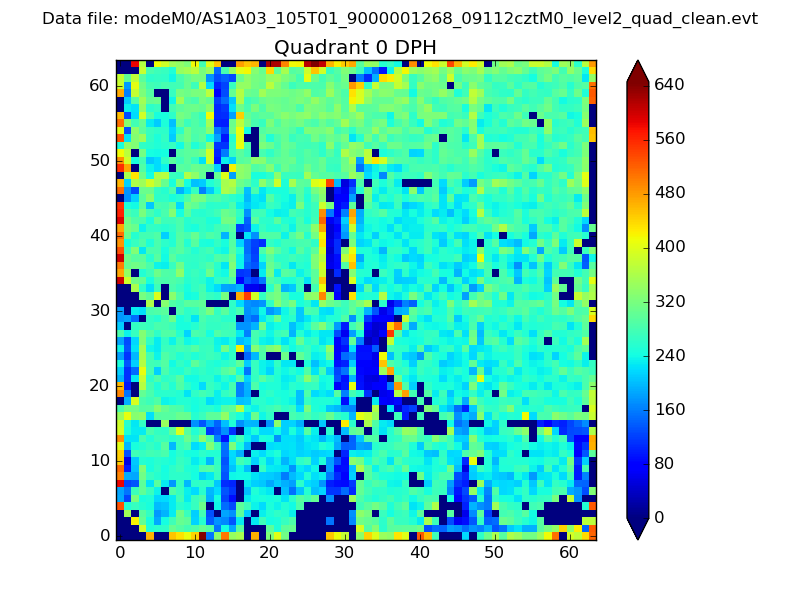 |
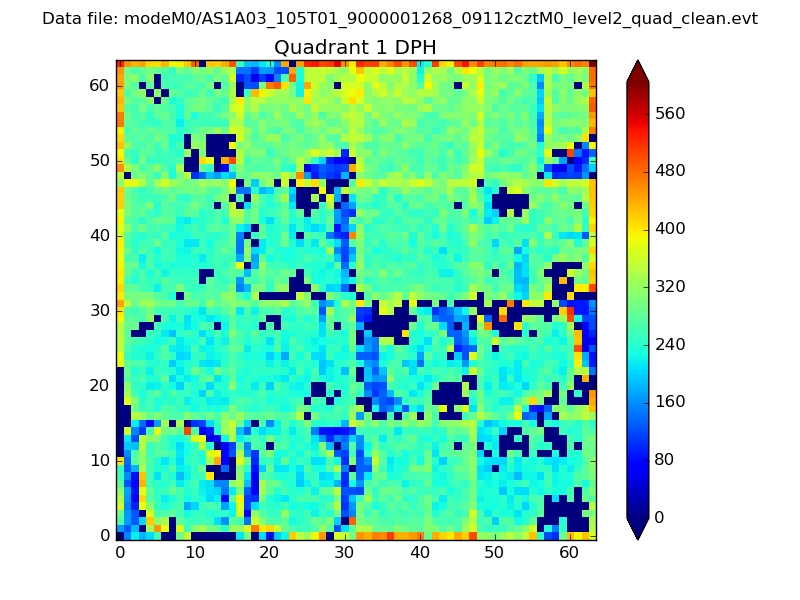 |
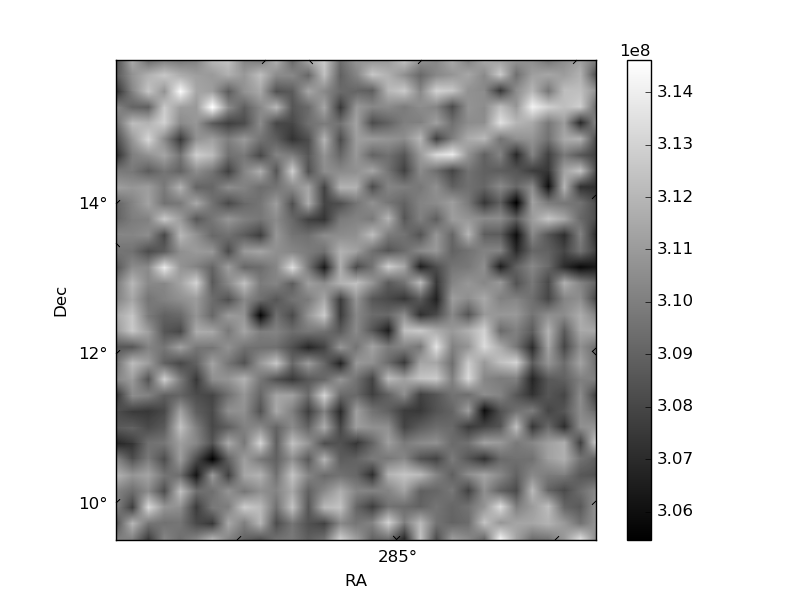
Quadrant B |
|---|---|---|---|
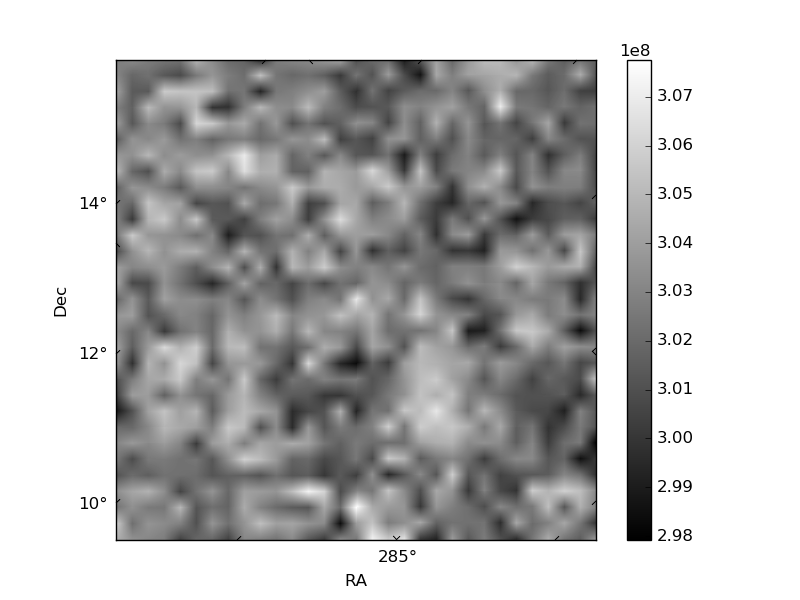
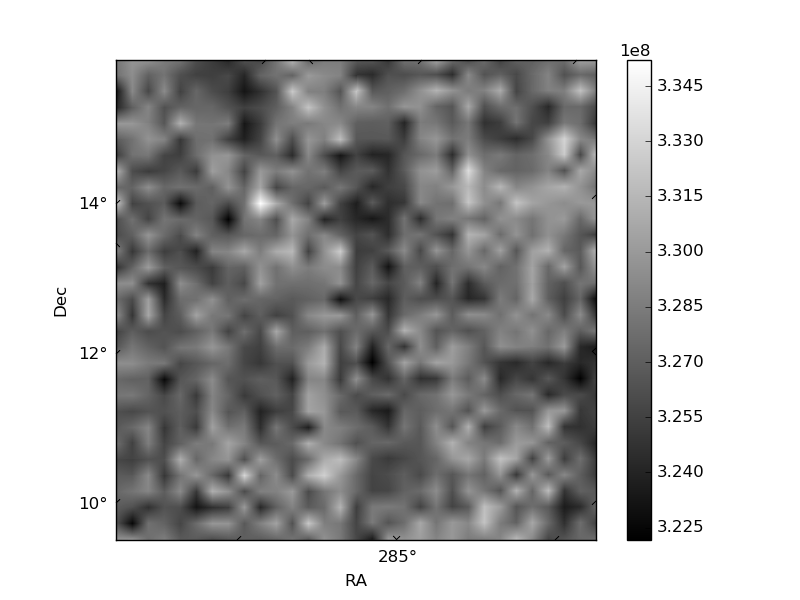
| Quadrant D | 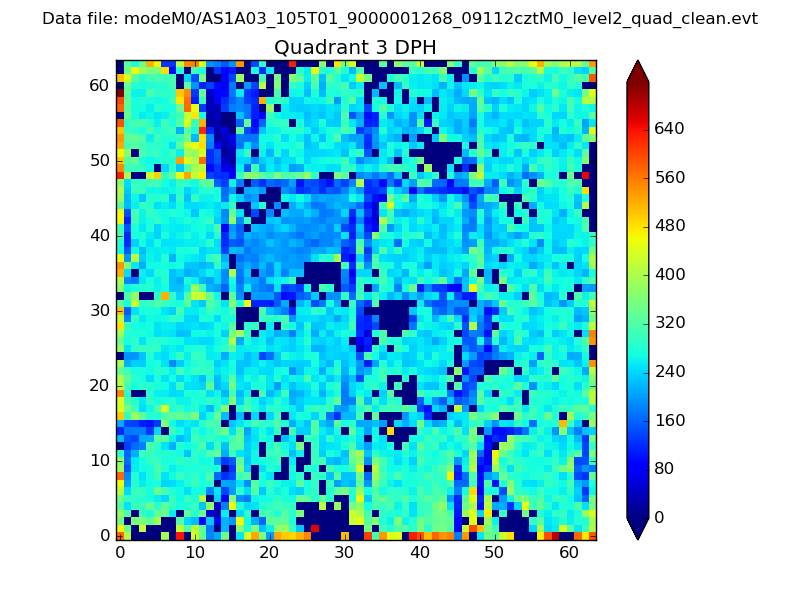 |
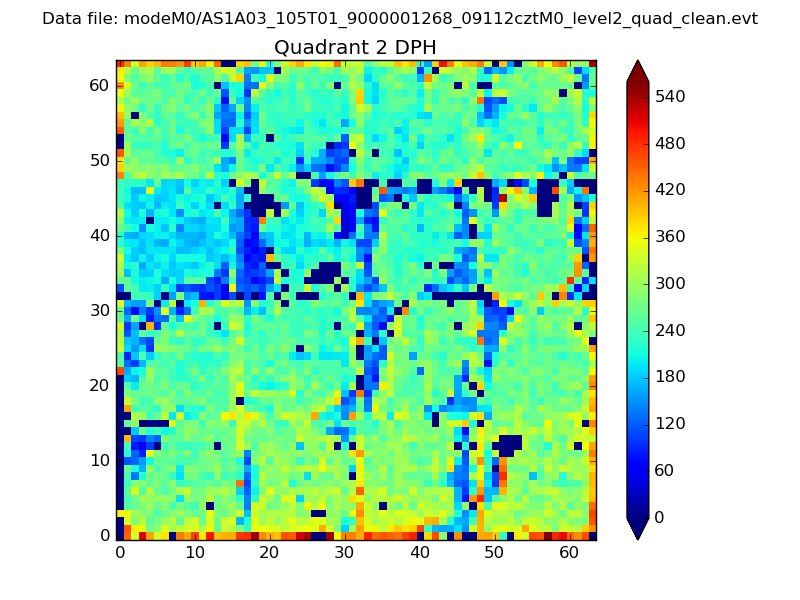 |
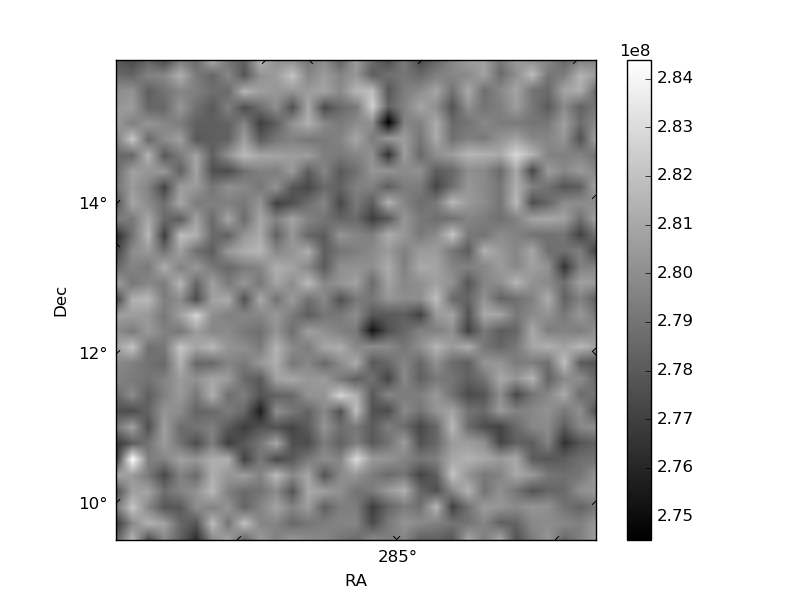
Quadrant C |
| Plot type | Count rate plots | Images |
|---|---|---|
| Comparison with Poisson distribution Blue bars denote a histogram of data divided into 1 sec bins. Red curve is a Poisson curve with rate = median count rate of data. |
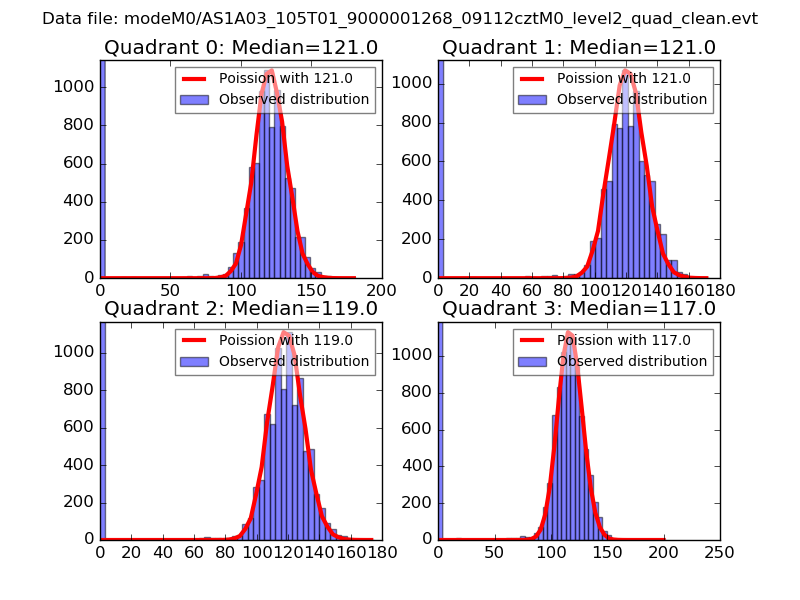 |
 |
| Quadrant-wise count rates Data is divided into 100 sec bins |
 |
|
| Module-wise count rates for Quadrant A Data is divided into 100 sec bins |
 |
 |
| Module-wise count rates for Quadrant B Data is divided into 100 sec bins |
 |
 |
| Module-wise count rates for Quadrant C Data is divided into 100 sec bins |
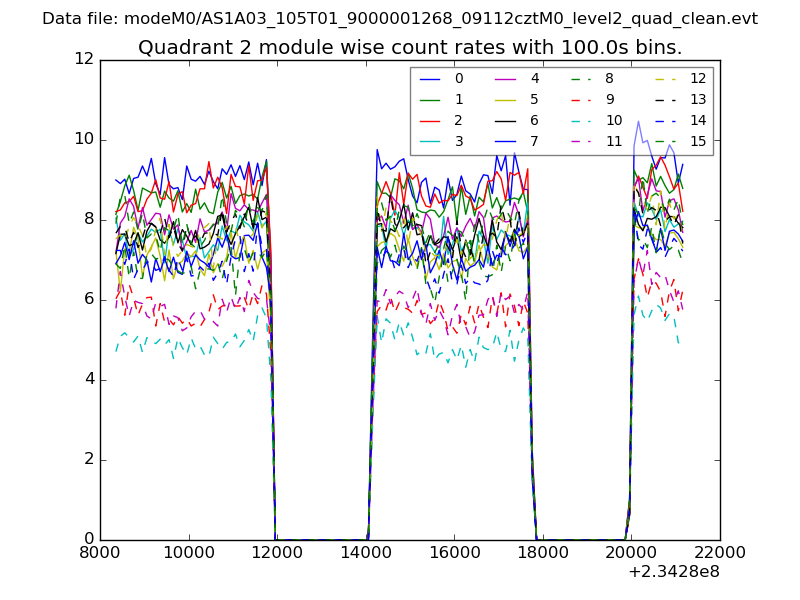 |
 |
| Module-wise count rates for Quadrant D Data is divided into 100 sec bins |
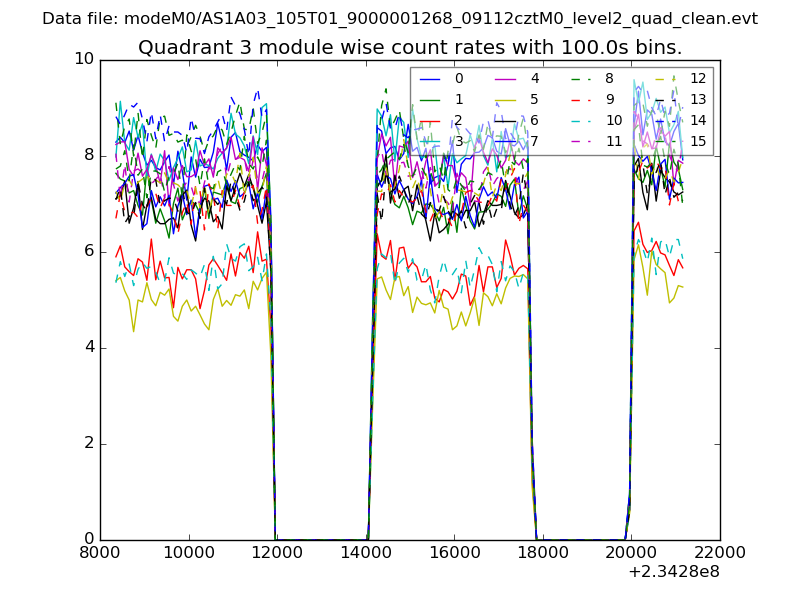 |
 |
| Parameter | Plot |
|---|---|
| CZT HV Monitor | 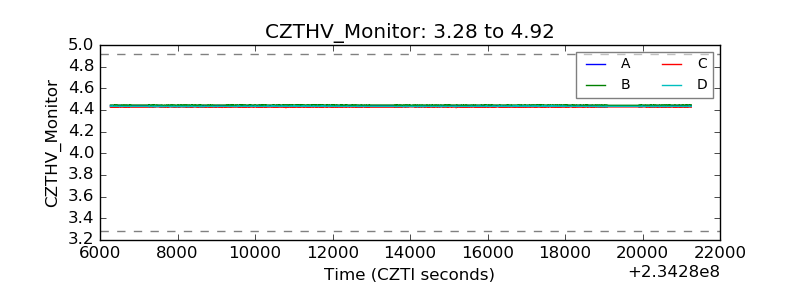 |
| D_VDD | 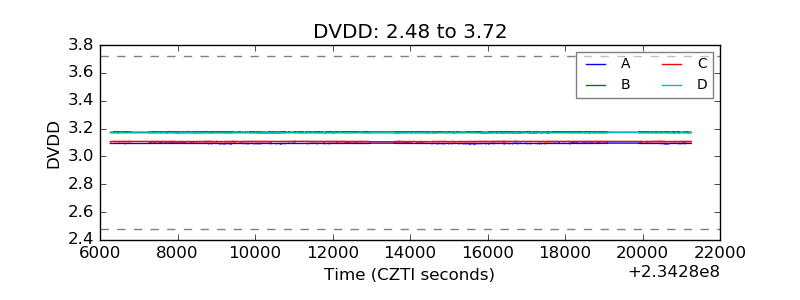 |
| Temperature 1 | 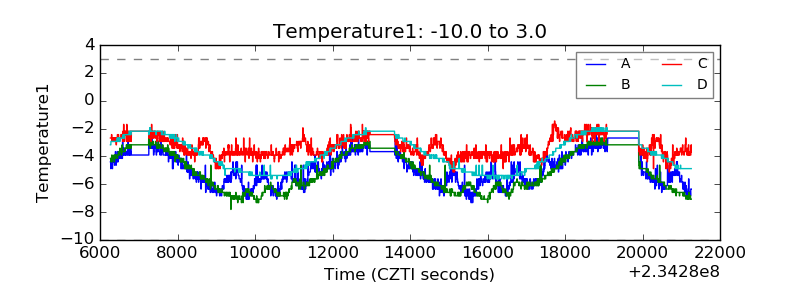 |
| Veto HV Monitor | 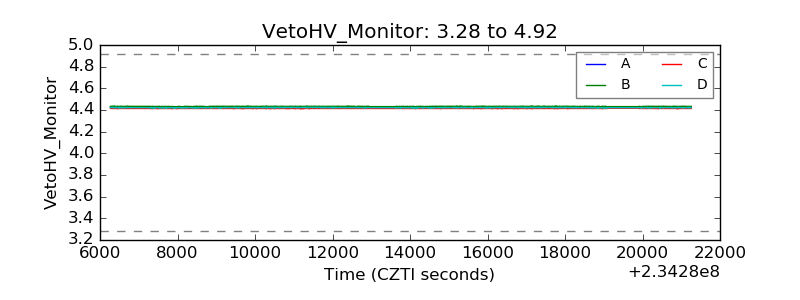 |
| Veto LLD | 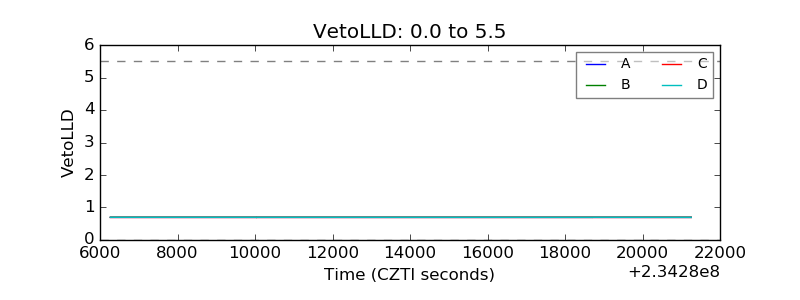 |
| Alpha Counter | 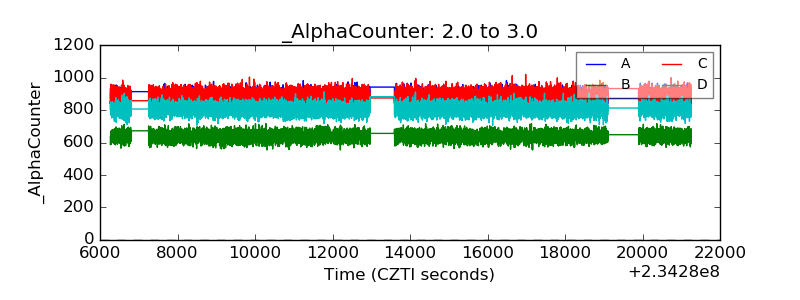 |
| _CPM_Rate | 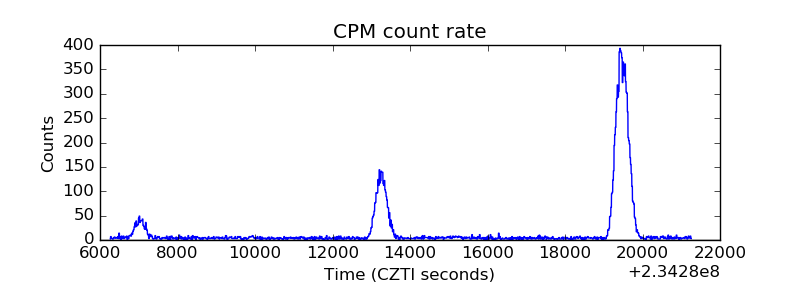 |
| CZT Counter | 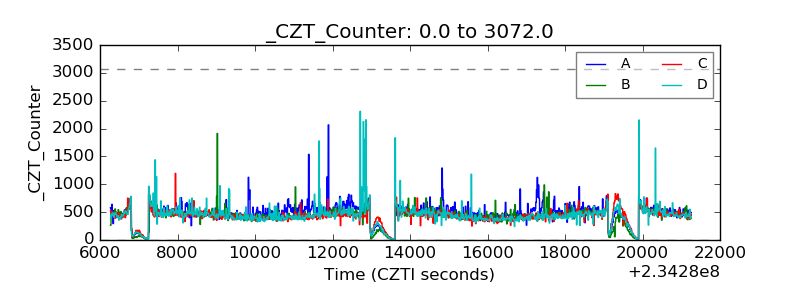 |
| +2.5 Volts monitor |  |
| +5 Volts monitor |  |
| _ROLL_ROT | 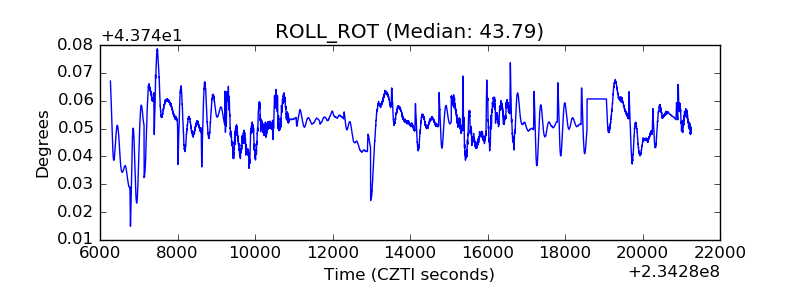 |
| _Roll_DEC | 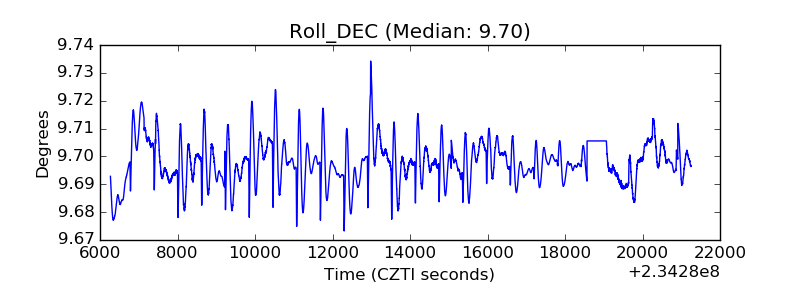 |
| _Roll_RA | 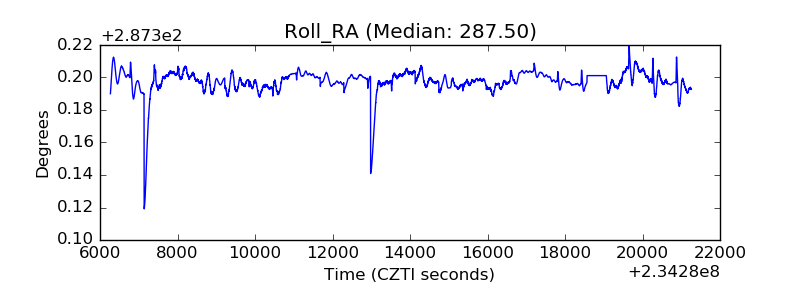 |
| Veto Counter | 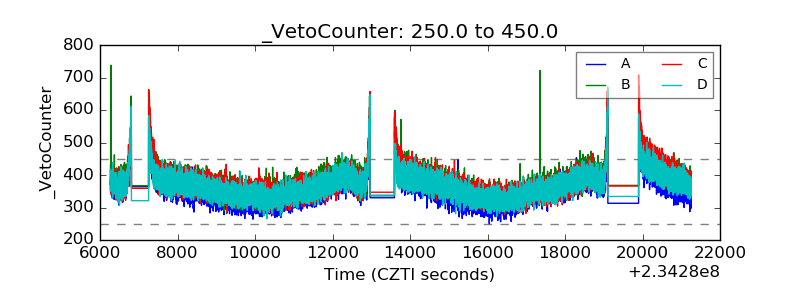 |