| Param | Original file | Final file |
|---|---|---|
| Filename | modeM0/AS1A03_105T01_9000001268_09113cztM0_level2.evt | modeM0/AS1A03_105T01_9000001268_09113cztM0_level2_quad_clean.evt |
| Size (bytes) | 438,094,080 | 95,232,960 |
| Size | 417.8 MB | 90.8 MB |
| Events in quadrant A | 3,441,096 | 610,145 |
| Events in quadrant B | 3,232,472 | 615,063 |
| Events in quadrant C | 3,033,340 | 605,961 |
| Events in quadrant D | 3,108,501 | 589,230 |
| Mode M0 | |||
|---|---|---|---|
| Quadrant | BADHDUFLAG | Total packets | Discarded packets |
| A | 0 | 14652 | 100 |
| B | 0 | 14080 | 96 |
| C | 0 | 13660 | 99 |
| D | 0 | 14035 | 102 |
| Mode SS | |||
|---|---|---|---|
| Quadrant | BADHDUFLAG | Total packets | Discarded packets |
| A | 0 | 136 | 0 |
| B | 0 | 136 | 0 |
| C | 0 | 136 | 0 |
| D | 0 | 136 | 0 |
| Mode M9 | |||
|---|---|---|---|
| Quadrant | BADHDUFLAG | Total packets | Discarded packets |
| A | 0 | 10 | 0 |
| B | 0 | 10 | 0 |
| C | 0 | 10 | 0 |
| D | 0 | 11 | 0 |
| Quadrant | Total seconds | Saturated seconds | Saturation percentage |
|---|---|---|---|
| A | 6648 | 25 | 0.376053% |
| B | 6648 | 49 | 0.737064% |
| C | 6646 | 22 | 0.331026% |
| D | 6646 | 41 | 0.616912% |
Noise dominated data is calculated using 1-second bins in cleaned event files. If a bin has >2000 counts, and if more than 50% of those come from <1% of pixels, then it is considered to be noise-dominated and hence unusable.
| Quadrant | # 1 sec bins | Bins with >0 counts | Bins with >2000 counts | High rate bins dominated by noise | Noise dominated (total time) | Noise dominated (detector-on time) | Marked lightcurve |
|---|---|---|---|---|---|---|---|
| A | 7630 | 6694 | 2 | 2 | 0.03% | 0.03% | 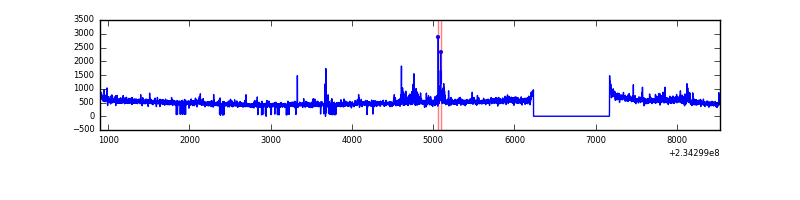 |
| B | 7630 | 6694 | 8 | 8 | 0.10% | 0.12% | 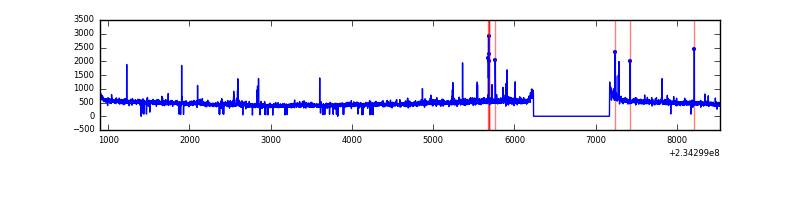 |
| C | 7630 | 6691 | 0 | 0 | 0.00% | 0.00% | 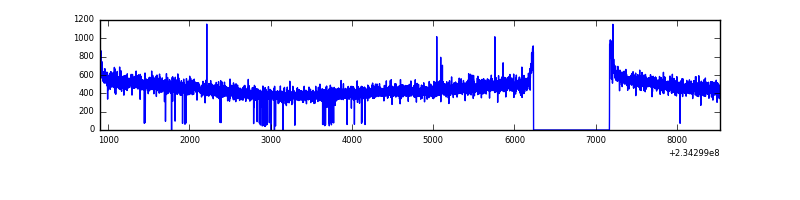 |
| D | 7630 | 6695 | 13 | 13 | 0.17% | 0.19% | 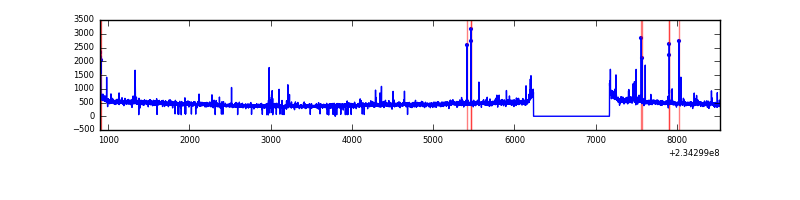 |
Top three noisy pixels from each quadrant. If the there are fewer than three noisy pixels in the level2.evt file, extra rows are filled as -1
| Pixel properties | Quadrant properties | ||||||
|---|---|---|---|---|---|---|---|
| Quadrant | DetID | PixID | Counts | Sigma | Mean | Median | Sigma |
| A | 8 | 5 | 293053 | 1802.66 | 795 | 778 | 162.1 |
| A | 1 | 162 | 51978 | 315.79 | 795 | 778 | 162.1 |
| A | 15 | 174 | 18014 | 106.31 | 795 | 778 | 162.1 |
| B | 0 | 214 | 115911 | 751.69 | 796 | 776 | 153.2 |
| B | 12 | 111 | 17604 | 109.87 | 796 | 776 | 153.2 |
| B | 11 | 111 | 14076 | 86.83 | 796 | 776 | 153.2 |
| C | 13 | 61 | 5813 | 27.77 | 776 | 780 | 181.2 |
| C | 14 | 67 | 3497 | 14.99 | 776 | 780 | 181.2 |
| C | 1 | 3 | 2321 | 8.5 | 776 | 780 | 181.2 |
| D | 1 | 52 | 103541 | 516.86 | 768 | 746 | 198.9 |
| D | 2 | 14 | 36263 | 178.58 | 768 | 746 | 198.9 |
| D | 2 | 234 | 21074 | 102.21 | 768 | 746 | 198.9 |
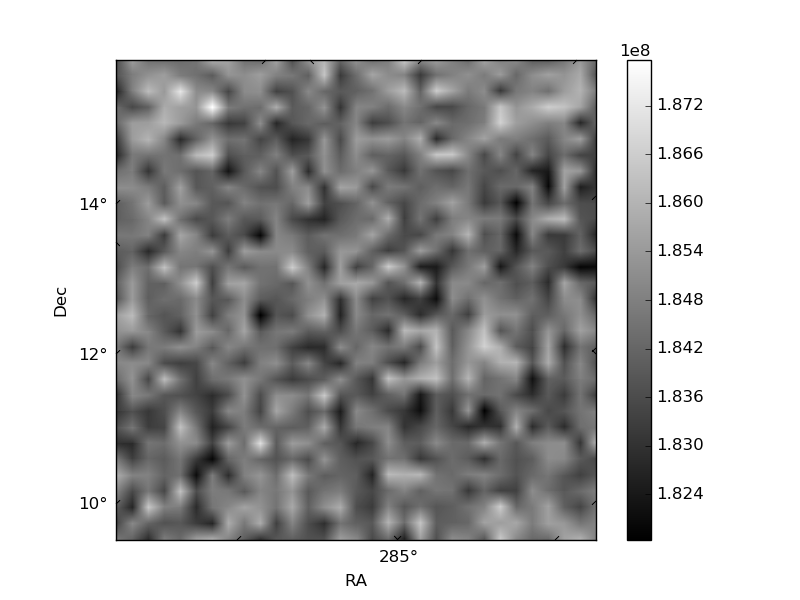
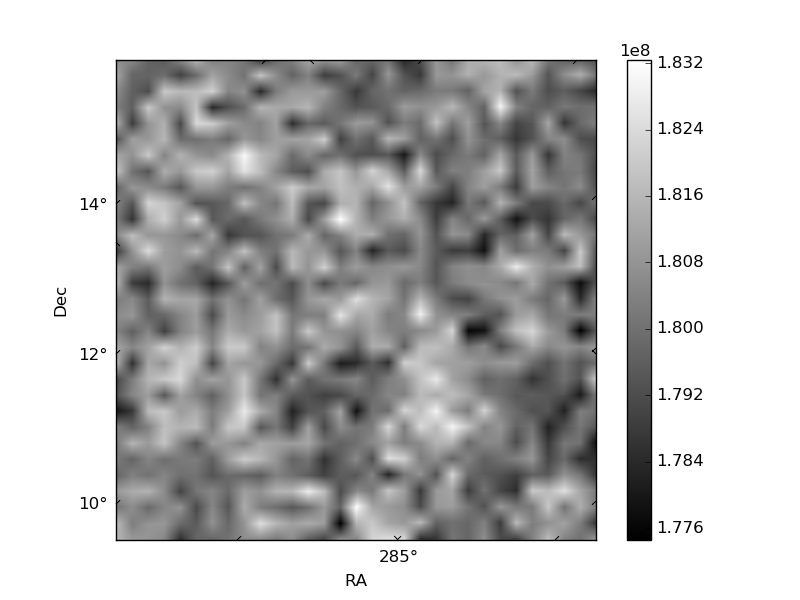
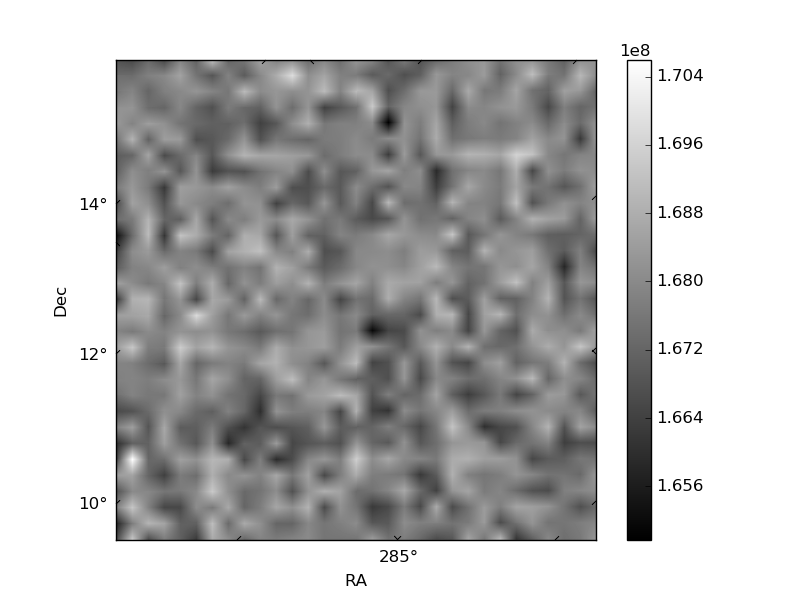
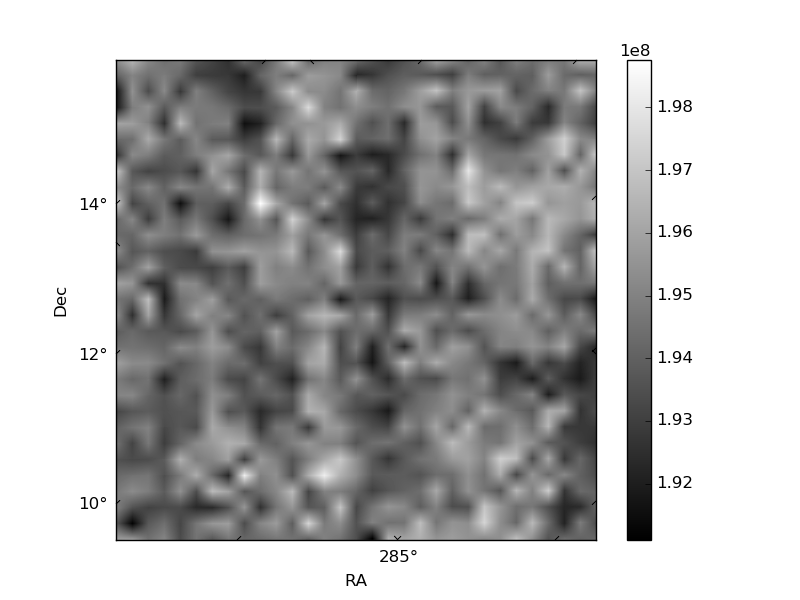
Histogram calculated using DETX and DETY for each event in the final _common_clean file
| Quadrant A | 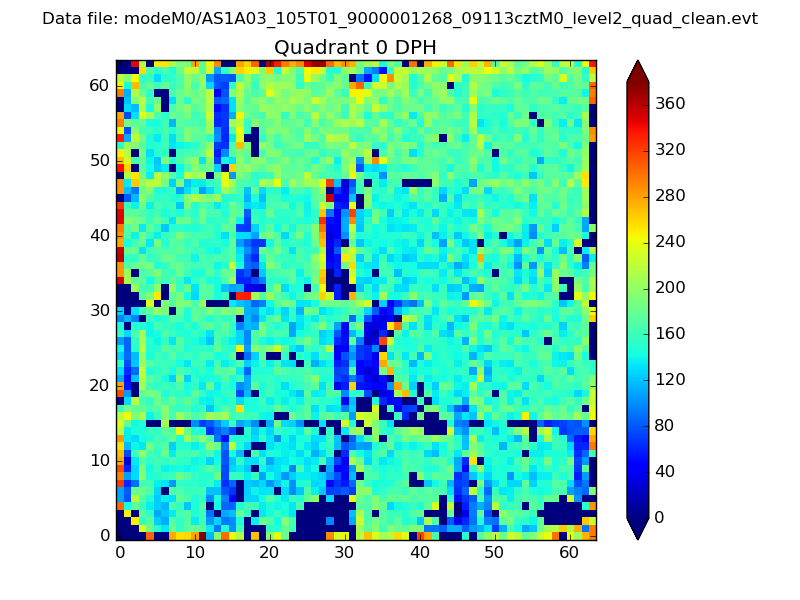 |
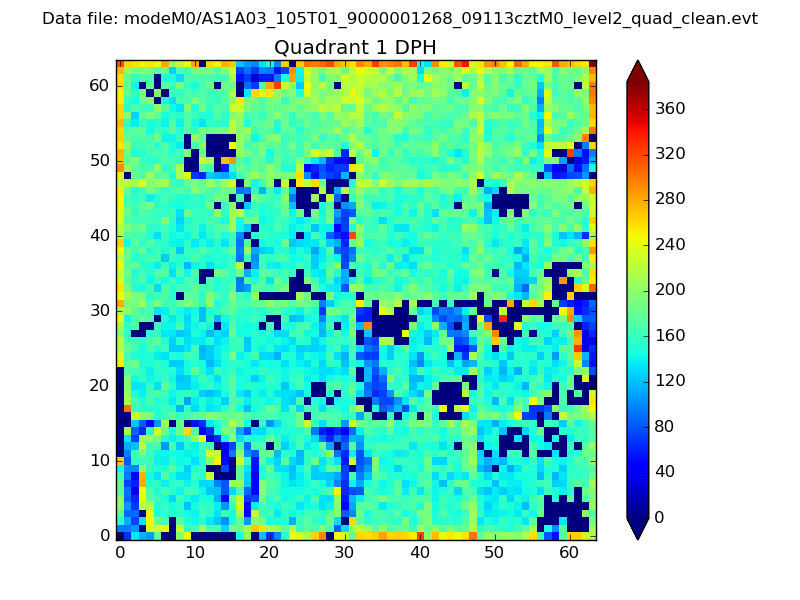 |
Quadrant B |
|---|---|---|---|
| Quadrant D | 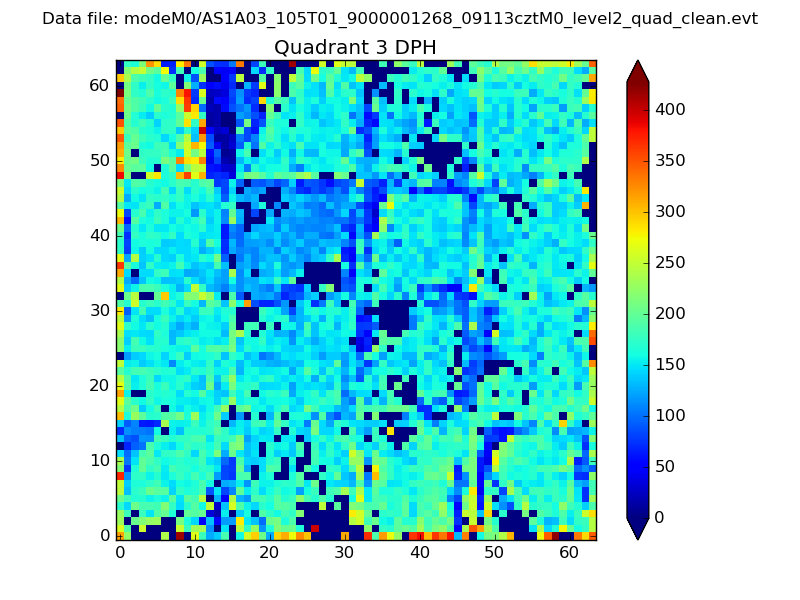 |
 |
Quadrant C |
| Plot type | Count rate plots | Images |
|---|---|---|
| Comparison with Poisson distribution Blue bars denote a histogram of data divided into 1 sec bins. Red curve is a Poisson curve with rate = median count rate of data. |
 |
 |
| Quadrant-wise count rates Data is divided into 100 sec bins |
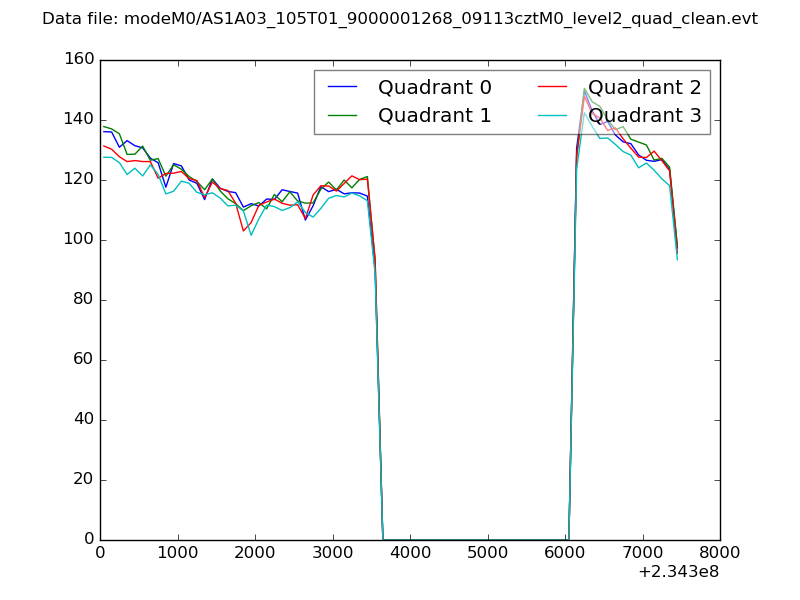 |
|
| Module-wise count rates for Quadrant A Data is divided into 100 sec bins |
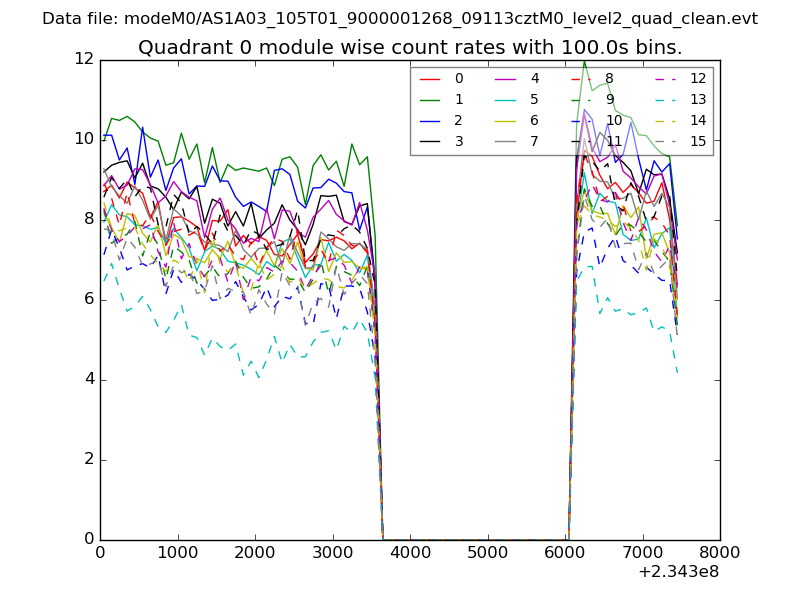 |
 |
| Module-wise count rates for Quadrant B Data is divided into 100 sec bins |
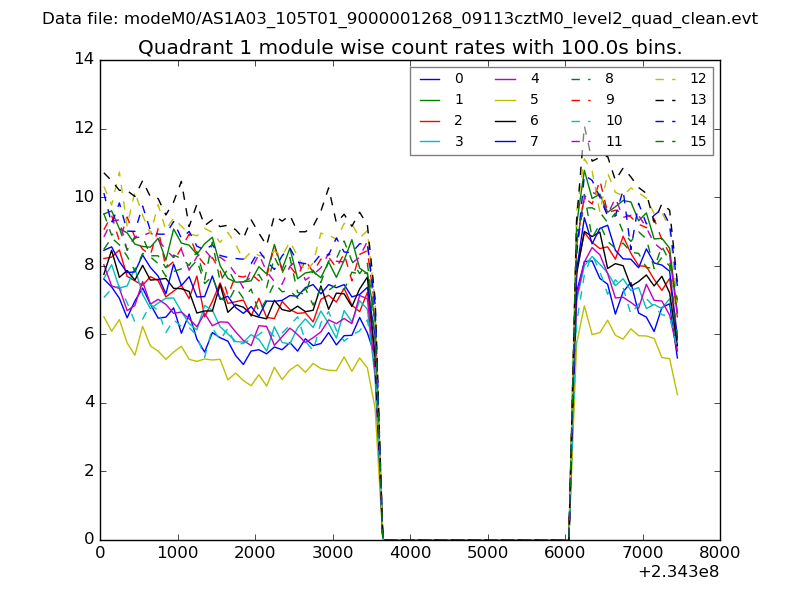 |
 |
| Module-wise count rates for Quadrant C Data is divided into 100 sec bins |
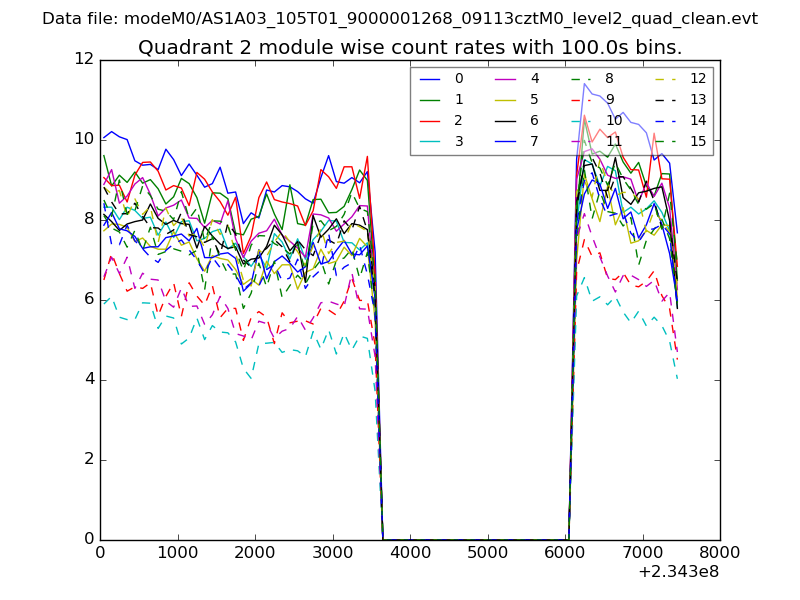 |
 |
| Module-wise count rates for Quadrant D Data is divided into 100 sec bins |
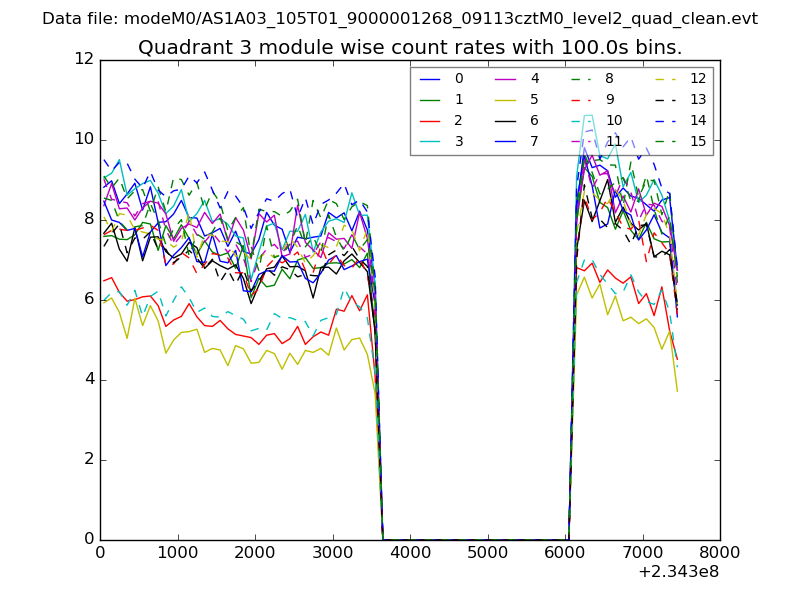 |
 |
| Parameter | Plot |
|---|---|
| CZT HV Monitor | 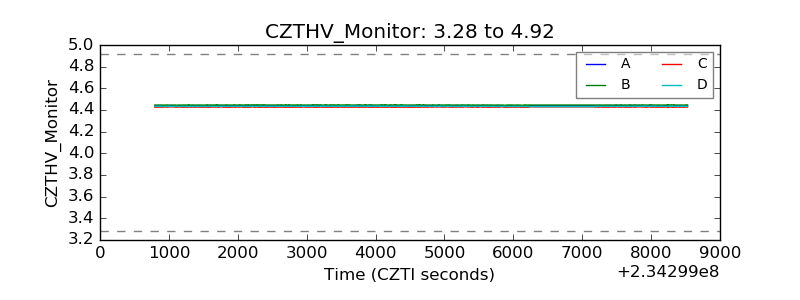 |
| D_VDD | 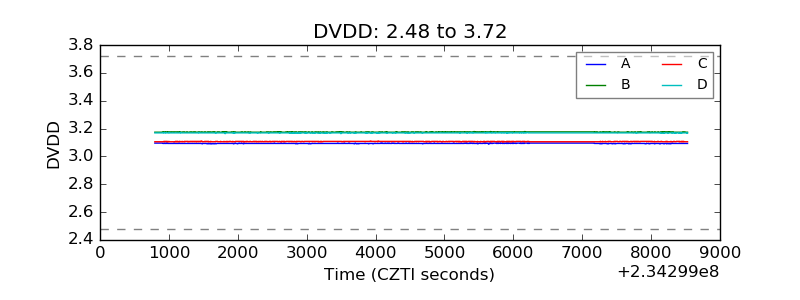 |
| Temperature 1 | 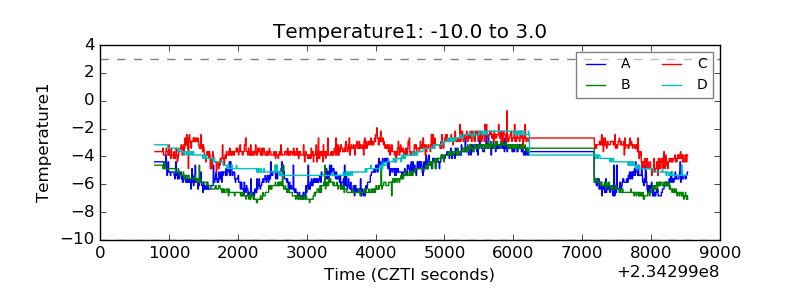 |
| Veto HV Monitor | 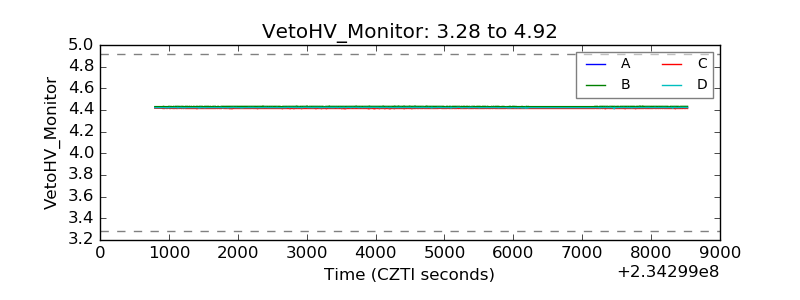 |
| Veto LLD | 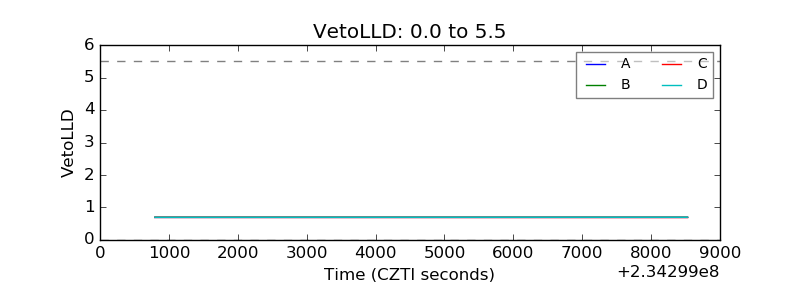 |
| Alpha Counter | 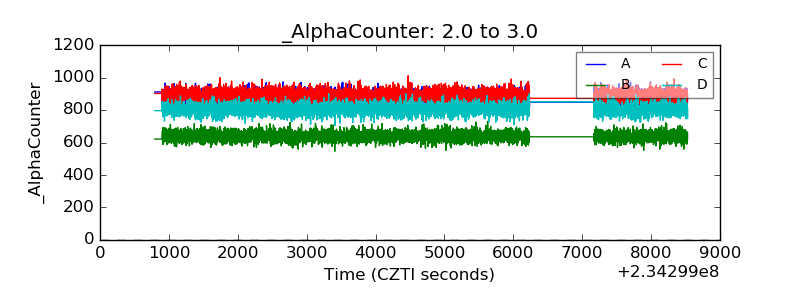 |
| _CPM_Rate | 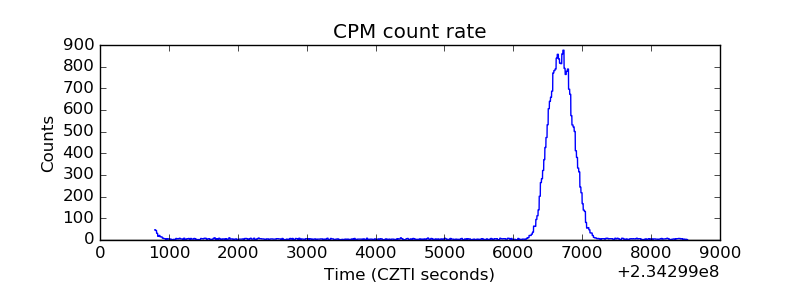 |
| CZT Counter |  |
| +2.5 Volts monitor |  |
| +5 Volts monitor |  |
| _ROLL_ROT | 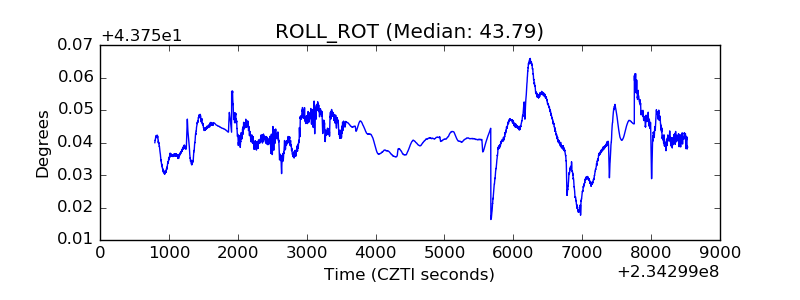 |
| _Roll_DEC | 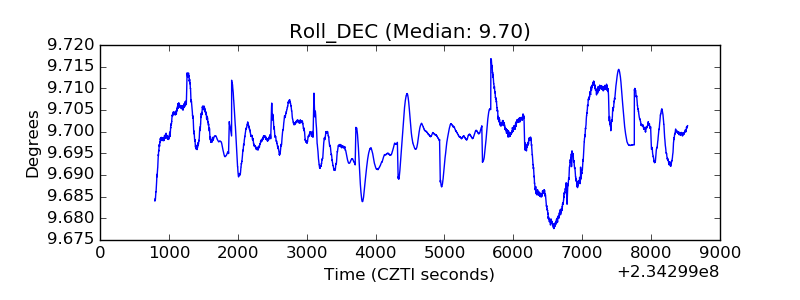 |
| _Roll_RA |  |
| Veto Counter | 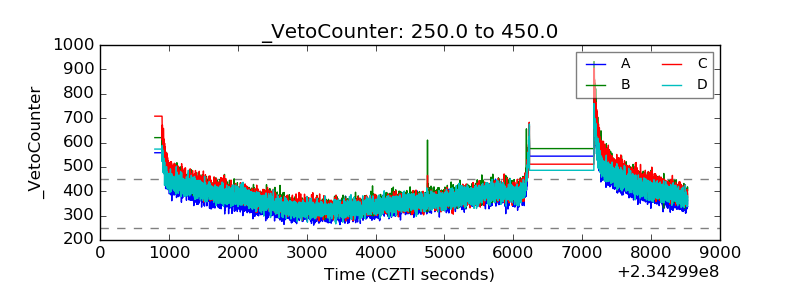 |