| Param | Original file | Final file |
|---|---|---|
| Filename | modeM0/AS1A03_105T01_9000001268_09114cztM0_level2.evt | modeM0/AS1A03_105T01_9000001268_09114cztM0_level2_quad_clean.evt |
| Size (bytes) | 444,081,600 | 92,396,160 |
| Size | 423.5 MB | 88.1 MB |
| Events in quadrant A | 3,688,927 | 588,797 |
| Events in quadrant B | 3,111,104 | 599,626 |
| Events in quadrant C | 3,079,175 | 588,116 |
| Events in quadrant D | 3,130,728 | 570,951 |
| Mode M0 | |||
|---|---|---|---|
| Quadrant | BADHDUFLAG | Total packets | Discarded packets |
| A | 0 | 15353 | 3 |
| B | 0 | 13496 | 2 |
| C | 0 | 13606 | 2 |
| D | 0 | 13738 | 4 |
| Mode SS | |||
|---|---|---|---|
| Quadrant | BADHDUFLAG | Total packets | Discarded packets |
| A | 0 | 132 | 0 |
| B | 0 | 132 | 0 |
| C | 0 | 132 | 0 |
| D | 0 | 132 | 0 |
| Mode M9 | |||
|---|---|---|---|
| Quadrant | BADHDUFLAG | Total packets | Discarded packets |
| A | 0 | 16 | 0 |
| B | 0 | 16 | 0 |
| C | 0 | 16 | 0 |
| D | 0 | 17 | 0 |
| Quadrant | Total seconds | Saturated seconds | Saturation percentage |
|---|---|---|---|
| A | 6458 | 37 | 0.572933% |
| B | 6458 | 35 | 0.541963% |
| C | 6458 | 54 | 0.836172% |
| D | 6457 | 33 | 0.511073% |
Noise dominated data is calculated using 1-second bins in cleaned event files. If a bin has >2000 counts, and if more than 50% of those come from <1% of pixels, then it is considered to be noise-dominated and hence unusable.
| Quadrant | # 1 sec bins | Bins with >0 counts | Bins with >2000 counts | High rate bins dominated by noise | Noise dominated (total time) | Noise dominated (detector-on time) | Marked lightcurve |
|---|---|---|---|---|---|---|---|
| A | 7573 | 6459 | 4 | 4 | 0.05% | 0.06% | 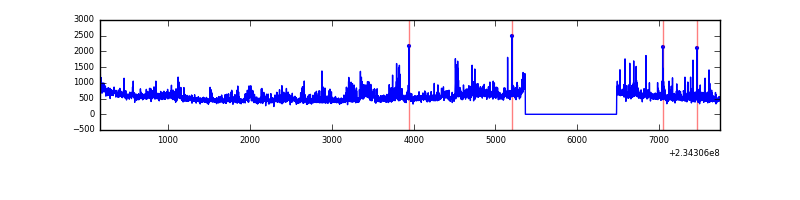 |
| B | 7573 | 6459 | 3 | 3 | 0.04% | 0.05% |  |
| C | 7573 | 6459 | 44 | 44 | 0.58% | 0.68% |  |
| D | 7573 | 6459 | 15 | 15 | 0.20% | 0.23% | 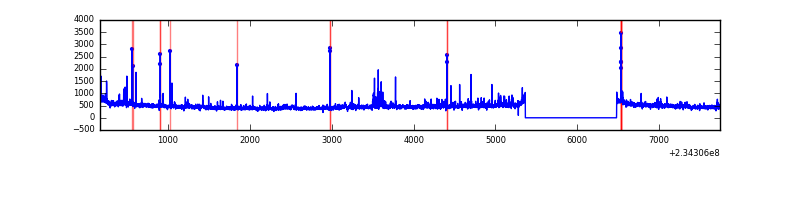 |
Top three noisy pixels from each quadrant. If the there are fewer than three noisy pixels in the level2.evt file, extra rows are filled as -1
| Pixel properties | Quadrant properties | ||||||
|---|---|---|---|---|---|---|---|
| Quadrant | DetID | PixID | Counts | Sigma | Mean | Median | Sigma |
| A | 8 | 5 | 650740 | 4129.27 | 773 | 758 | 157.4 |
| A | 1 | 162 | 42572 | 265.64 | 773 | 758 | 157.4 |
| A | 15 | 174 | 7981 | 45.89 | 773 | 758 | 157.4 |
| B | 0 | 214 | 72862 | 480.1 | 778 | 759 | 150.2 |
| B | 12 | 111 | 16969 | 107.93 | 778 | 759 | 150.2 |
| B | 11 | 111 | 13801 | 86.84 | 778 | 759 | 150.2 |
| C | 14 | 234 | 125628 | 706.22 | 756 | 760 | 176.8 |
| C | 13 | 61 | 5448 | 26.51 | 756 | 760 | 176.8 |
| C | 14 | 67 | 2230 | 8.31 | 756 | 760 | 176.8 |
| D | 1 | 52 | 160752 | 858.5 | 748 | 728 | 186.4 |
| D | 2 | 14 | 48393 | 255.72 | 748 | 728 | 186.4 |
| D | 2 | 234 | 21655 | 112.27 | 748 | 728 | 186.4 |
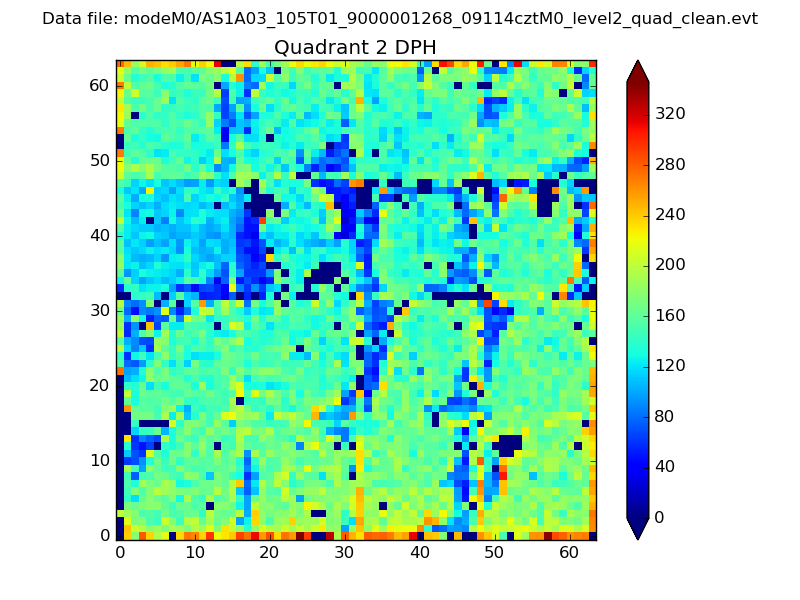
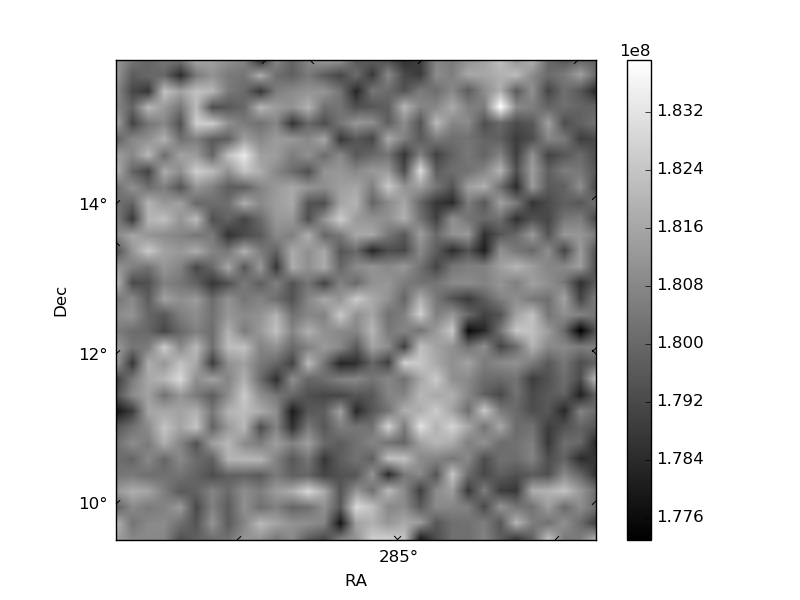
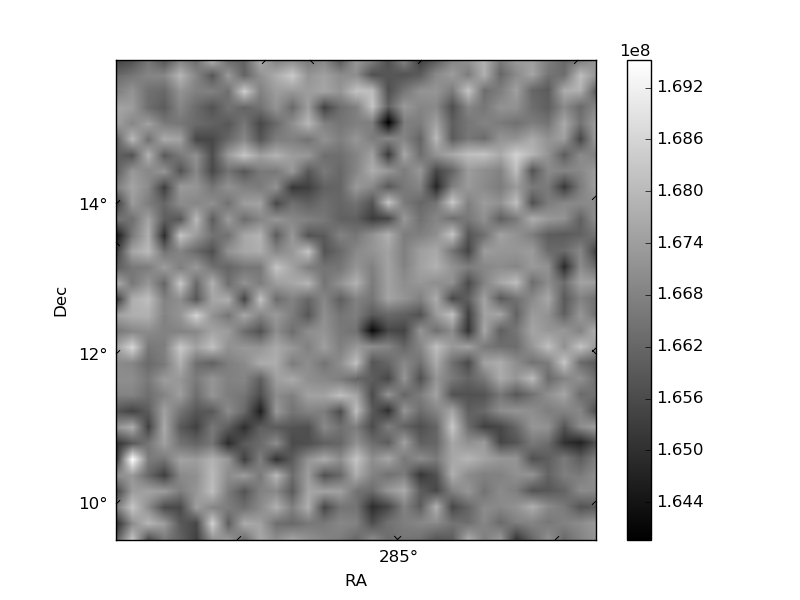
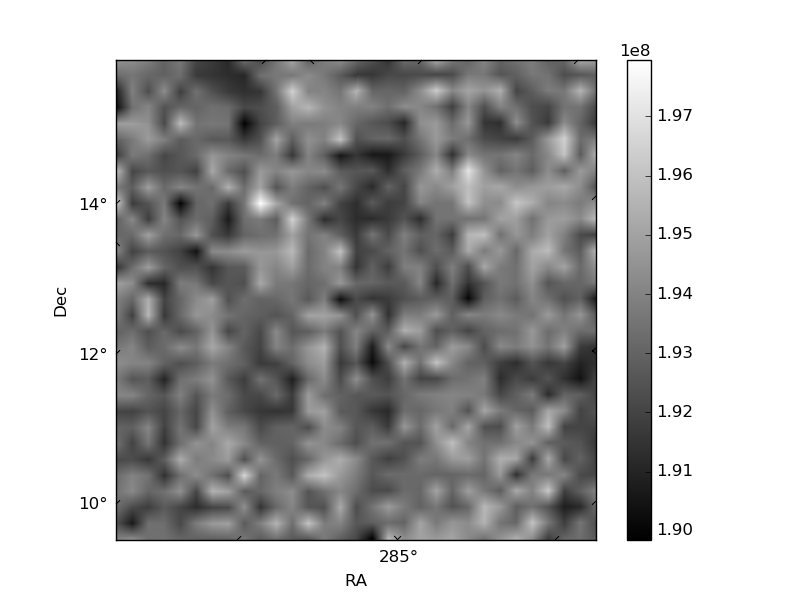
Histogram calculated using DETX and DETY for each event in the final _common_clean file
| Quadrant A | 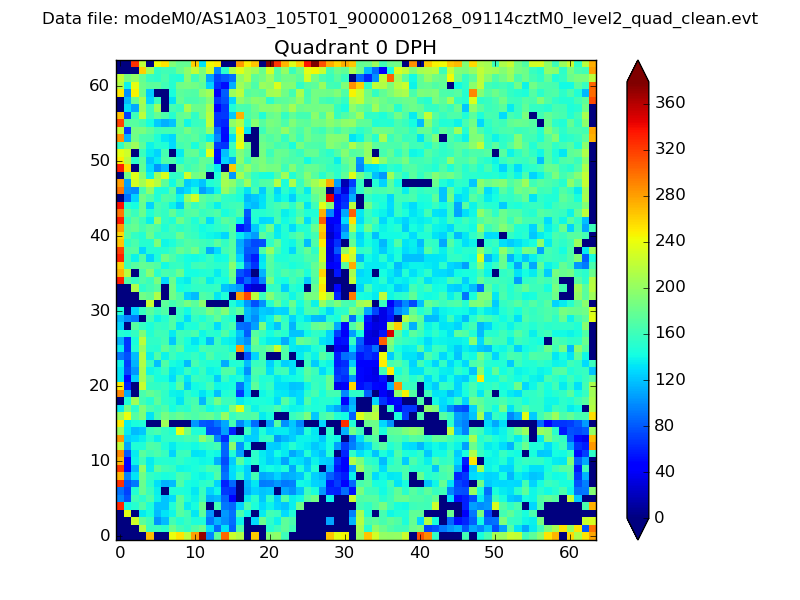 |
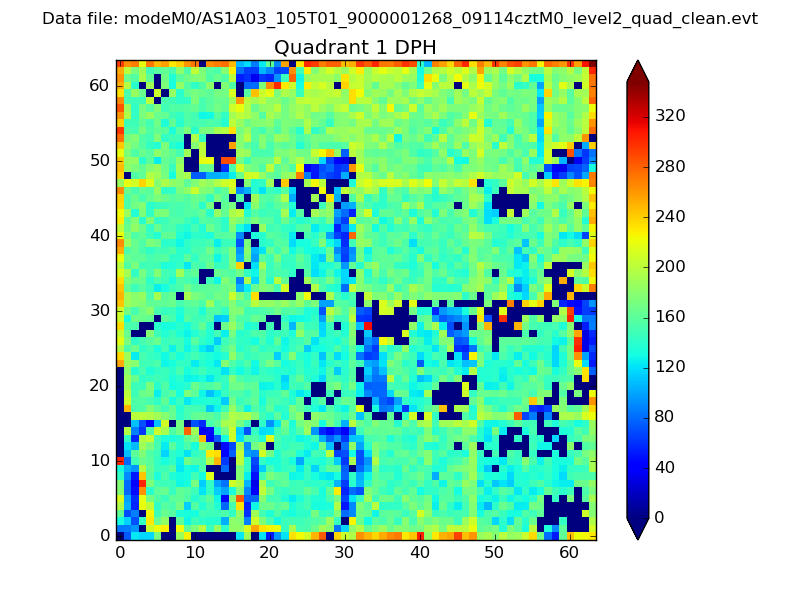 |
Quadrant B |
|---|---|---|---|
| Quadrant D | 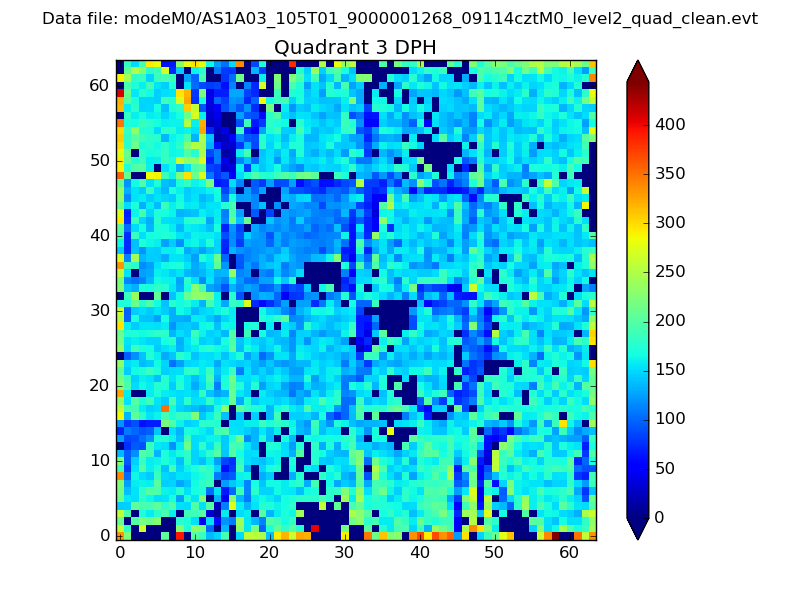 |
 |
Quadrant C |
| Plot type | Count rate plots | Images |
|---|---|---|
| Comparison with Poisson distribution Blue bars denote a histogram of data divided into 1 sec bins. Red curve is a Poisson curve with rate = median count rate of data. |
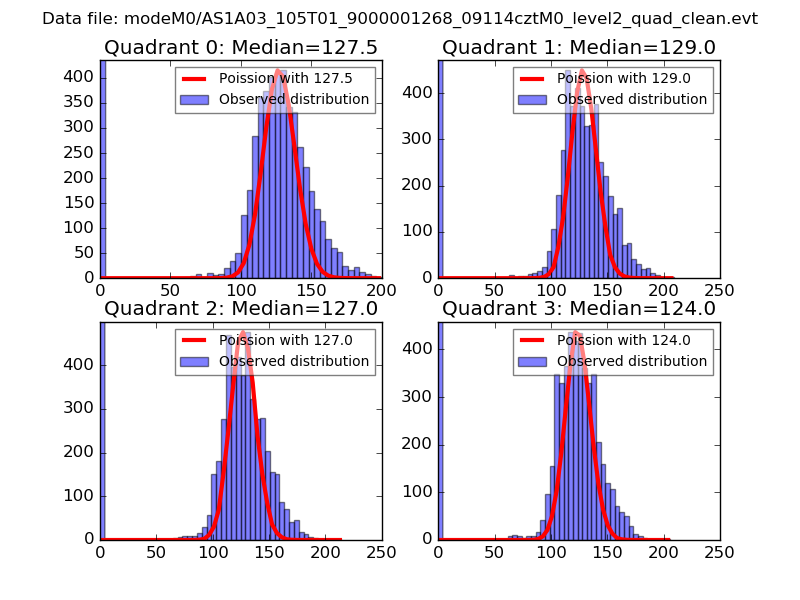 |
 |
| Quadrant-wise count rates Data is divided into 100 sec bins |
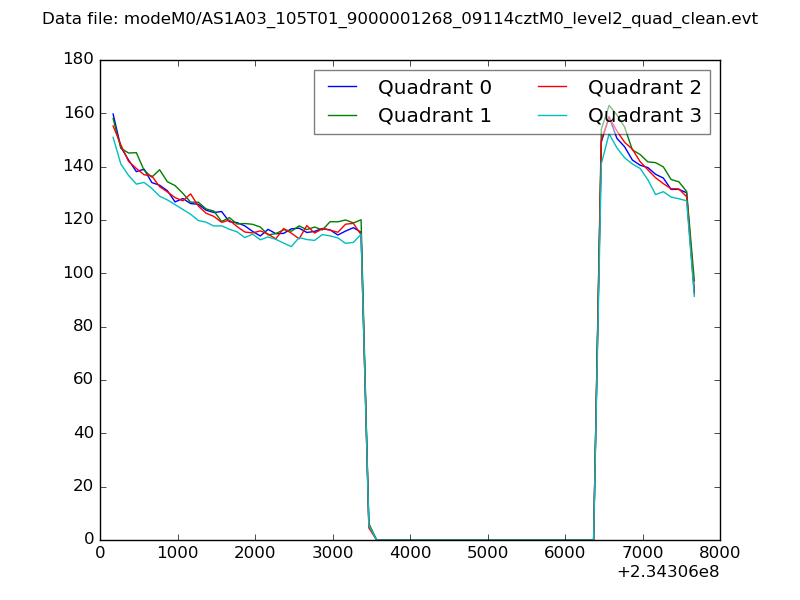 |
|
| Module-wise count rates for Quadrant A Data is divided into 100 sec bins |
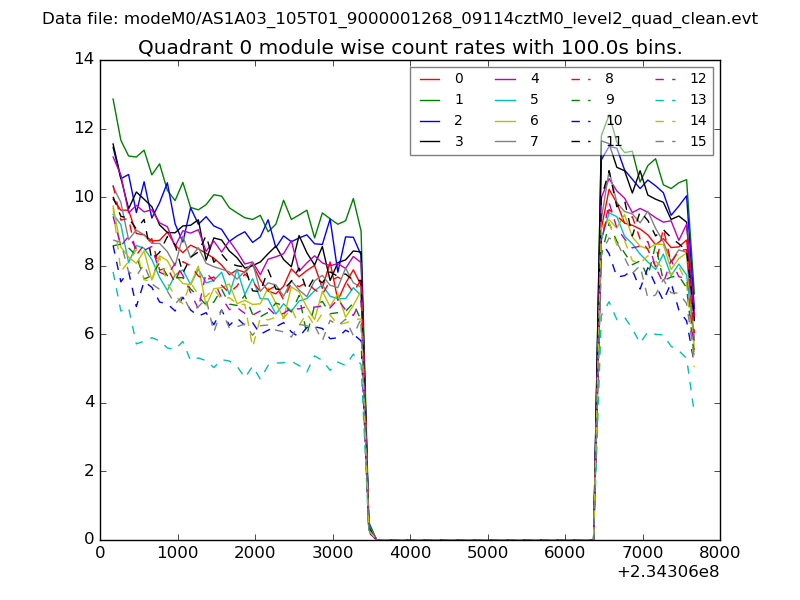 |
 |
| Module-wise count rates for Quadrant B Data is divided into 100 sec bins |
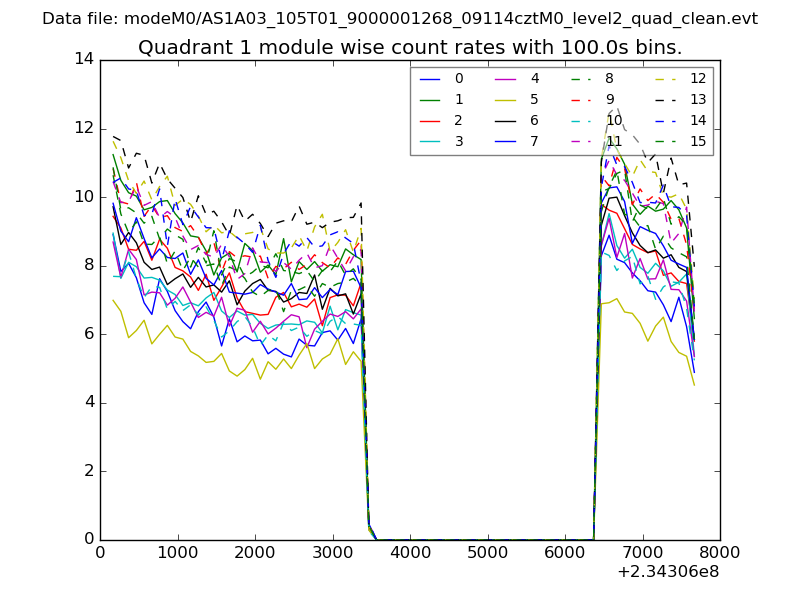 |
 |
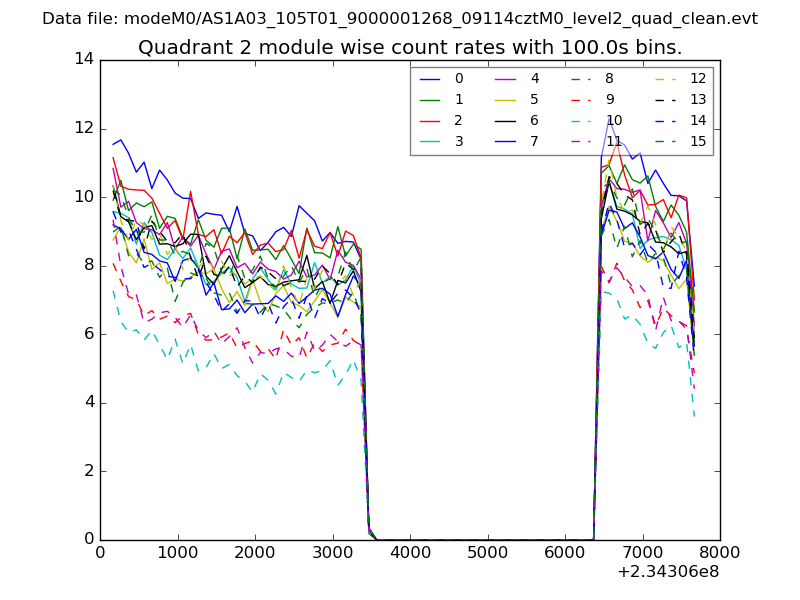
| Module-wise count rates for Quadrant C Data is divided into 100 sec bins |
 |
 |
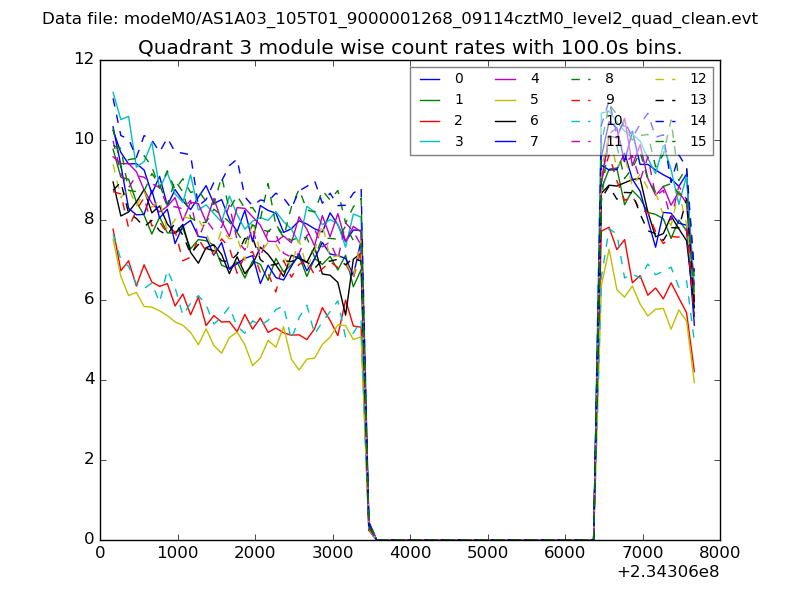
| Module-wise count rates for Quadrant D Data is divided into 100 sec bins |
 |
 |
| Parameter | Plot |
|---|---|
| CZT HV Monitor | 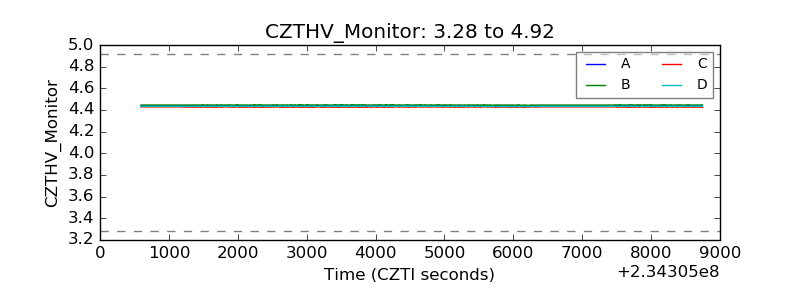 |
| D_VDD | 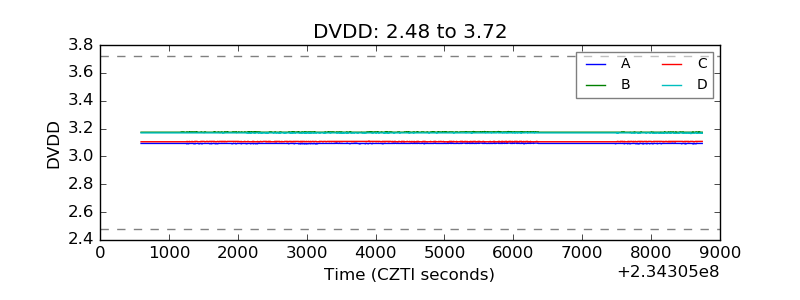 |
| Temperature 1 | 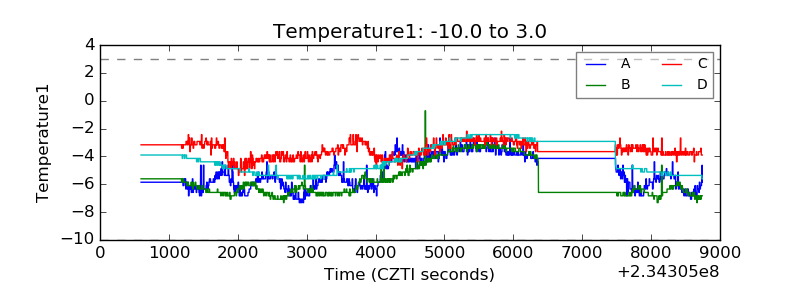 |
| Veto HV Monitor | 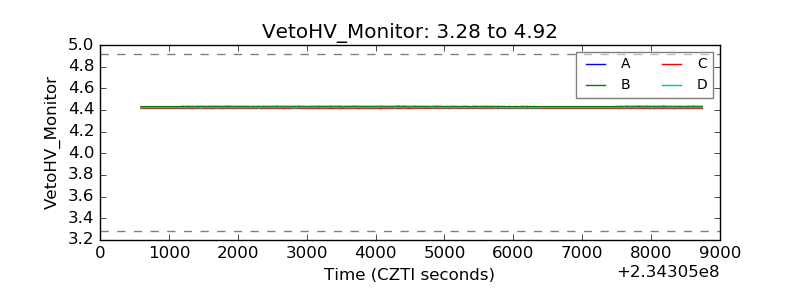 |
| Veto LLD | 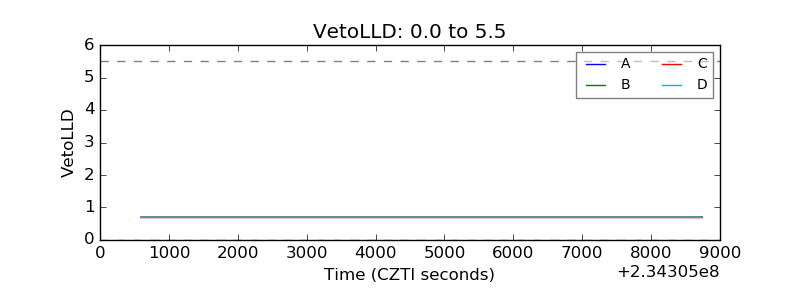 |
| Alpha Counter | 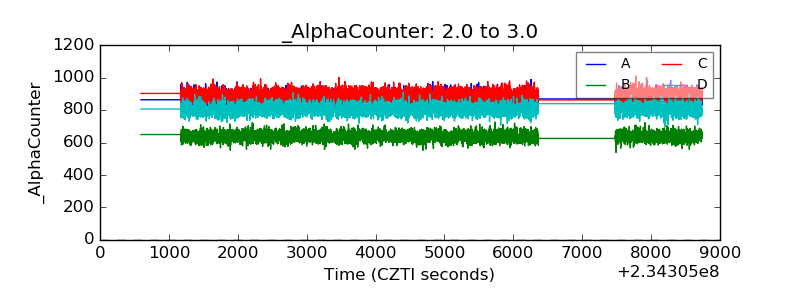 |
| _CPM_Rate | 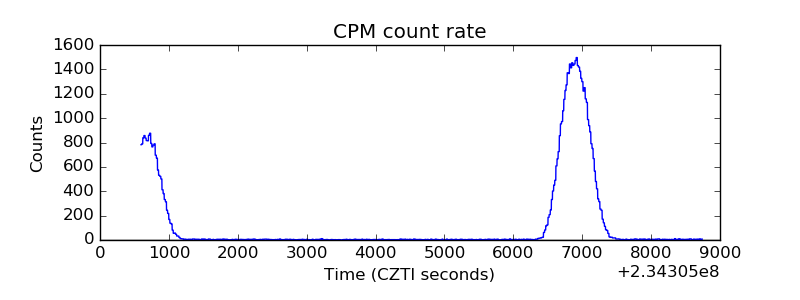 |
| CZT Counter | 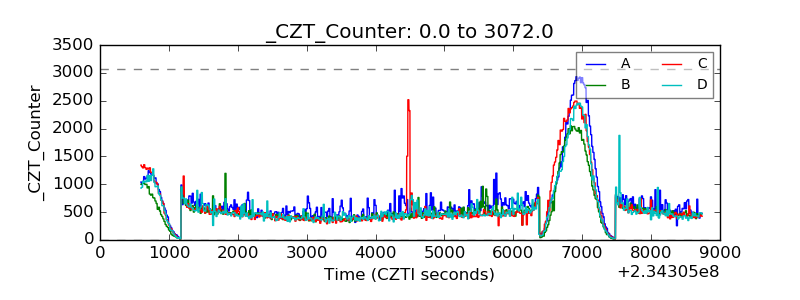 |
| +2.5 Volts monitor | 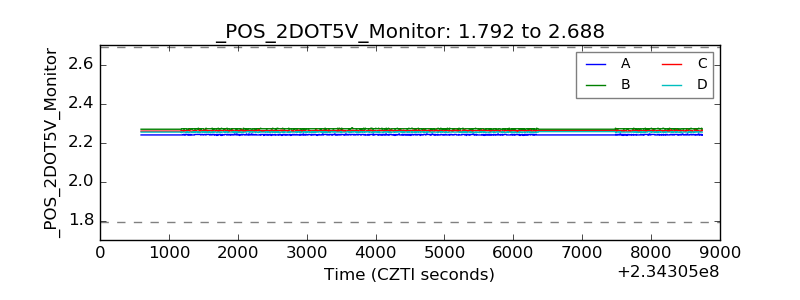 |
| +5 Volts monitor |  |
| _ROLL_ROT | 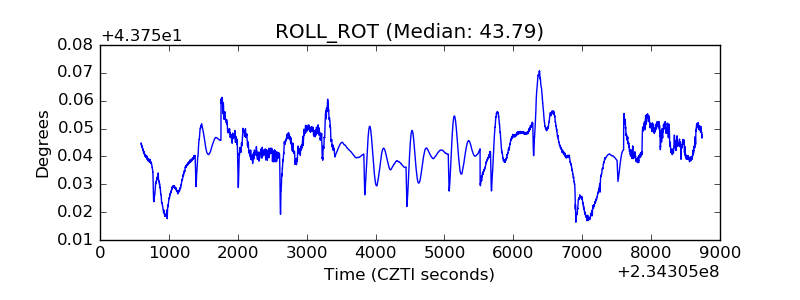 |
| _Roll_DEC | 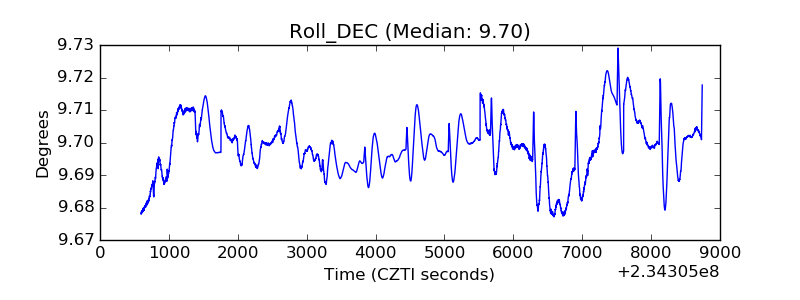 |
| _Roll_RA | 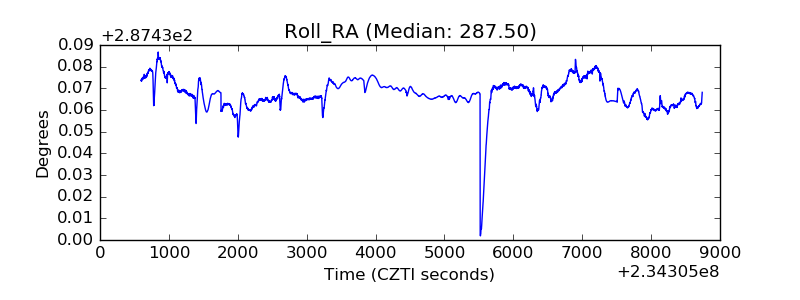 |
| Veto Counter | 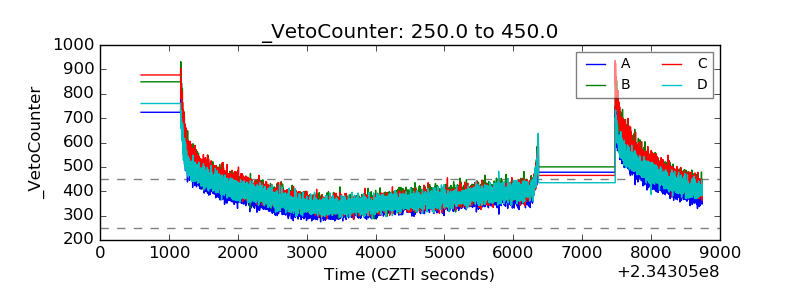 |