| Param | Original file | Final file |
|---|---|---|
| Filename | modeM0/AS1A03_105T01_9000001268_09116cztM0_level2.evt | modeM0/AS1A03_105T01_9000001268_09116cztM0_level2_quad_clean.evt |
| Size (bytes) | 450,144,000 | 86,149,440 |
| Size | 429.3 MB | 82.2 MB |
| Events in quadrant A | 3,970,146 | 541,024 |
| Events in quadrant B | 3,185,061 | 557,242 |
| Events in quadrant C | 2,989,803 | 541,874 |
| Events in quadrant D | 3,056,120 | 525,571 |
| Mode M0 | |||
|---|---|---|---|
| Quadrant | BADHDUFLAG | Total packets | Discarded packets |
| A | 0 | 16030 | 3 |
| B | 0 | 13549 | 2 |
| C | 0 | 13174 | 4 |
| D | 0 | 13454 | 2 |
| Mode SS | |||
|---|---|---|---|
| Quadrant | BADHDUFLAG | Total packets | Discarded packets |
| A | 0 | 130 | 0 |
| B | 0 | 130 | 0 |
| C | 0 | 130 | 0 |
| D | 0 | 130 | 0 |
| Mode M9 | |||
|---|---|---|---|
| Quadrant | BADHDUFLAG | Total packets | Discarded packets |
| A | 0 | 23 | 0 |
| B | 0 | 23 | 0 |
| C | 0 | 23 | 0 |
| D | 0 | 23 | 0 |
| Quadrant | Total seconds | Saturated seconds | Saturation percentage |
|---|---|---|---|
| A | 6353 | 84 | 1.322210% |
| B | 6353 | 66 | 1.038879% |
| C | 6352 | 28 | 0.440806% |
| D | 6353 | 47 | 0.739808% |
Noise dominated data is calculated using 1-second bins in cleaned event files. If a bin has >2000 counts, and if more than 50% of those come from <1% of pixels, then it is considered to be noise-dominated and hence unusable.
| Quadrant | # 1 sec bins | Bins with >0 counts | Bins with >2000 counts | High rate bins dominated by noise | Noise dominated (total time) | Noise dominated (detector-on time) | Marked lightcurve |
|---|---|---|---|---|---|---|---|
| A | 8653 | 6354 | 28 | 28 | 0.32% | 0.44% | 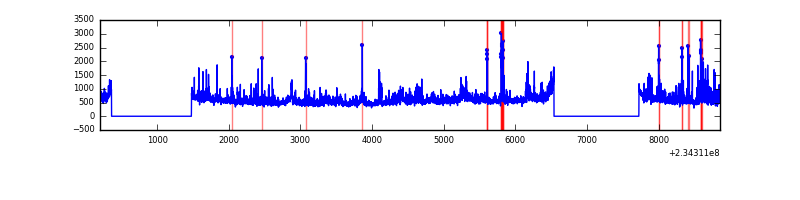 |
| B | 8653 | 6354 | 14 | 14 | 0.16% | 0.22% | 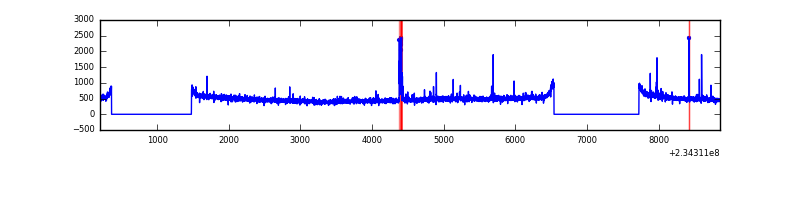 |
| C | 8653 | 6355 | 0 | 0 | 0.00% | 0.00% |  |
| D | 8653 | 6355 | 15 | 15 | 0.17% | 0.24% | 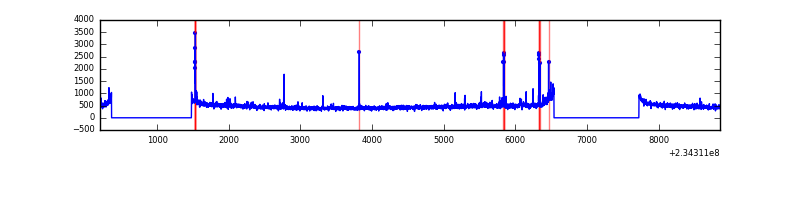 |
Top three noisy pixels from each quadrant. If the there are fewer than three noisy pixels in the level2.evt file, extra rows are filled as -1
| Pixel properties | Quadrant properties | ||||||
|---|---|---|---|---|---|---|---|
| Quadrant | DetID | PixID | Counts | Sigma | Mean | Median | Sigma |
| A | 8 | 5 | 645083 | 4093.92 | 780 | 767 | 157.4 |
| A | 4 | 2 | 213251 | 1350.1 | 780 | 767 | 157.4 |
| A | 1 | 162 | 38005 | 236.61 | 780 | 767 | 157.4 |
| B | 0 | 214 | 101105 | 670.48 | 790 | 772 | 149.6 |
| B | 12 | 111 | 17058 | 108.83 | 790 | 772 | 149.6 |
| B | 11 | 111 | 13607 | 85.77 | 790 | 772 | 149.6 |
| C | 13 | 61 | 5757 | 27.98 | 764 | 768 | 178.3 |
| C | 12 | 4 | 4639 | 21.71 | 764 | 768 | 178.3 |
| C | 10 | 22 | 3533 | 15.51 | 764 | 768 | 178.3 |
| D | 1 | 52 | 71306 | 377.25 | 758 | 740 | 187.1 |
| D | 2 | 14 | 68442 | 361.94 | 758 | 740 | 187.1 |
| D | 2 | 234 | 21992 | 113.61 | 758 | 740 | 187.1 |
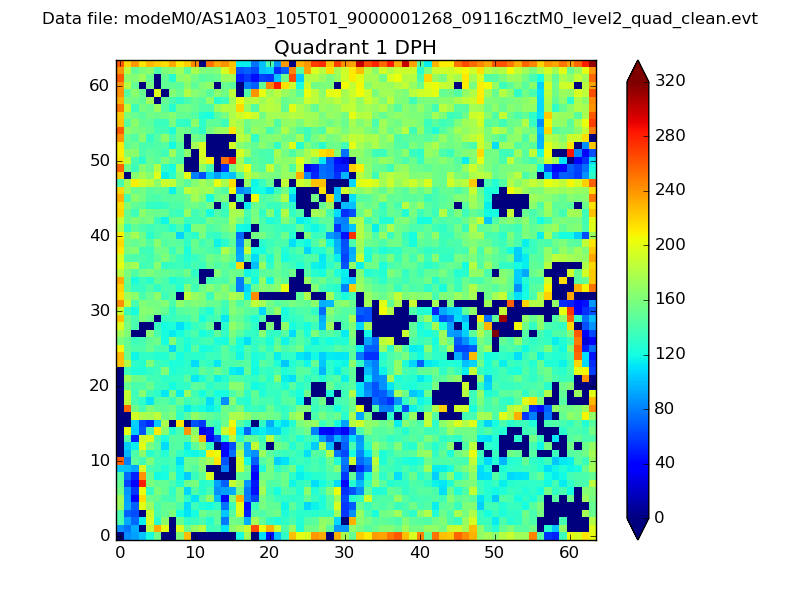
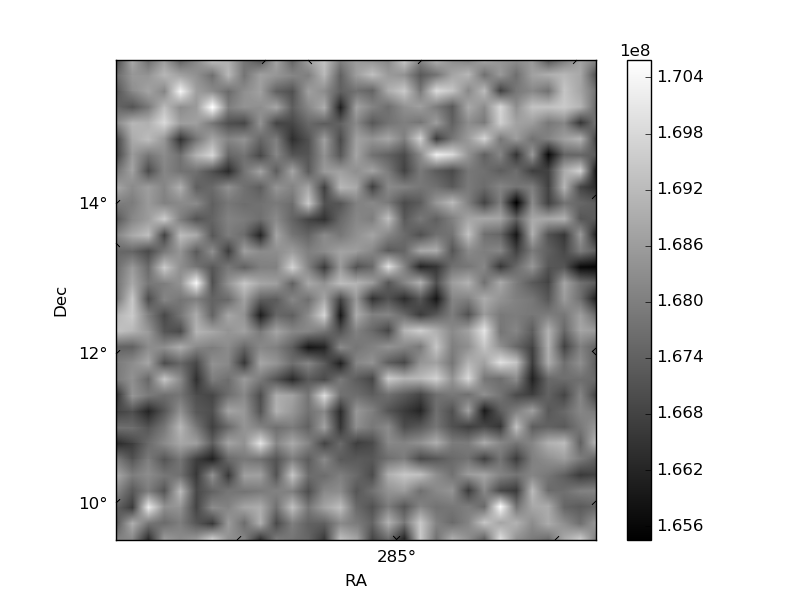
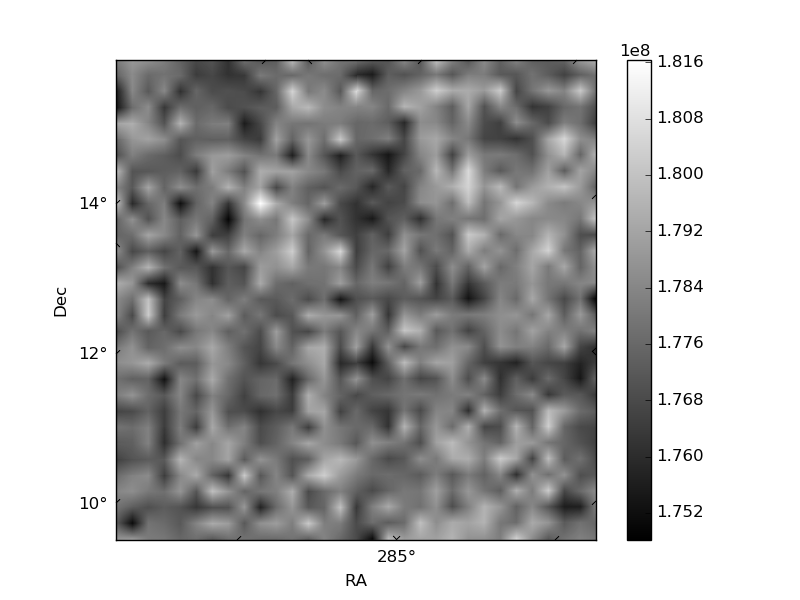
Histogram calculated using DETX and DETY for each event in the final _common_clean file
| Quadrant A | 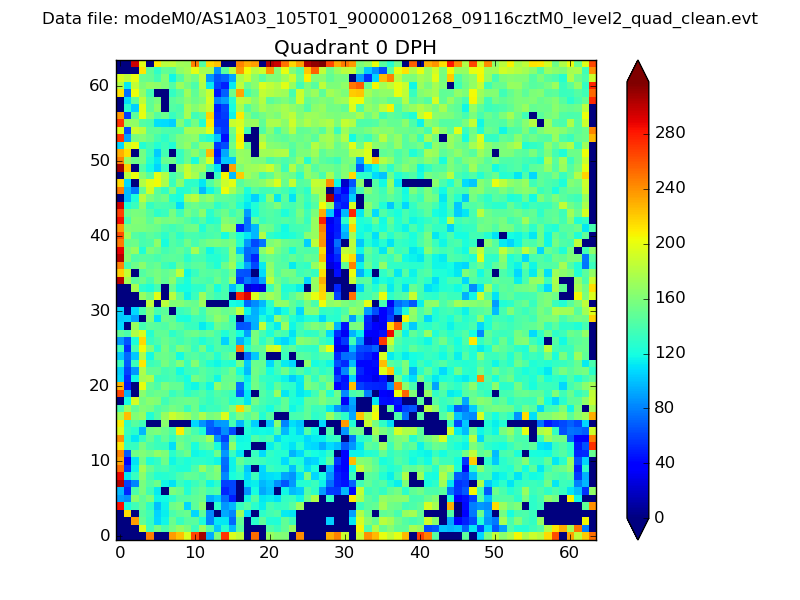 |
 |
Quadrant B |
|---|---|---|---|
| Quadrant D | 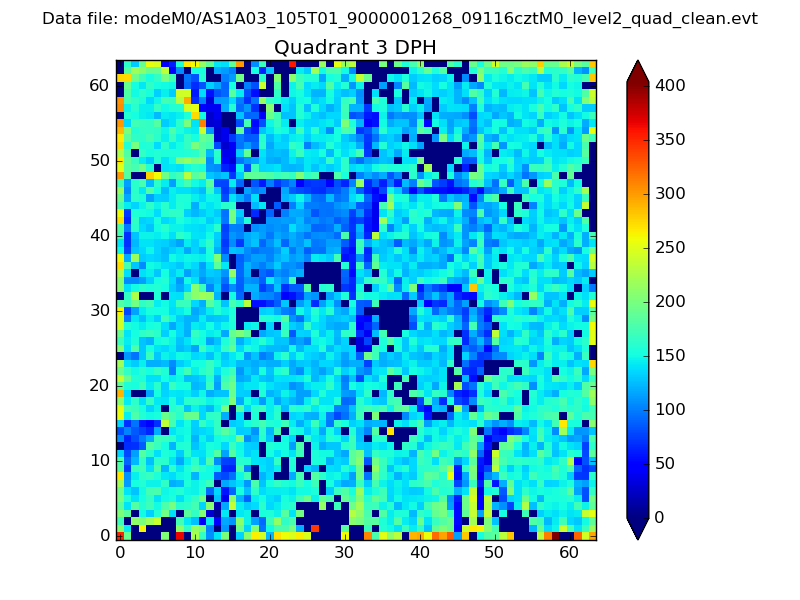 |
 |
Quadrant C |
| Plot type | Count rate plots | Images |
|---|---|---|
| Comparison with Poisson distribution Blue bars denote a histogram of data divided into 1 sec bins. Red curve is a Poisson curve with rate = median count rate of data. |
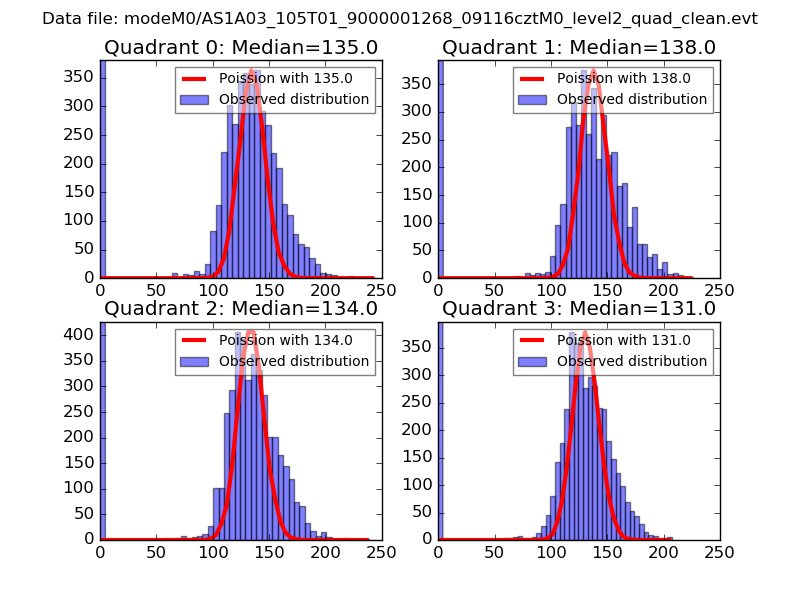 |
 |
| Quadrant-wise count rates Data is divided into 100 sec bins |
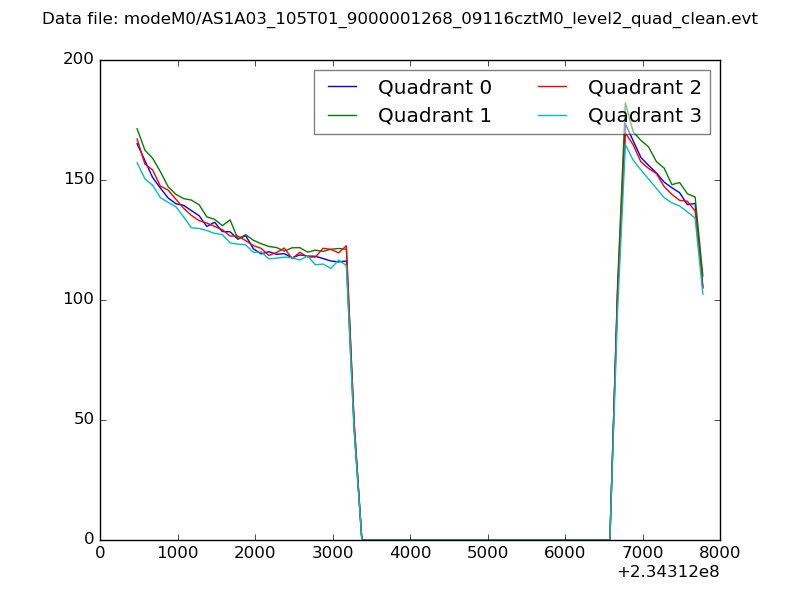 |
|
| Module-wise count rates for Quadrant A Data is divided into 100 sec bins |
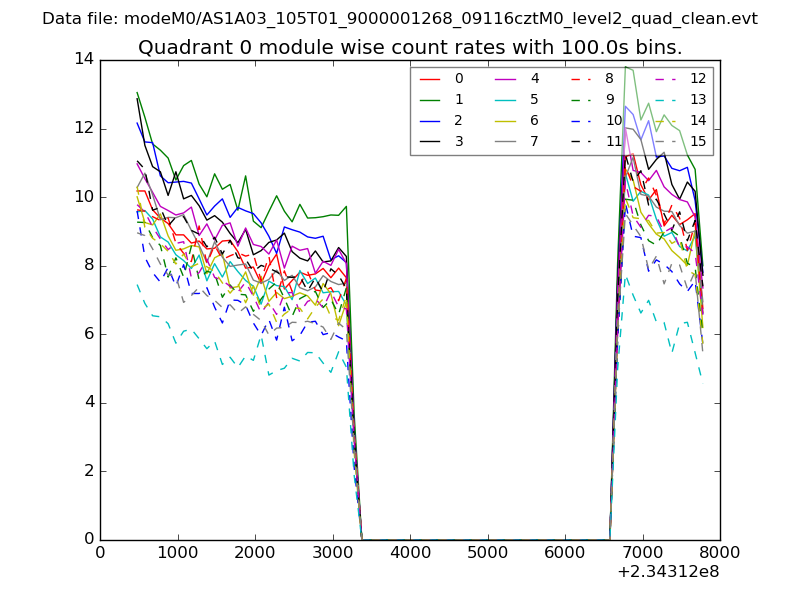 |
 |
| Module-wise count rates for Quadrant B Data is divided into 100 sec bins |
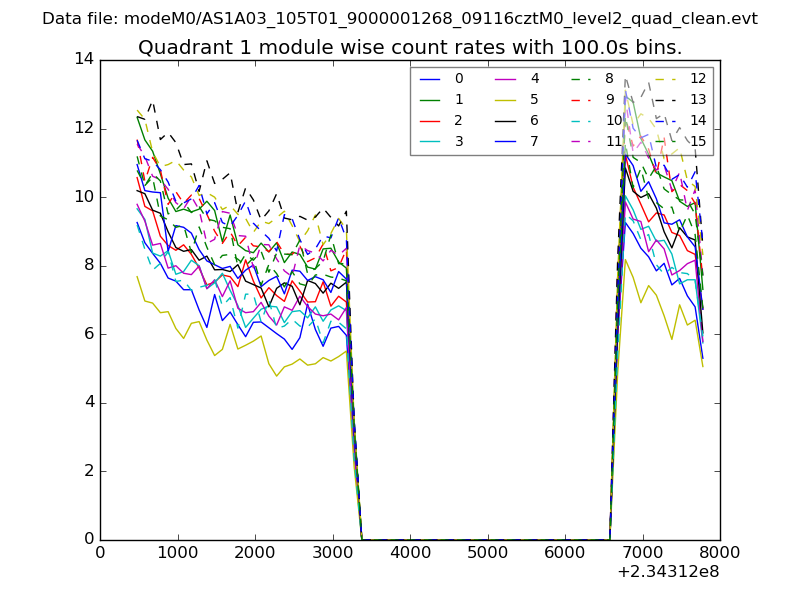 |
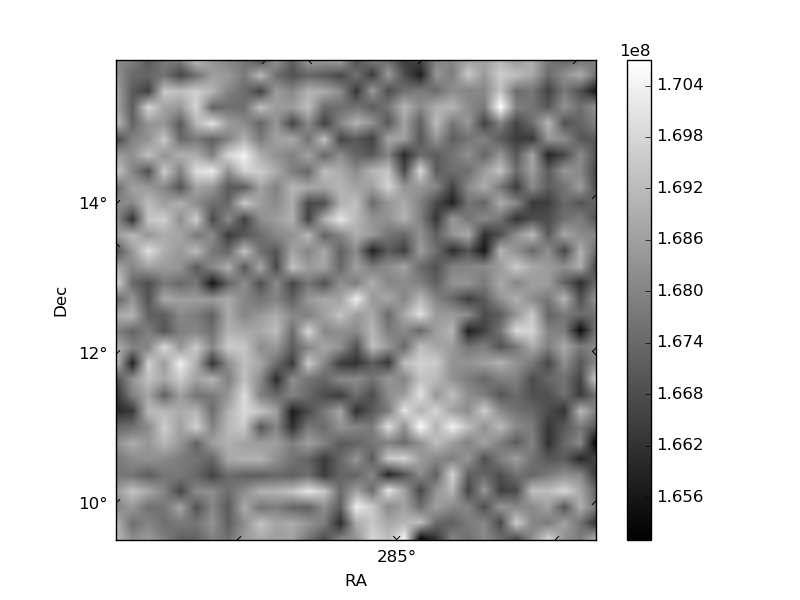 |
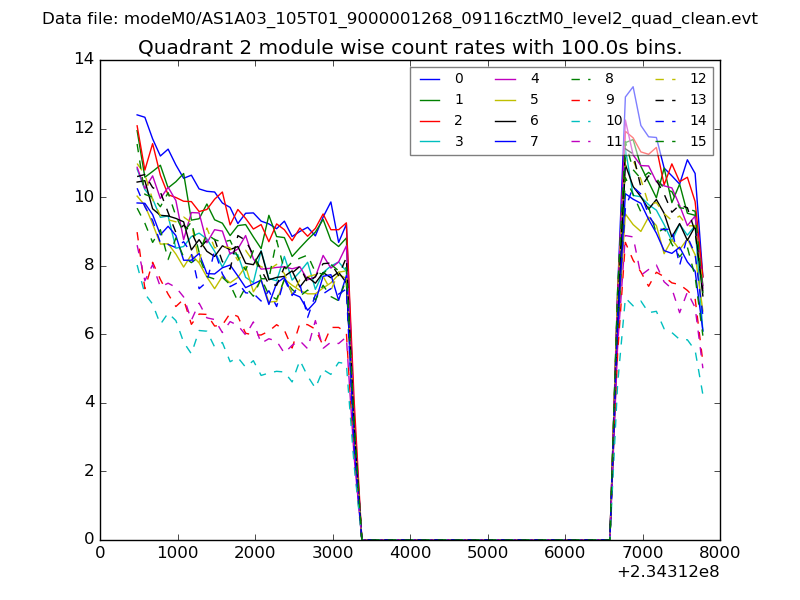
| Module-wise count rates for Quadrant C Data is divided into 100 sec bins |
 |
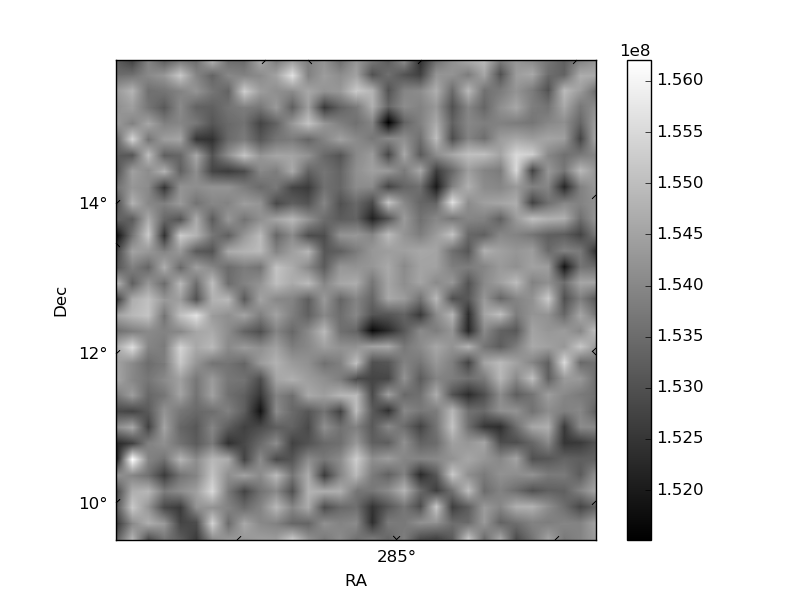 |
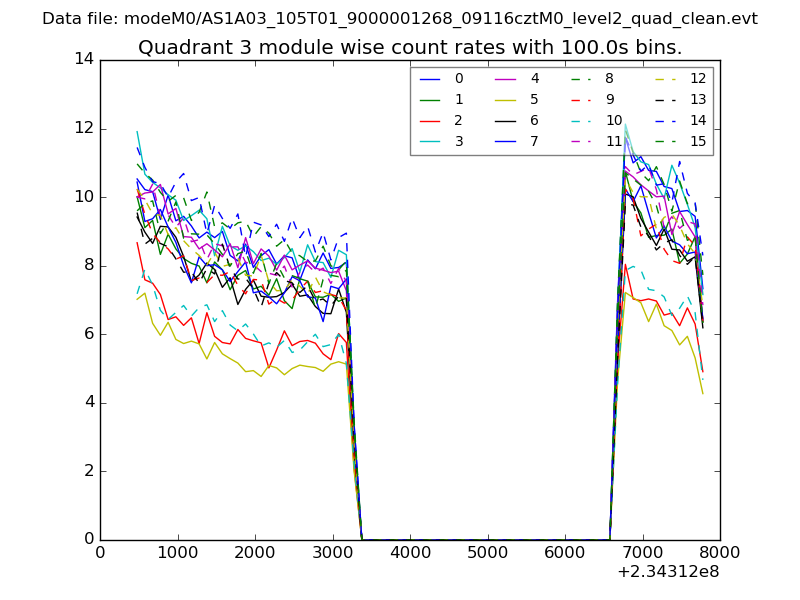
| Module-wise count rates for Quadrant D Data is divided into 100 sec bins |
 |
 |
| Parameter | Plot |
|---|---|
| CZT HV Monitor | 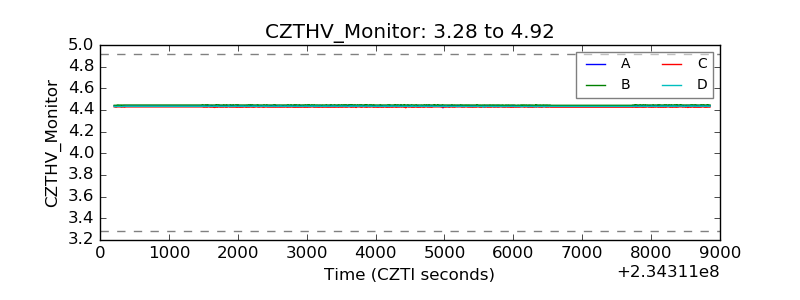 |
| D_VDD | 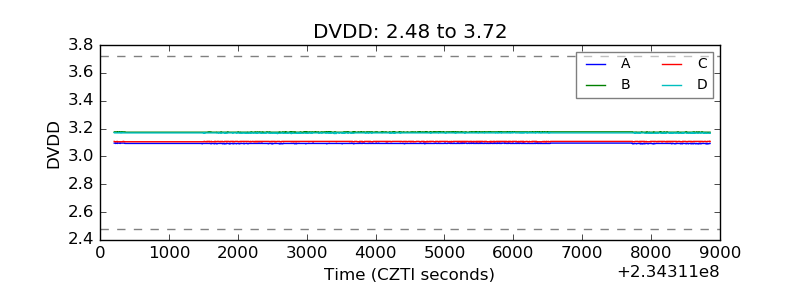 |
| Temperature 1 | 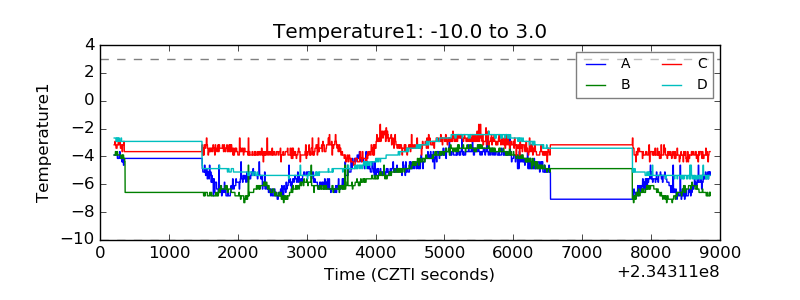 |
| Veto HV Monitor | 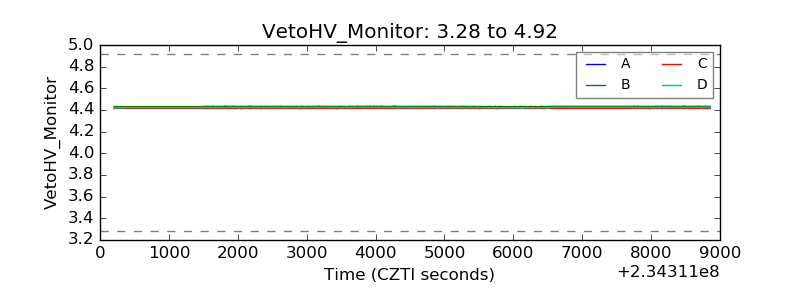 |
| Veto LLD | 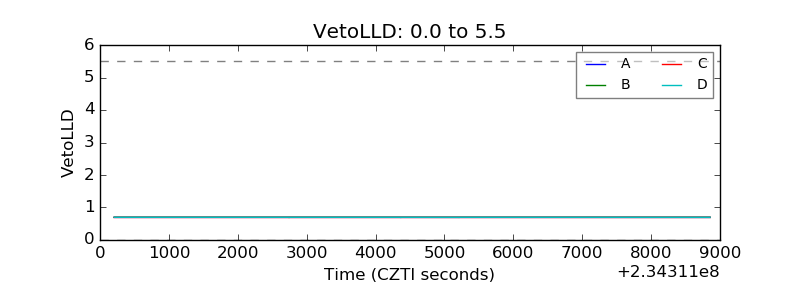 |
| Alpha Counter | 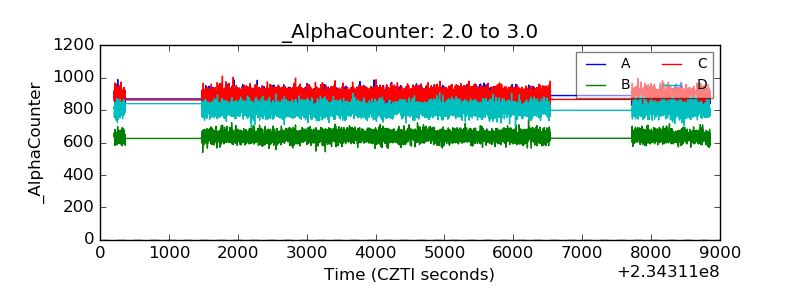 |
| _CPM_Rate | 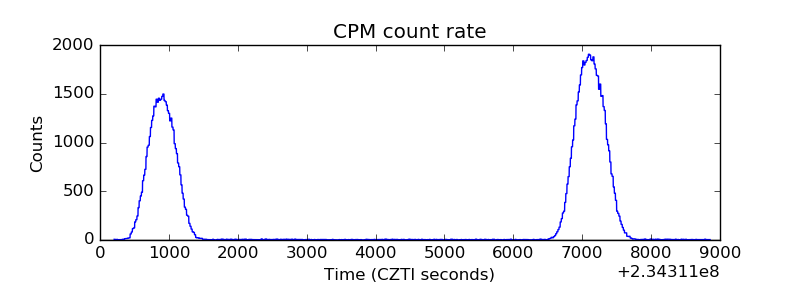 |
| CZT Counter |  |
| +2.5 Volts monitor |  |
| +5 Volts monitor |  |
| _ROLL_ROT | 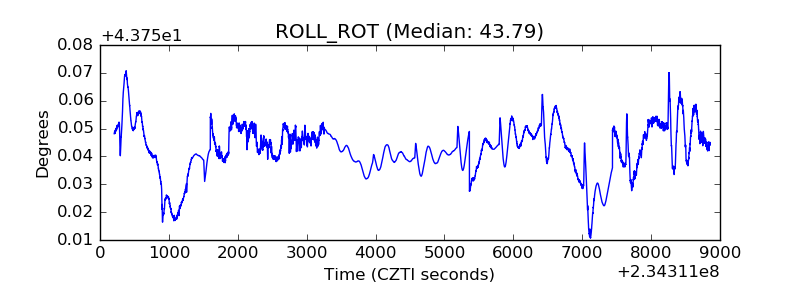 |
| _Roll_DEC | 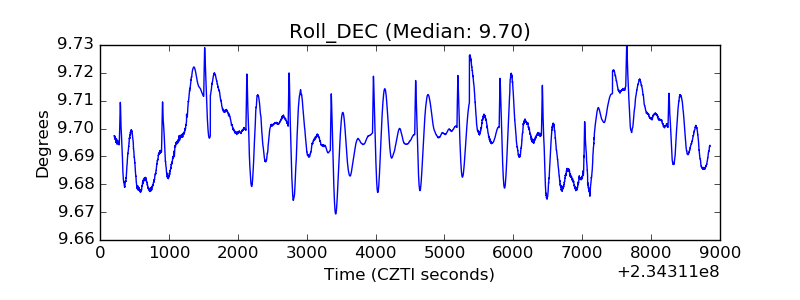 |
| _Roll_RA | 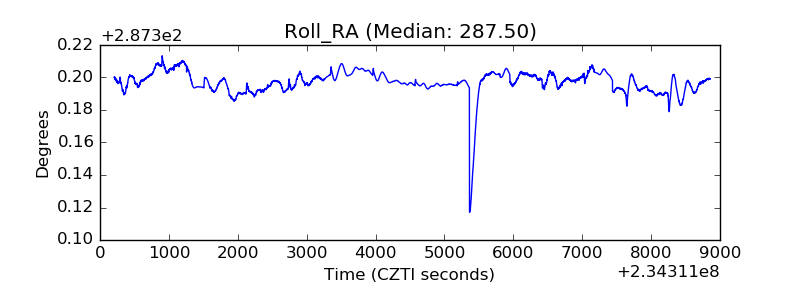 |
| Veto Counter | 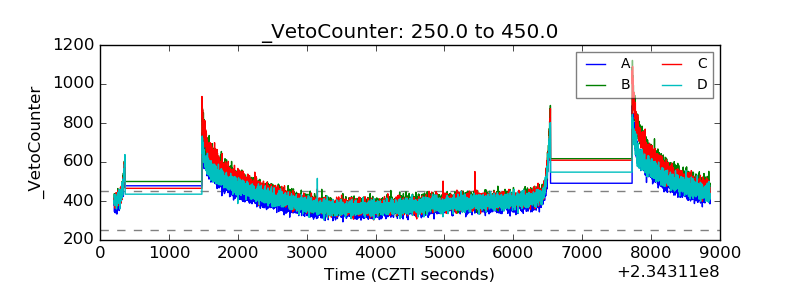 |