| Param | Original file | Final file |
|---|---|---|
| Filename | modeM0/AS1A03_105T01_9000001268_09119cztM0_level2.evt | modeM0/AS1A03_105T01_9000001268_09119cztM0_level2_quad_clean.evt |
| Size (bytes) | 491,451,840 | 90,720,000 |
| Size | 468.7 MB | 86.5 MB |
| Events in quadrant A | 3,918,548 | 578,970 |
| Events in quadrant B | 3,366,416 | 592,208 |
| Events in quadrant C | 3,129,095 | 566,962 |
| Events in quadrant D | 4,026,016 | 553,569 |
| Mode M0 | |||
|---|---|---|---|
| Quadrant | BADHDUFLAG | Total packets | Discarded packets |
| A | 0 | 15760 | 3 |
| B | 0 | 13804 | 2 |
| C | 0 | 13550 | 2 |
| D | 0 | 16101 | 2 |
| Mode SS | |||
|---|---|---|---|
| Quadrant | BADHDUFLAG | Total packets | Discarded packets |
| A | 0 | 132 | 0 |
| B | 0 | 132 | 0 |
| C | 0 | 132 | 0 |
| D | 0 | 132 | 0 |
| Mode M9 | |||
|---|---|---|---|
| Quadrant | BADHDUFLAG | Total packets | Discarded packets |
| A | 0 | 16 | 0 |
| B | 0 | 16 | 0 |
| C | 0 | 16 | 0 |
| D | 0 | 17 | 0 |
| Quadrant | Total seconds | Saturated seconds | Saturation percentage |
|---|---|---|---|
| A | 6535 | 132 | 2.019893% |
| B | 6535 | 94 | 1.438409% |
| C | 6535 | 46 | 0.703902% |
| D | 6535 | 278 | 4.254017% |
Noise dominated data is calculated using 1-second bins in cleaned event files. If a bin has >2000 counts, and if more than 50% of those come from <1% of pixels, then it is considered to be noise-dominated and hence unusable.
| Quadrant | # 1 sec bins | Bins with >0 counts | Bins with >2000 counts | High rate bins dominated by noise | Noise dominated (total time) | Noise dominated (detector-on time) | Marked lightcurve |
|---|---|---|---|---|---|---|---|
| A | 7815 | 6535 | 23 | 23 | 0.29% | 0.35% | 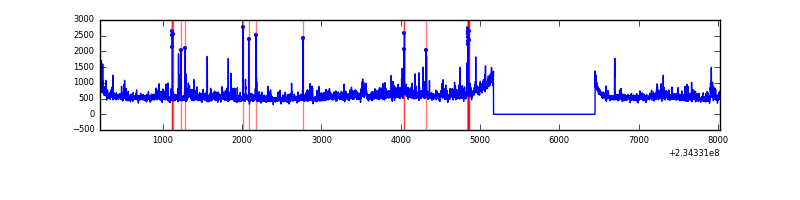 |
| B | 7815 | 6535 | 2 | 2 | 0.03% | 0.03% | 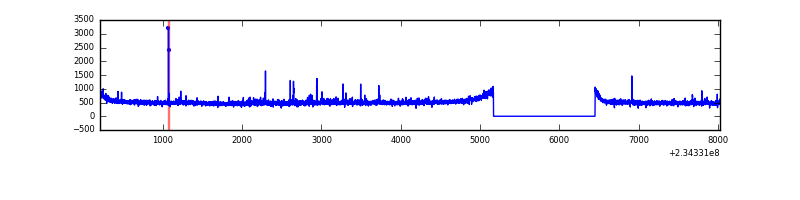 |
| C | 7815 | 6536 | 0 | 0 | 0.00% | 0.00% |  |
| D | 7815 | 6535 | 235 | 235 | 3.01% | 3.60% |  |
Top three noisy pixels from each quadrant. If the there are fewer than three noisy pixels in the level2.evt file, extra rows are filled as -1
| Pixel properties | Quadrant properties | ||||||
|---|---|---|---|---|---|---|---|
| Quadrant | DetID | PixID | Counts | Sigma | Mean | Median | Sigma |
| A | 8 | 5 | 528757 | 3107.43 | 840 | 826 | 169.9 |
| A | 1 | 162 | 59660 | 346.3 | 840 | 826 | 169.9 |
| A | 15 | 223 | 45622 | 263.67 | 840 | 826 | 169.9 |
| B | 0 | 214 | 100315 | 618.92 | 839 | 820 | 160.8 |
| B | 12 | 111 | 17676 | 104.85 | 839 | 820 | 160.8 |
| B | 11 | 111 | 14175 | 83.08 | 839 | 820 | 160.8 |
| C | 13 | 61 | 5983 | 28.04 | 800 | 805 | 184.7 |
| C | 10 | 22 | 4095 | 17.82 | 800 | 805 | 184.7 |
| C | 12 | 4 | 2859 | 11.12 | 800 | 805 | 184.7 |
| D | 1 | 52 | 660079 | 3452.27 | 795 | 777 | 191.0 |
| D | 12 | 233 | 199209 | 1039.04 | 795 | 777 | 191.0 |
| D | 8 | 195 | 65868 | 340.83 | 795 | 777 | 191.0 |
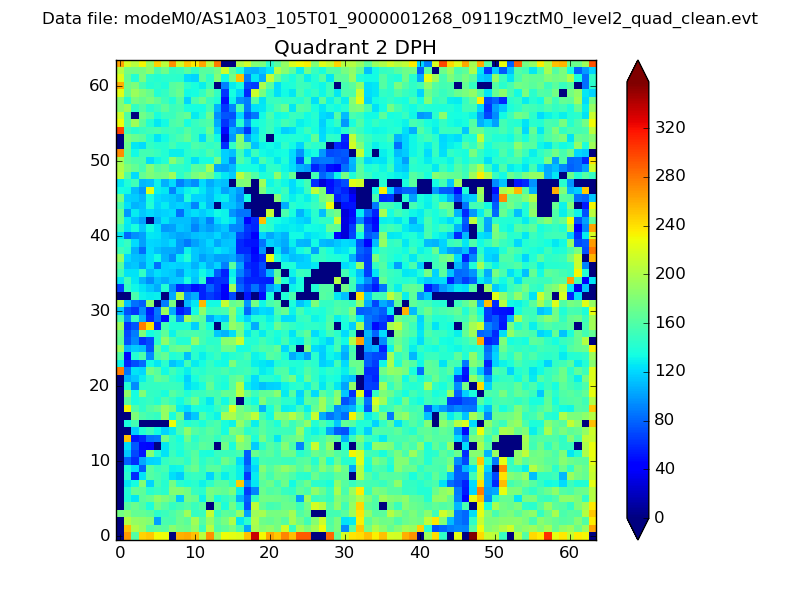
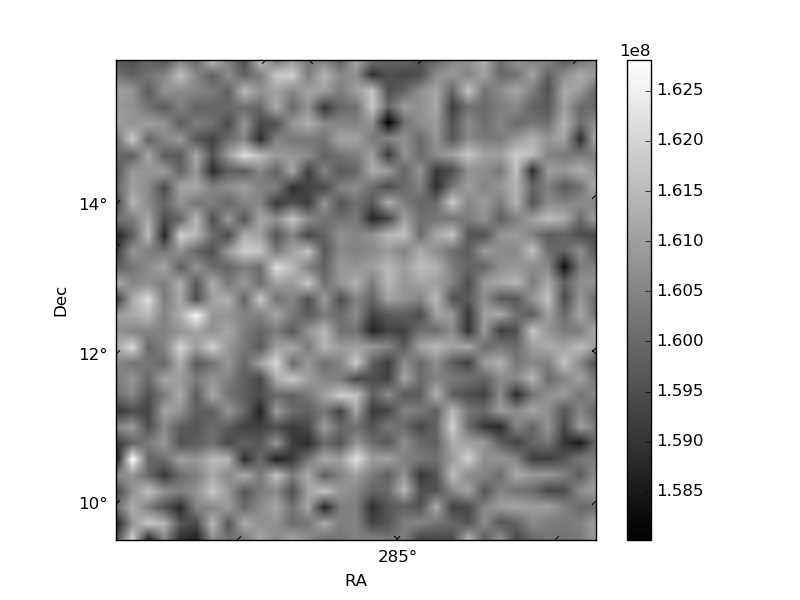
Histogram calculated using DETX and DETY for each event in the final _common_clean file
| Quadrant A | 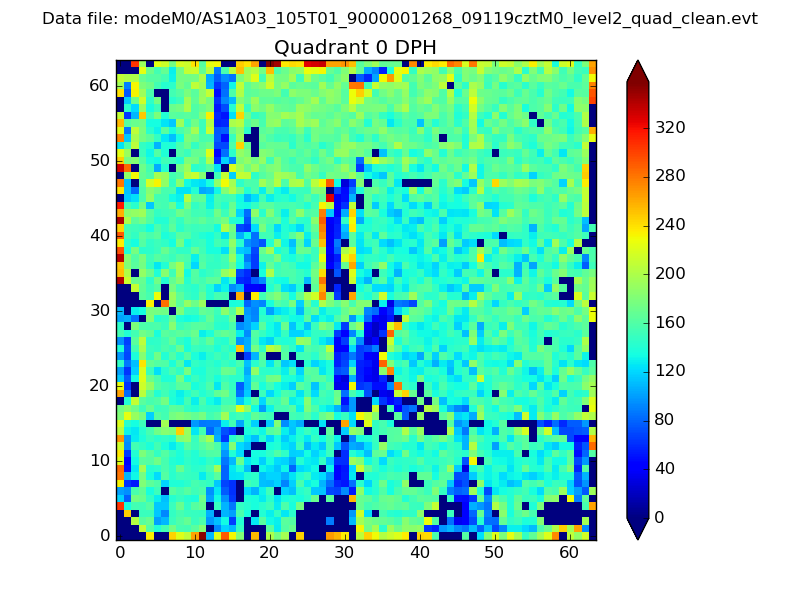 |
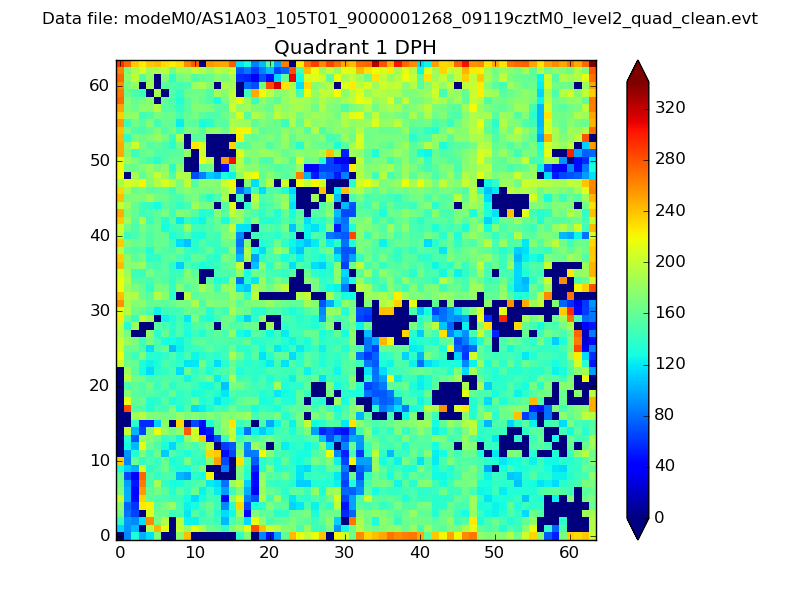 |
Quadrant B |
|---|---|---|---|
| Quadrant D | 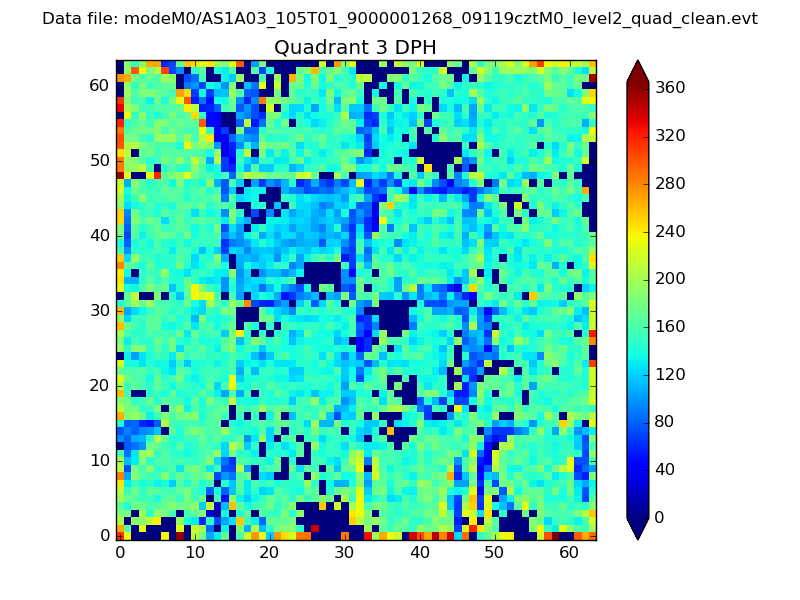 |
 |
Quadrant C |
| Plot type | Count rate plots | Images |
|---|---|---|
| Comparison with Poisson distribution Blue bars denote a histogram of data divided into 1 sec bins. Red curve is a Poisson curve with rate = median count rate of data. |
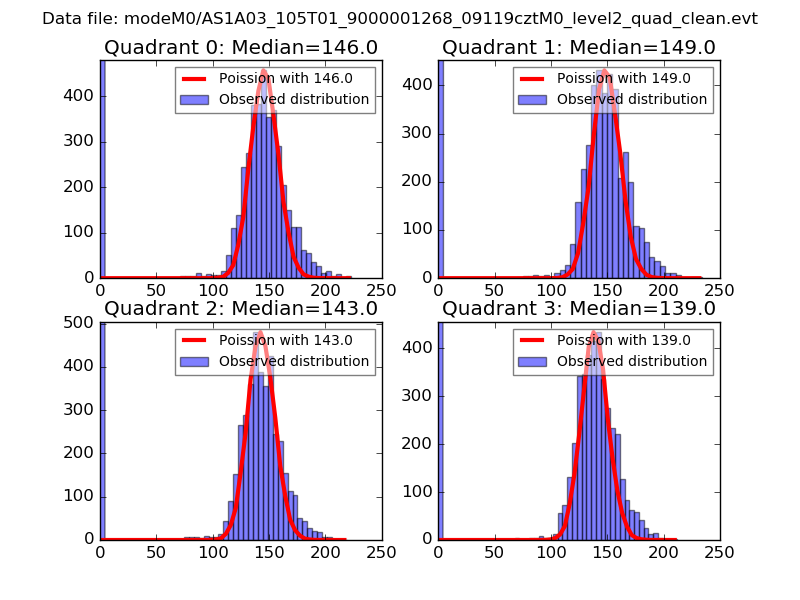 |
 |
| Quadrant-wise count rates Data is divided into 100 sec bins |
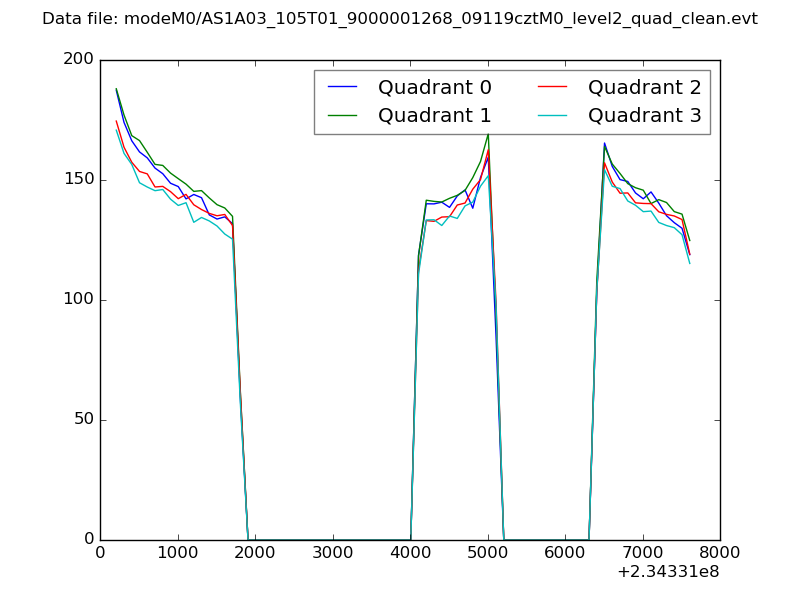 |
|
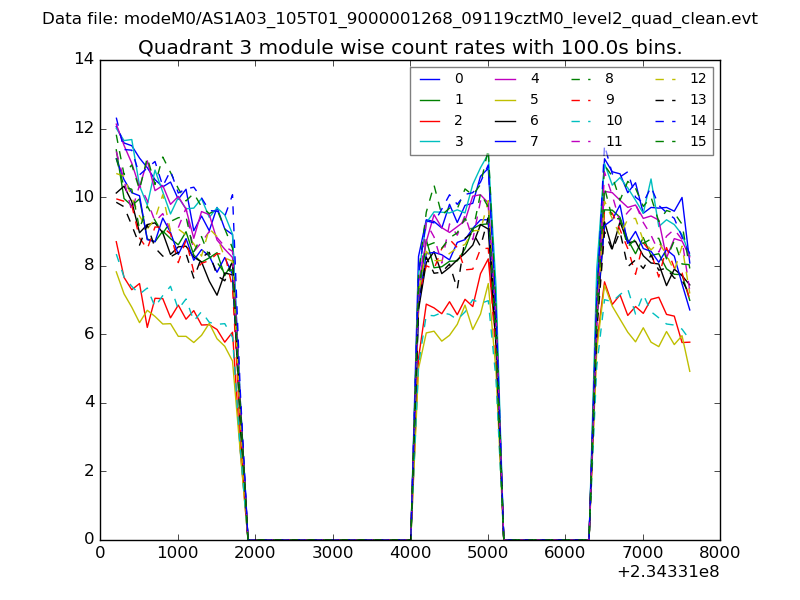
| Module-wise count rates for Quadrant A Data is divided into 100 sec bins |
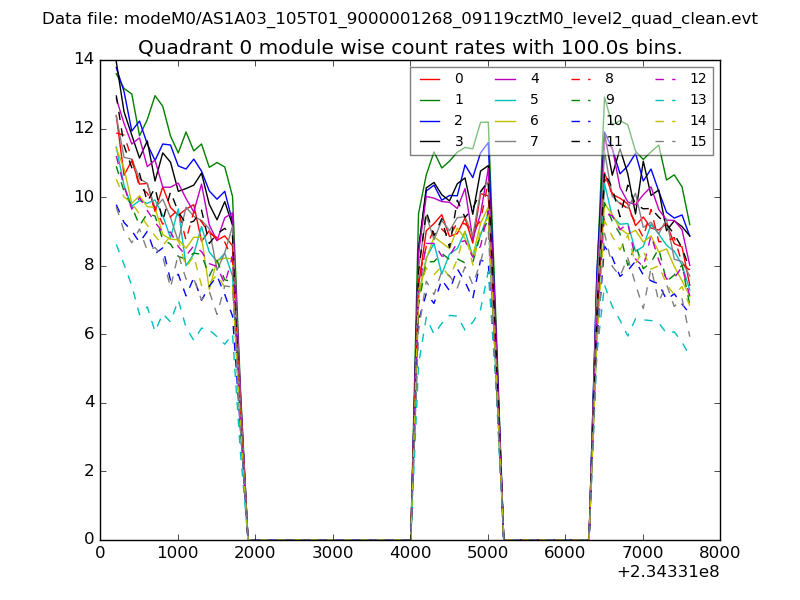 |
 |
| Module-wise count rates for Quadrant B Data is divided into 100 sec bins |
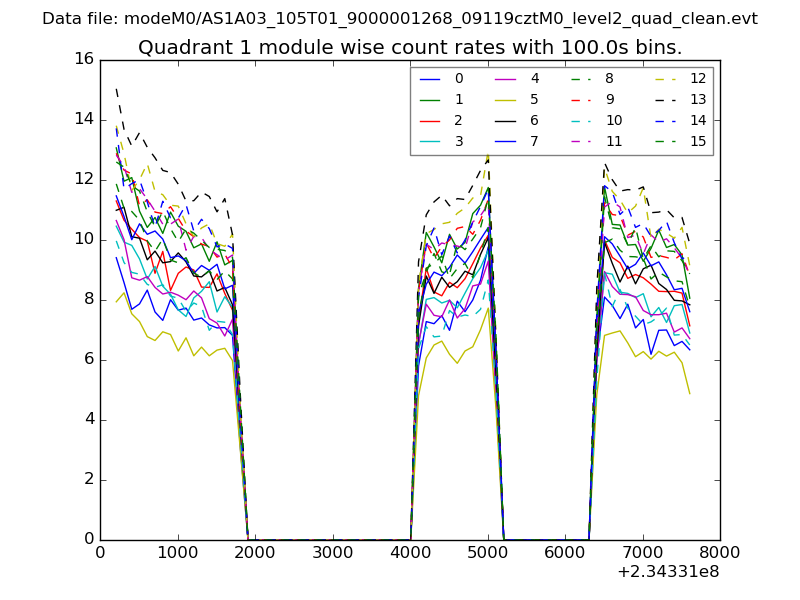 |
 |
| Module-wise count rates for Quadrant C Data is divided into 100 sec bins |
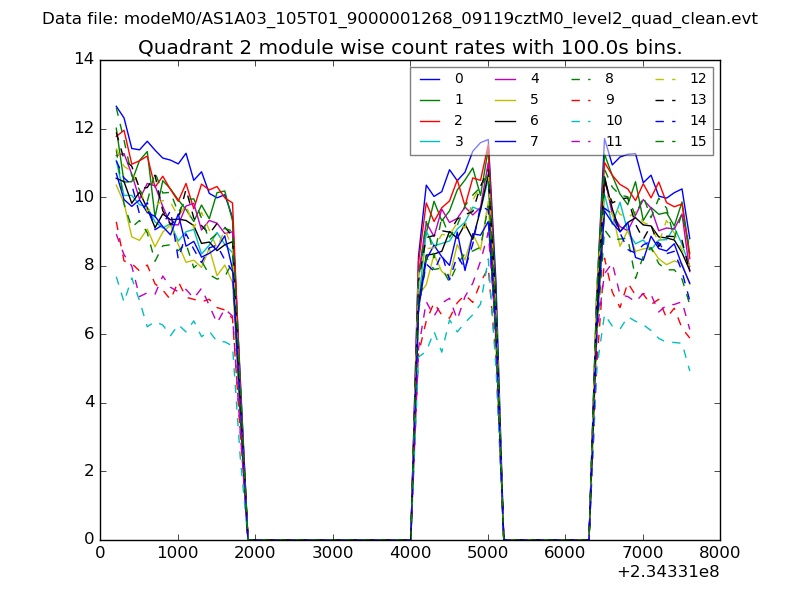 |
 |
| Module-wise count rates for Quadrant D Data is divided into 100 sec bins |
 |
 |
| Parameter | Plot |
|---|---|
| CZT HV Monitor | 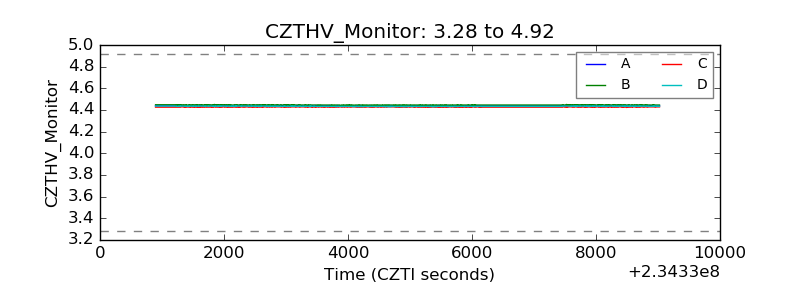 |
| D_VDD | 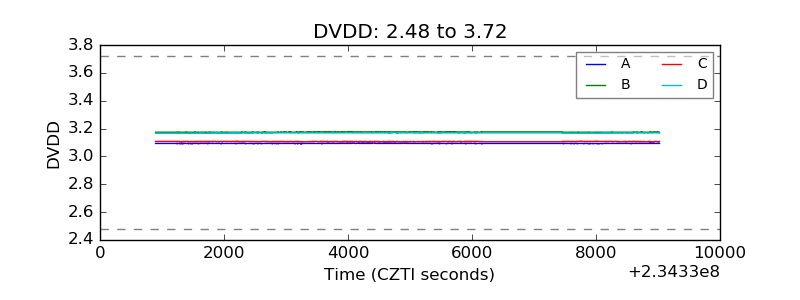 |
| Temperature 1 | 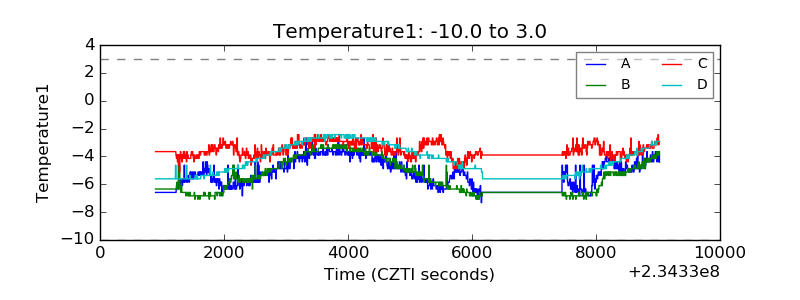 |
| Veto HV Monitor | 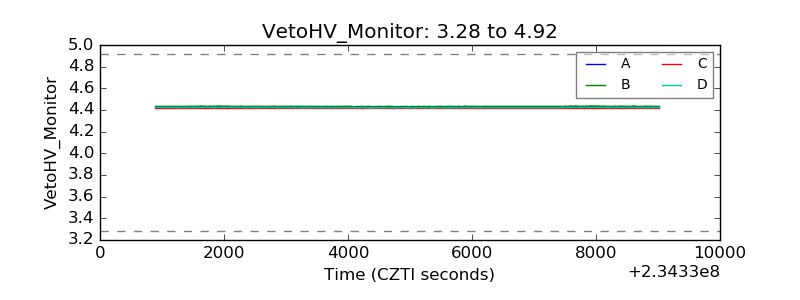 |
| Veto LLD | 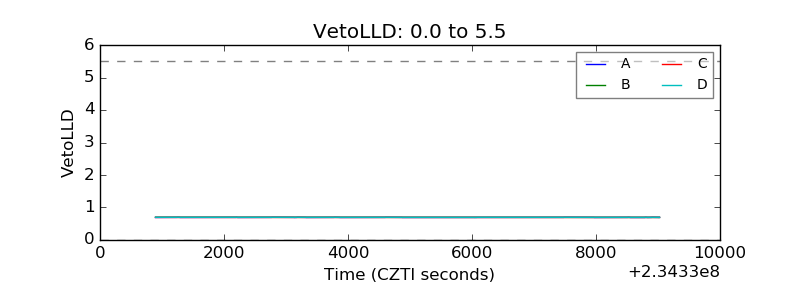 |
| Alpha Counter | 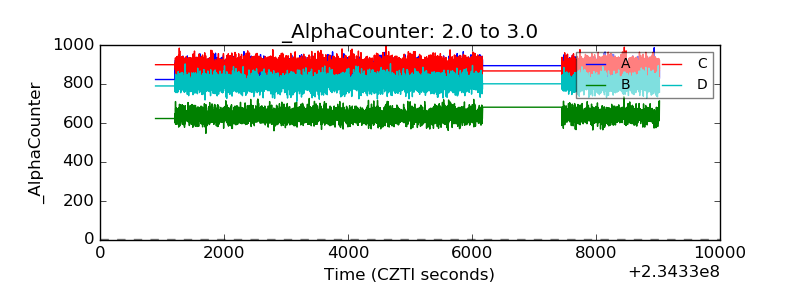 |
| _CPM_Rate | 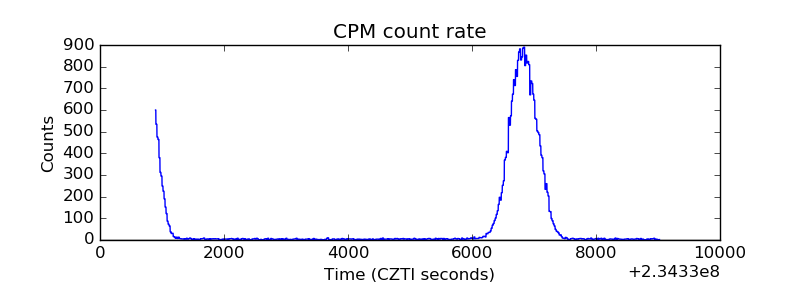 |
| CZT Counter | 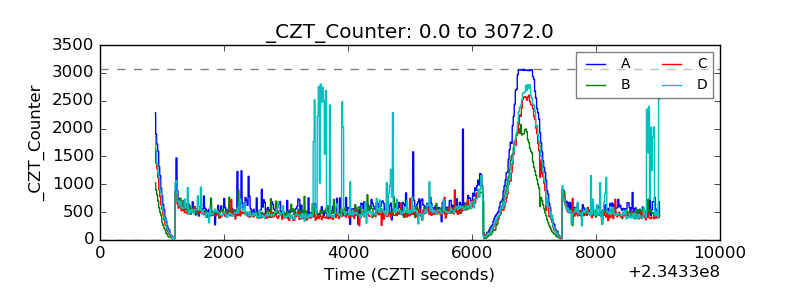 |
| +2.5 Volts monitor |  |
| +5 Volts monitor |  |
| _ROLL_ROT | 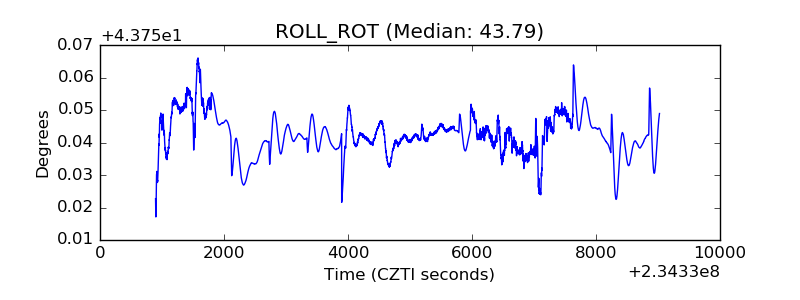 |
| _Roll_DEC | 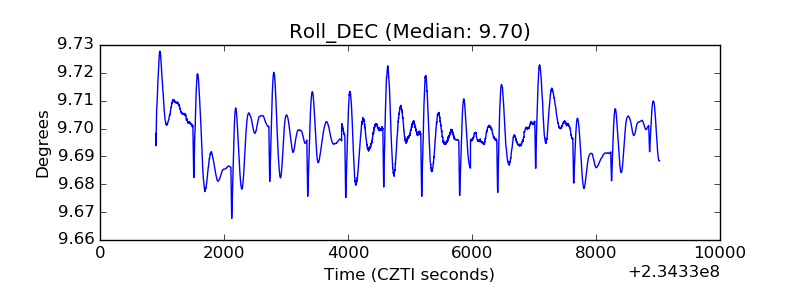 |
| _Roll_RA | 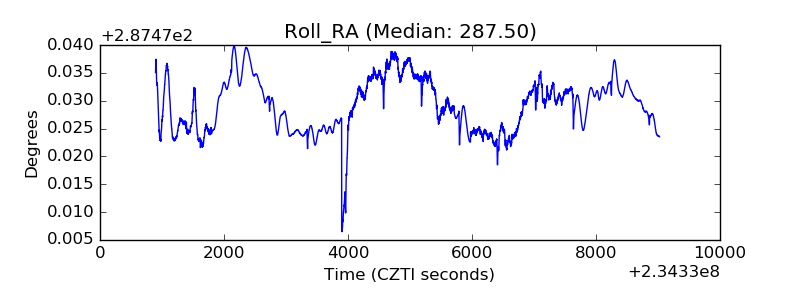 |
| Veto Counter | 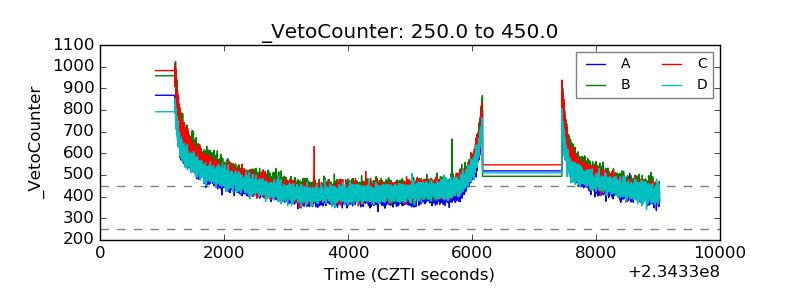 |