| Param | Original file | Final file |
|---|---|---|
| Filename | modeM0/AS1A03_105T01_9000001268_09120cztM0_level2.evt | modeM0/AS1A03_105T01_9000001268_09120cztM0_level2_quad_clean.evt |
| Size (bytes) | 470,338,560 | 74,275,200 |
| Size | 448.5 MB | 70.8 MB |
| Events in quadrant A | 3,739,280 | 457,606 |
| Events in quadrant B | 3,100,056 | 465,276 |
| Events in quadrant C | 2,890,386 | 450,651 |
| Events in quadrant D | 4,090,409 | 439,529 |
| Mode M0 | |||
|---|---|---|---|
| Quadrant | BADHDUFLAG | Total packets | Discarded packets |
| A | 0 | 15004 | 2 |
| B | 0 | 12944 | 1 |
| C | 0 | 12769 | 1 |
| D | 0 | 16275 | 1 |
| Mode SS | |||
|---|---|---|---|
| Quadrant | BADHDUFLAG | Total packets | Discarded packets |
| A | 0 | 128 | 0 |
| B | 0 | 128 | 0 |
| C | 0 | 128 | 0 |
| D | 0 | 128 | 0 |
| Mode M9 | |||
|---|---|---|---|
| Quadrant | BADHDUFLAG | Total packets | Discarded packets |
| A | 0 | 11 | 0 |
| B | 0 | 11 | 0 |
| C | 0 | 11 | 0 |
| D | 0 | 11 | 0 |
| Quadrant | Total seconds | Saturated seconds | Saturation percentage |
|---|---|---|---|
| A | 6241 | 90 | 1.442077% |
| B | 6241 | 73 | 1.169684% |
| C | 6241 | 17 | 0.272392% |
| D | 6241 | 268 | 4.294184% |
Noise dominated data is calculated using 1-second bins in cleaned event files. If a bin has >2000 counts, and if more than 50% of those come from <1% of pixels, then it is considered to be noise-dominated and hence unusable.
| Quadrant | # 1 sec bins | Bins with >0 counts | Bins with >2000 counts | High rate bins dominated by noise | Noise dominated (total time) | Noise dominated (detector-on time) | Marked lightcurve |
|---|---|---|---|---|---|---|---|
| A | 7386 | 6241 | 12 | 12 | 0.16% | 0.19% | 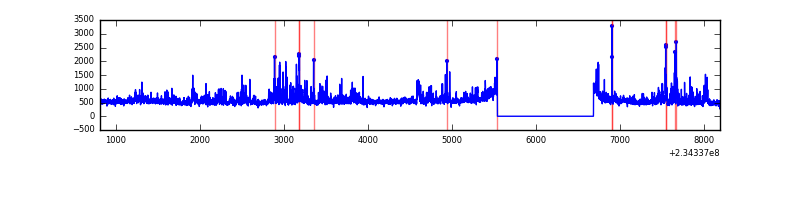 |
| B | 7386 | 6241 | 0 | 0 | 0.00% | 0.00% | 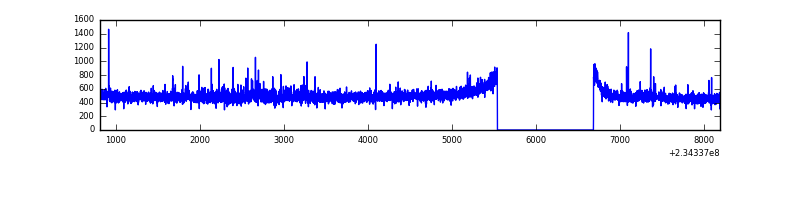 |
| C | 7386 | 6242 | 0 | 0 | 0.00% | 0.00% | 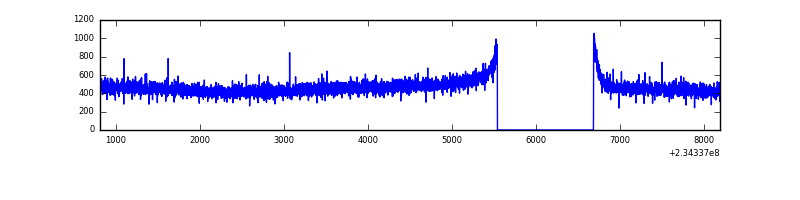 |
| D | 7386 | 6241 | 234 | 234 | 3.17% | 3.75% | 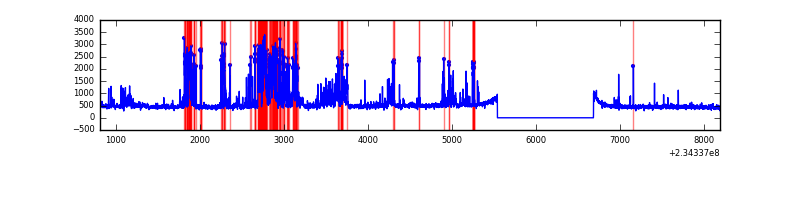 |
Top three noisy pixels from each quadrant. If the there are fewer than three noisy pixels in the level2.evt file, extra rows are filled as -1
| Pixel properties | Quadrant properties | ||||||
|---|---|---|---|---|---|---|---|
| Quadrant | DetID | PixID | Counts | Sigma | Mean | Median | Sigma |
| A | 8 | 5 | 563842 | 3553.32 | 777 | 762 | 158.5 |
| A | 4 | 2 | 98826 | 618.83 | 777 | 762 | 158.5 |
| A | 1 | 162 | 51574 | 320.65 | 777 | 762 | 158.5 |
| B | 0 | 214 | 81299 | 541.31 | 775 | 758 | 148.8 |
| B | 12 | 111 | 16720 | 107.28 | 775 | 758 | 148.8 |
| B | 11 | 111 | 13290 | 84.23 | 775 | 758 | 148.8 |
| C | 13 | 61 | 5621 | 28.51 | 740 | 743 | 171.1 |
| C | 12 | 4 | 1951 | 7.06 | 740 | 743 | 171.1 |
| C | 3 | 202 | 1841 | 6.42 | 740 | 743 | 171.1 |
| D | 12 | 233 | 884420 | 4852.06 | 738 | 718 | 182.1 |
| D | 2 | 14 | 213864 | 1170.3 | 738 | 718 | 182.1 |
| D | 1 | 52 | 85578 | 465.93 | 738 | 718 | 182.1 |
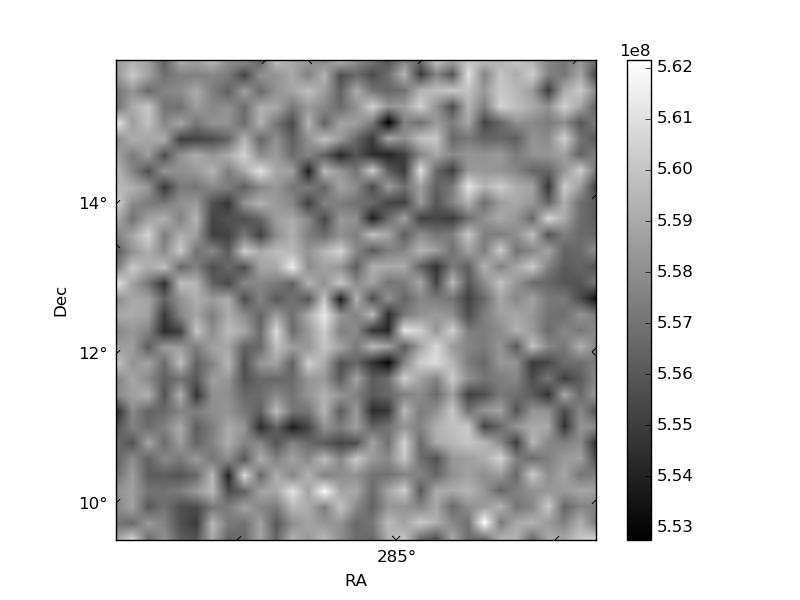
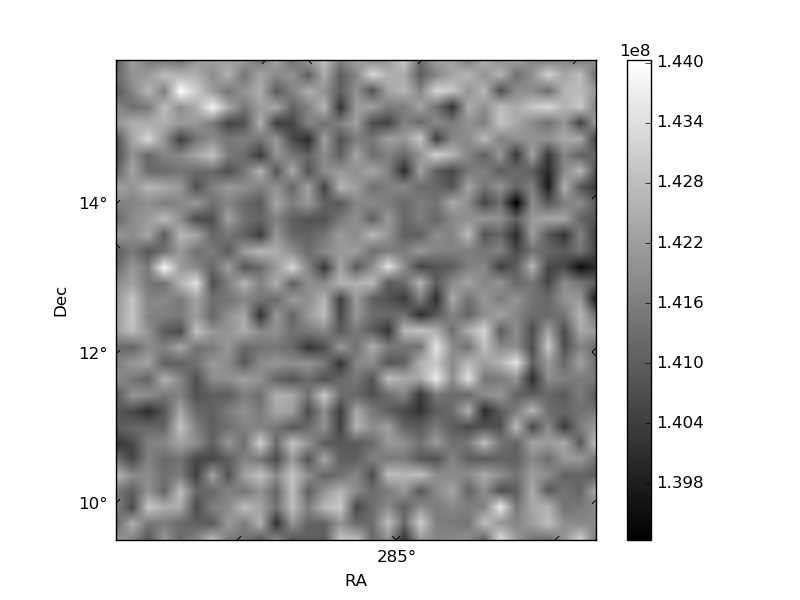
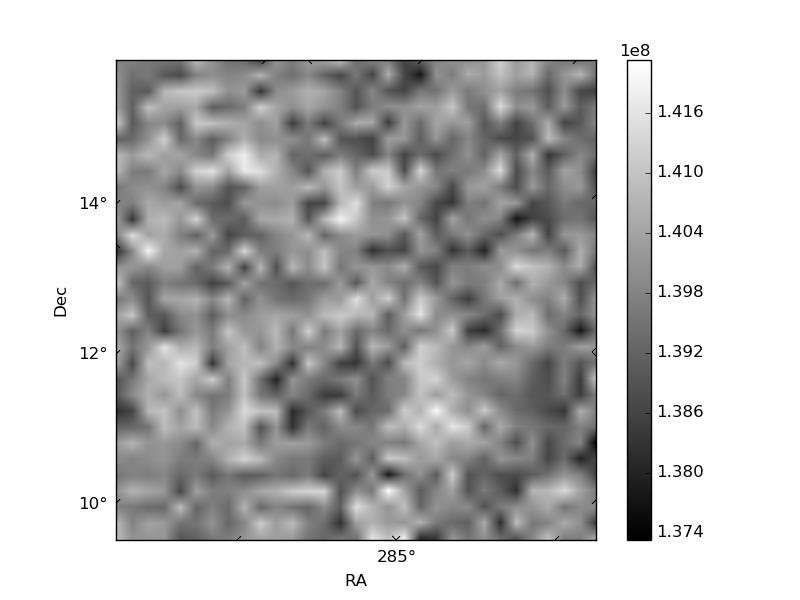
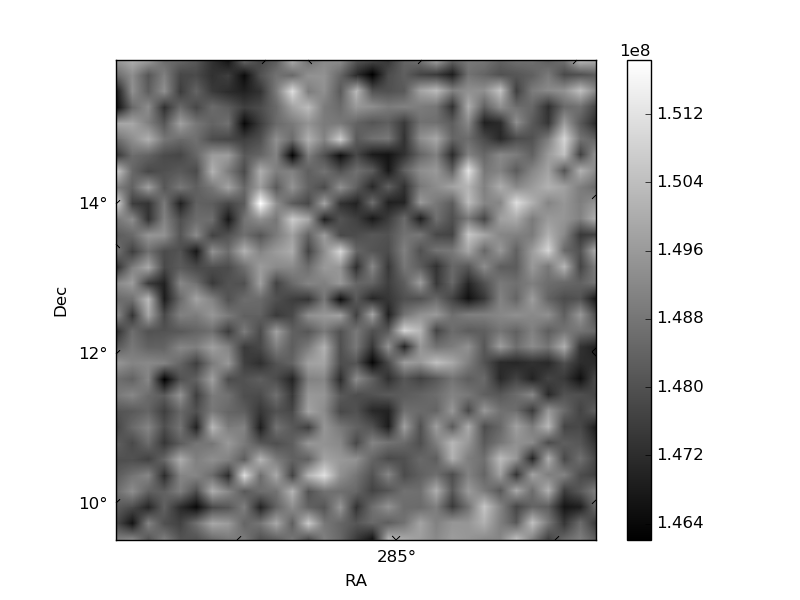
Histogram calculated using DETX and DETY for each event in the final _common_clean file
| Quadrant A | 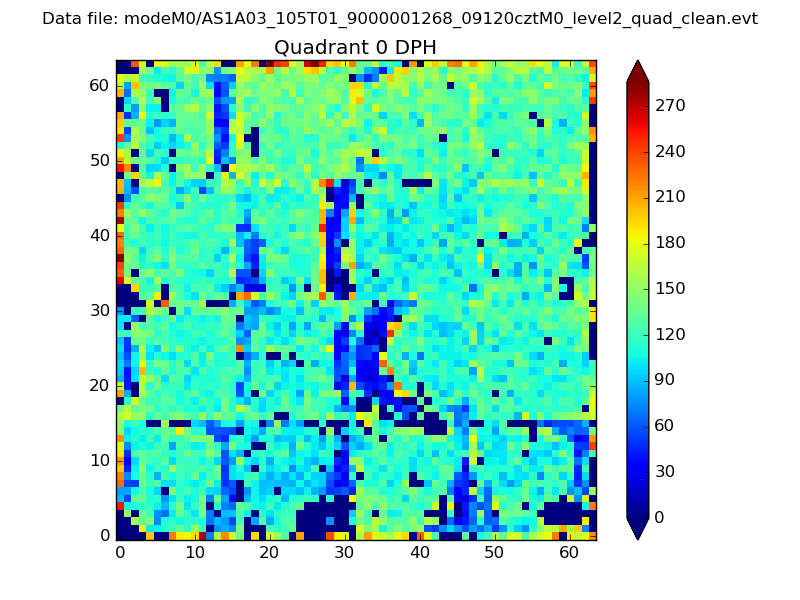 |
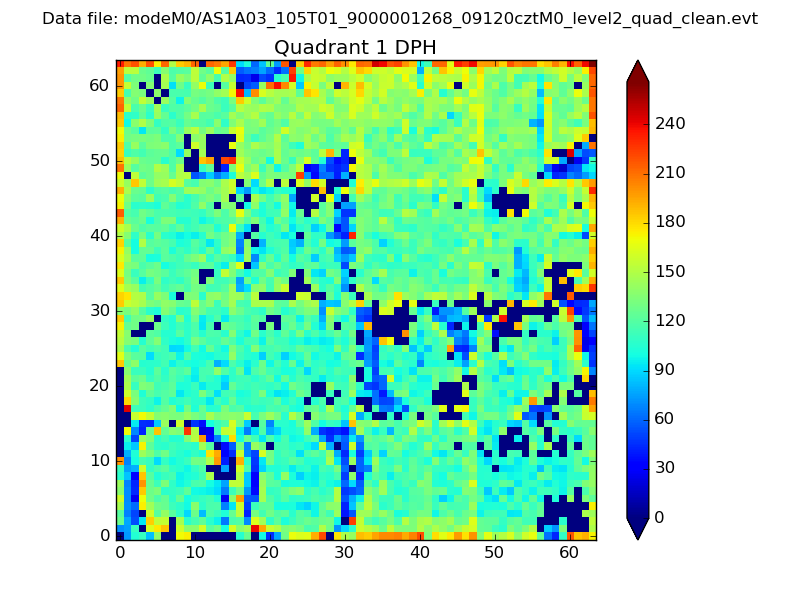 |
Quadrant B |
|---|---|---|---|
| Quadrant D | 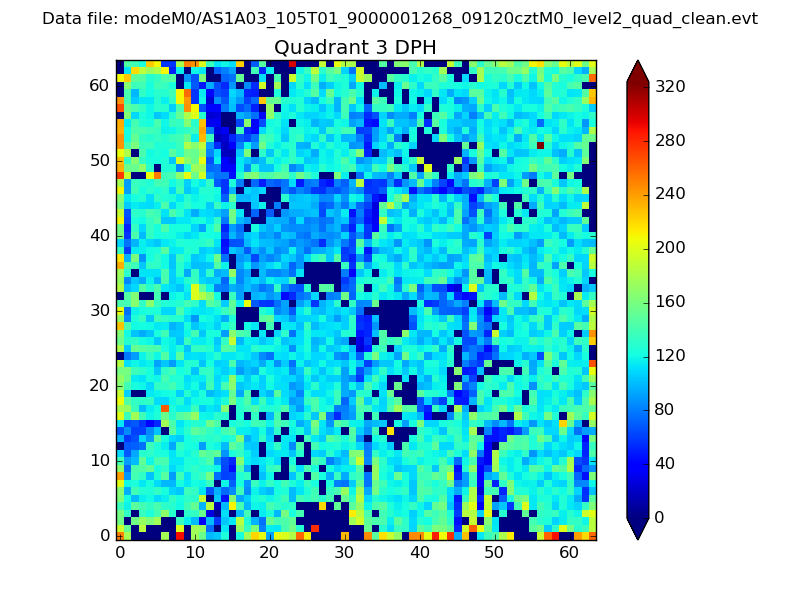 |
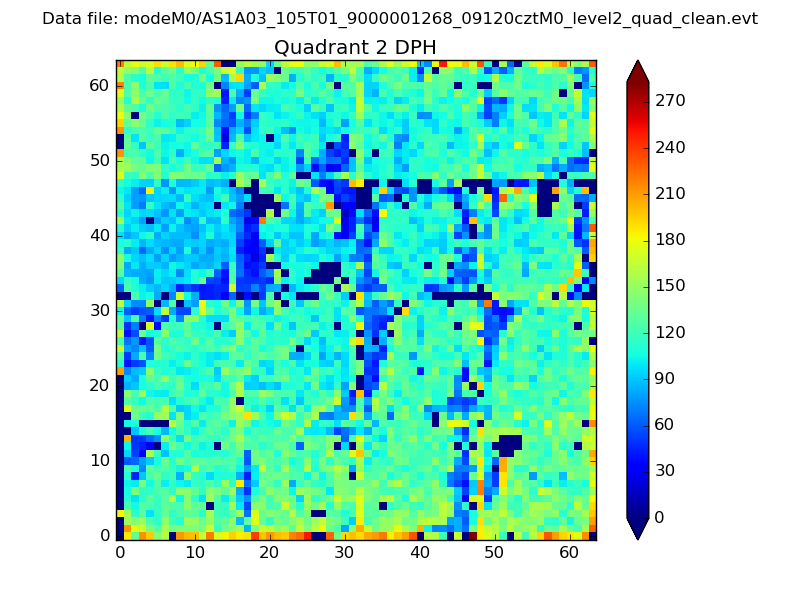 |
Quadrant C |
| Plot type | Count rate plots | Images |
|---|---|---|
| Comparison with Poisson distribution Blue bars denote a histogram of data divided into 1 sec bins. Red curve is a Poisson curve with rate = median count rate of data. |
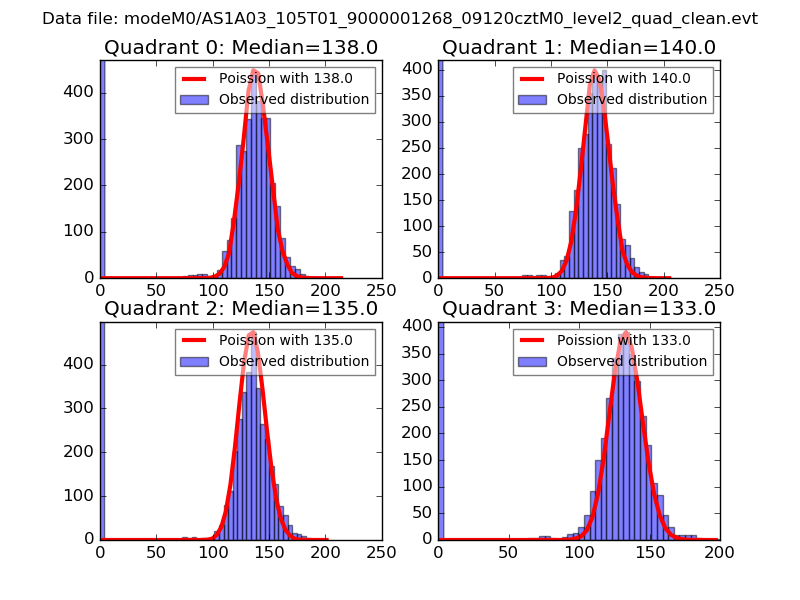 |
 |
| Quadrant-wise count rates Data is divided into 100 sec bins |
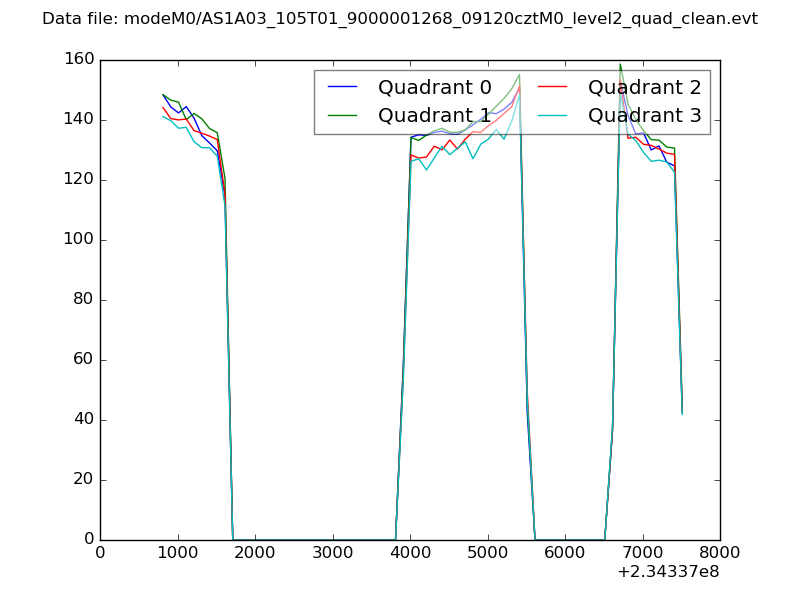 |
|
| Module-wise count rates for Quadrant A Data is divided into 100 sec bins |
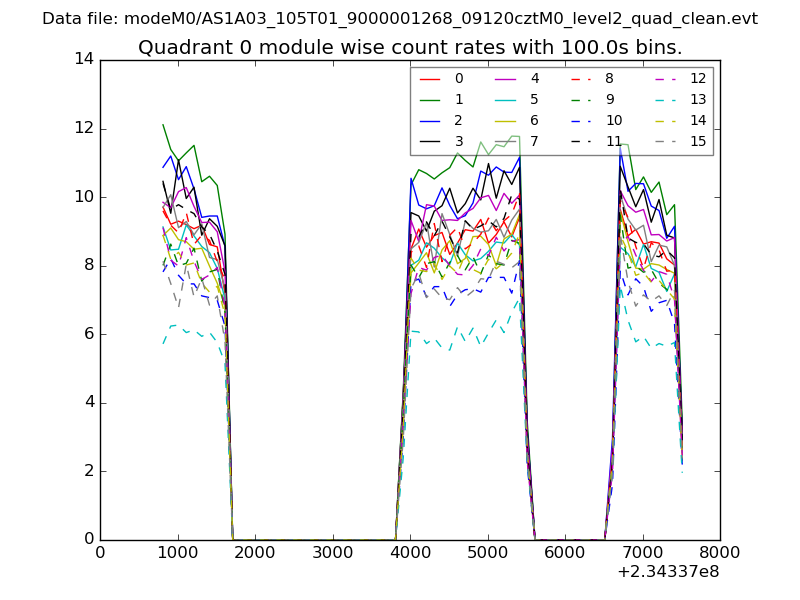 |
 |
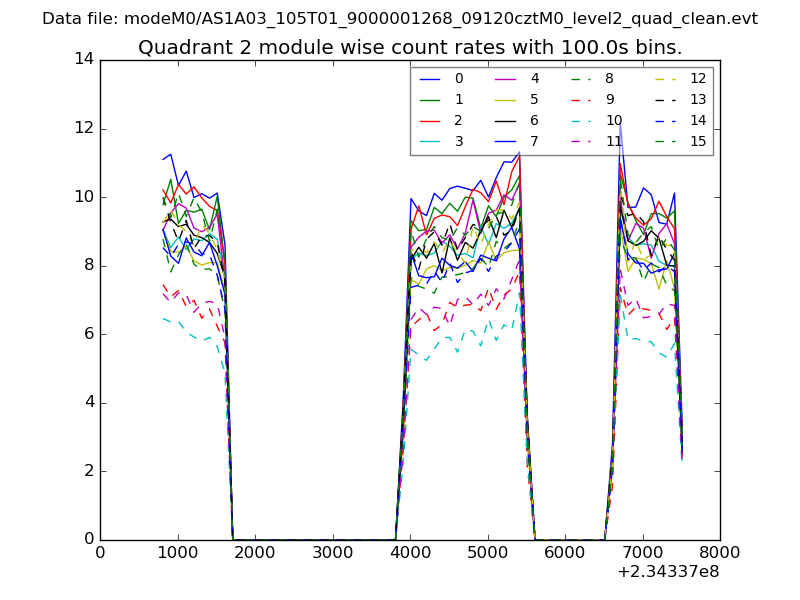
| Module-wise count rates for Quadrant B Data is divided into 100 sec bins |
 |
 |
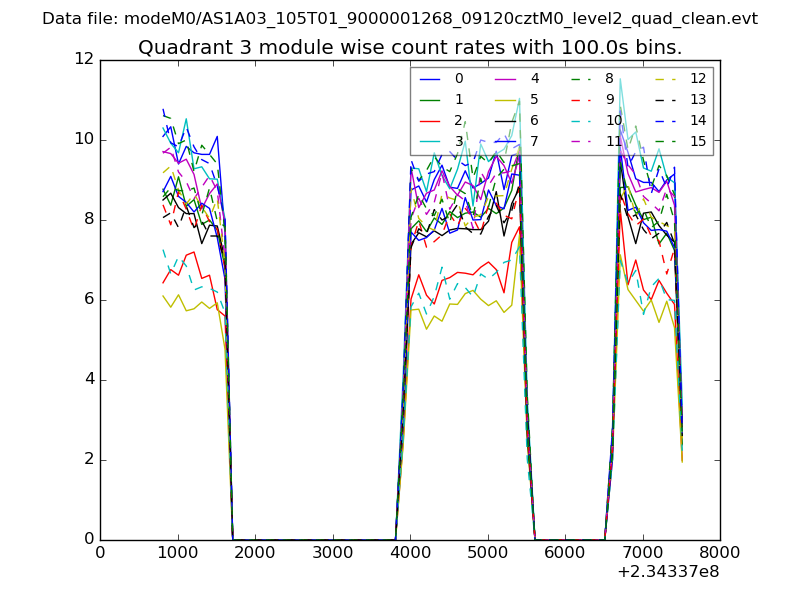
| Module-wise count rates for Quadrant C Data is divided into 100 sec bins |
 |
 |
| Module-wise count rates for Quadrant D Data is divided into 100 sec bins |
 |
 |
| Parameter | Plot |
|---|---|
| CZT HV Monitor | 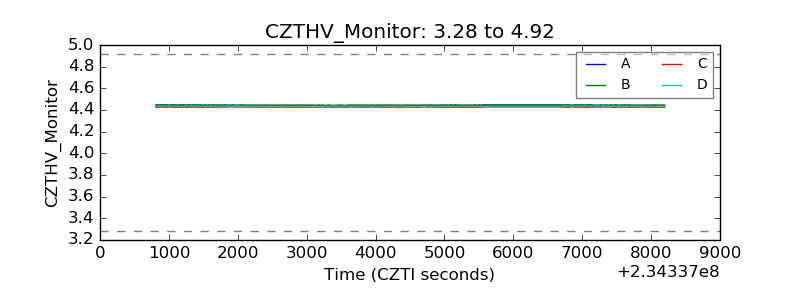 |
| D_VDD | 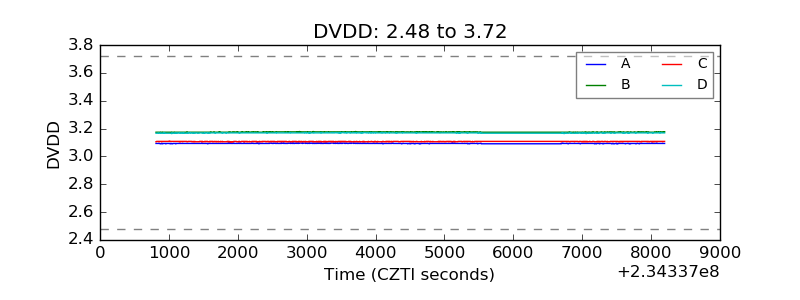 |
| Temperature 1 | 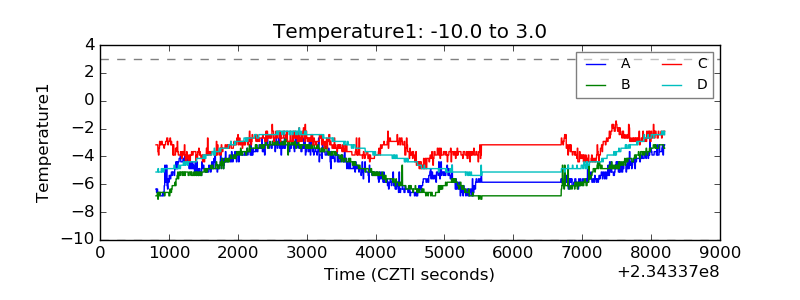 |
| Veto HV Monitor |  |
| Veto LLD | 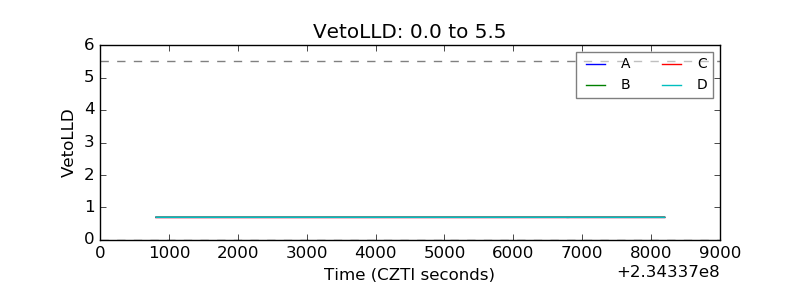 |
| Alpha Counter | 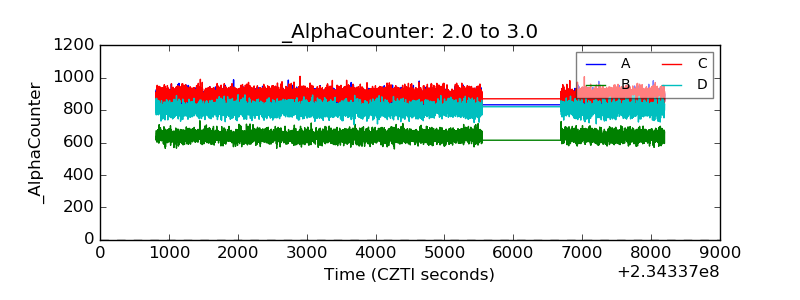 |
| _CPM_Rate | 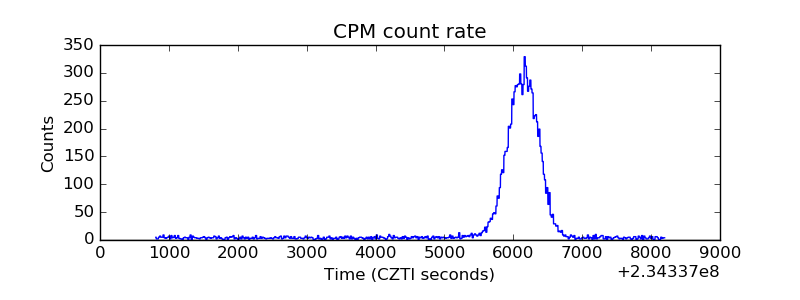 |
| CZT Counter | 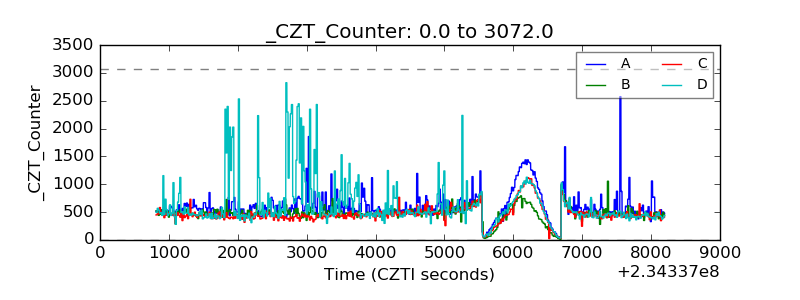 |
| +2.5 Volts monitor |  |
| +5 Volts monitor |  |
| _ROLL_ROT | 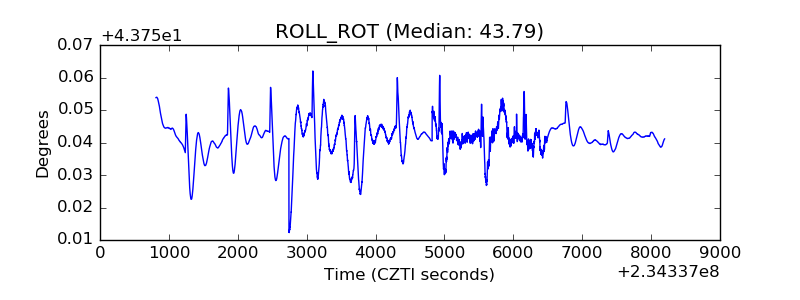 |
| _Roll_DEC | 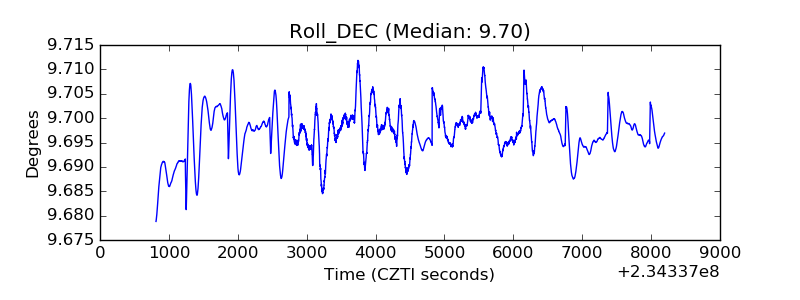 |
| _Roll_RA |  |
| Veto Counter | 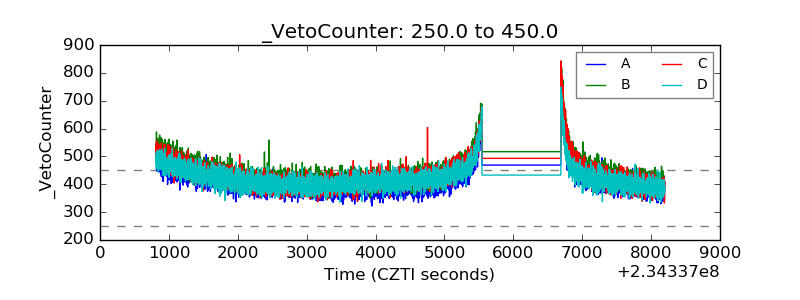 |