| Param | Original file | Final file |
|---|---|---|
| Filename | modeM0/AS1A03_105T01_9000001268_09121cztM0_level2.evt | modeM0/AS1A03_105T01_9000001268_09121cztM0_level2_quad_clean.evt |
| Size (bytes) | 496,488,960 | 79,251,840 |
| Size | 473.5 MB | 75.6 MB |
| Events in quadrant A | 4,438,661 | 480,097 |
| Events in quadrant B | 3,394,890 | 490,157 |
| Events in quadrant C | 3,214,785 | 478,124 |
| Events in quadrant D | 3,515,621 | 466,745 |
| Mode M0 | |||
|---|---|---|---|
| Quadrant | BADHDUFLAG | Total packets | Discarded packets |
| A | 0 | 17606 | 3 |
| B | 0 | 14452 | 2 |
| C | 0 | 14297 | 2 |
| D | 0 | 15169 | 2 |
| Mode SS | |||
|---|---|---|---|
| Quadrant | BADHDUFLAG | Total packets | Discarded packets |
| A | 0 | 142 | 0 |
| B | 0 | 142 | 0 |
| C | 0 | 142 | 0 |
| D | 0 | 142 | 0 |
| Mode M9 | |||
|---|---|---|---|
| Quadrant | BADHDUFLAG | Total packets | Discarded packets |
| A | 0 | 12 | 0 |
| B | 0 | 12 | 0 |
| C | 0 | 12 | 0 |
| D | 0 | 13 | 0 |
| Quadrant | Total seconds | Saturated seconds | Saturation percentage |
|---|---|---|---|
| A | 6951 | 210 | 3.021148% |
| B | 6951 | 125 | 1.798302% |
| C | 6951 | 63 | 0.906344% |
| D | 6951 | 109 | 1.568120% |
Noise dominated data is calculated using 1-second bins in cleaned event files. If a bin has >2000 counts, and if more than 50% of those come from <1% of pixels, then it is considered to be noise-dominated and hence unusable.
| Quadrant | # 1 sec bins | Bins with >0 counts | Bins with >2000 counts | High rate bins dominated by noise | Noise dominated (total time) | Noise dominated (detector-on time) | Marked lightcurve |
|---|---|---|---|---|---|---|---|
| A | 7736 | 6951 | 41 | 41 | 0.53% | 0.59% | 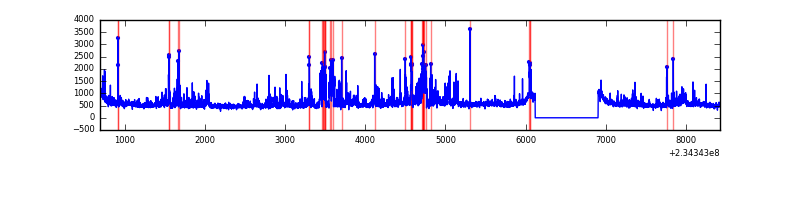 |
| B | 7736 | 6951 | 1 | 1 | 0.01% | 0.01% | 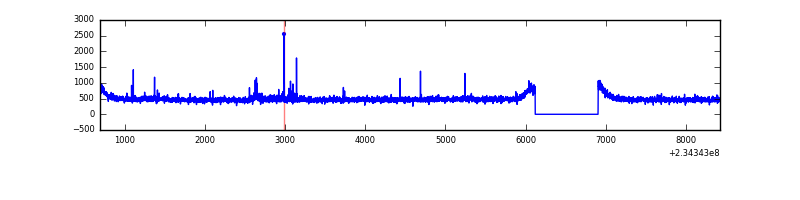 |
| C | 7736 | 6951 | 0 | 0 | 0.00% | 0.00% | 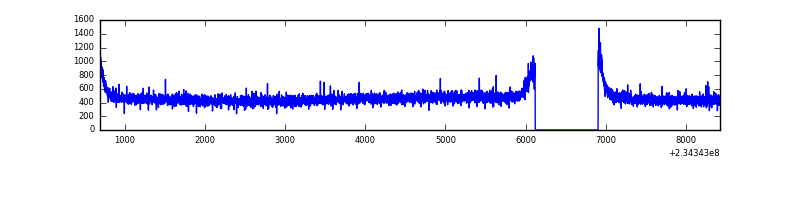 |
| D | 7736 | 6951 | 20 | 20 | 0.26% | 0.29% | 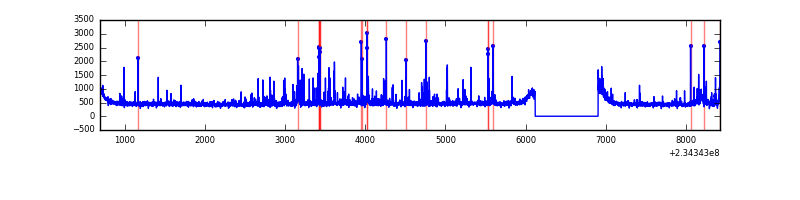 |
Top three noisy pixels from each quadrant. If the there are fewer than three noisy pixels in the level2.evt file, extra rows are filled as -1
| Pixel properties | Quadrant properties | ||||||
|---|---|---|---|---|---|---|---|
| Quadrant | DetID | PixID | Counts | Sigma | Mean | Median | Sigma |
| A | 8 | 5 | 986076 | 5693.46 | 852 | 836 | 173.0 |
| A | 4 | 2 | 69821 | 398.65 | 852 | 836 | 173.0 |
| A | 1 | 162 | 43354 | 245.7 | 852 | 836 | 173.0 |
| B | 0 | 214 | 56571 | 333.21 | 856 | 837 | 167.3 |
| B | 12 | 111 | 18826 | 107.55 | 856 | 837 | 167.3 |
| B | 11 | 111 | 15368 | 86.87 | 856 | 837 | 167.3 |
| C | 13 | 61 | 6246 | 28.34 | 822 | 826 | 191.2 |
| C | 14 | 67 | 4451 | 18.95 | 822 | 826 | 191.2 |
| C | 12 | 4 | 3370 | 13.3 | 822 | 826 | 191.2 |
| D | 1 | 52 | 194379 | 952.06 | 824 | 803 | 203.3 |
| D | 2 | 14 | 89375 | 435.62 | 824 | 803 | 203.3 |
| D | 2 | 234 | 24671 | 117.39 | 824 | 803 | 203.3 |
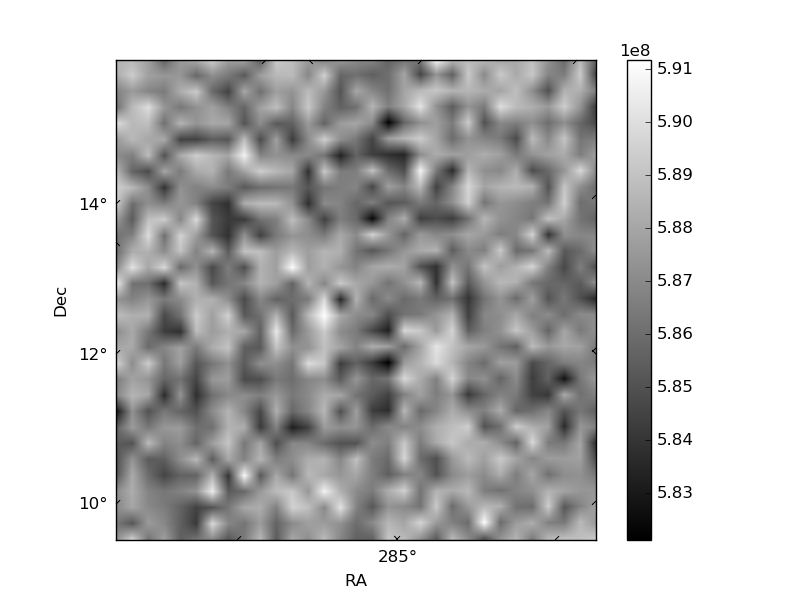
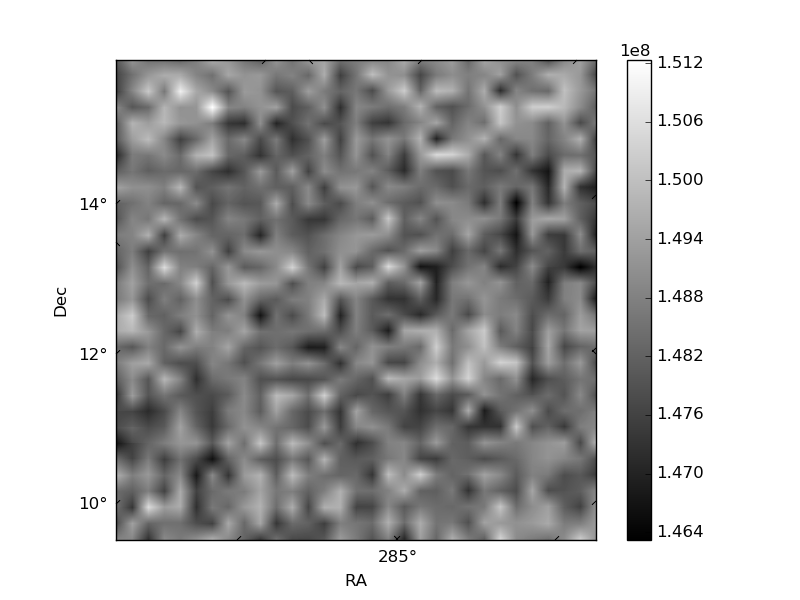
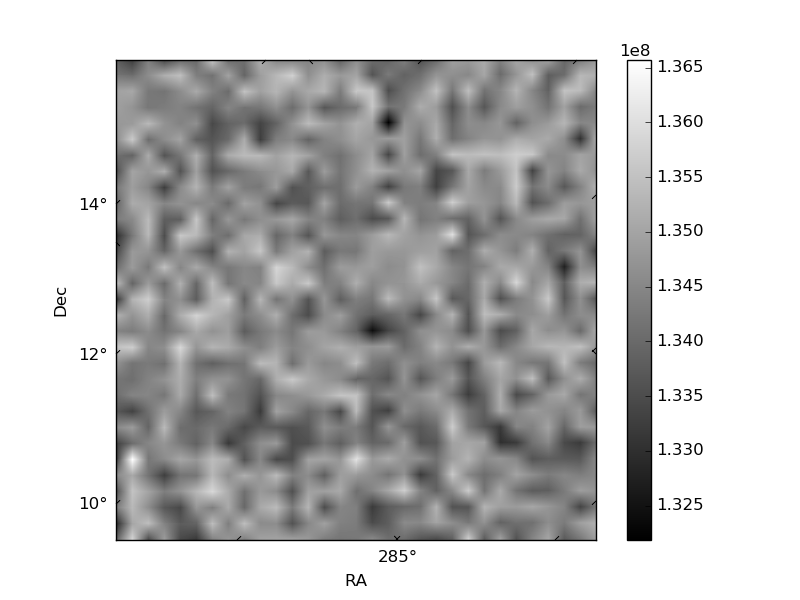
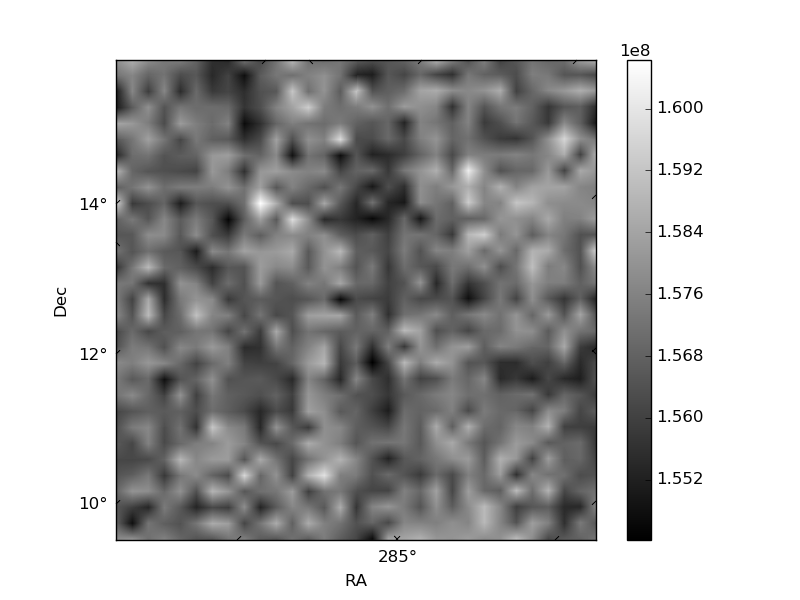
Histogram calculated using DETX and DETY for each event in the final _common_clean file
| Quadrant A | 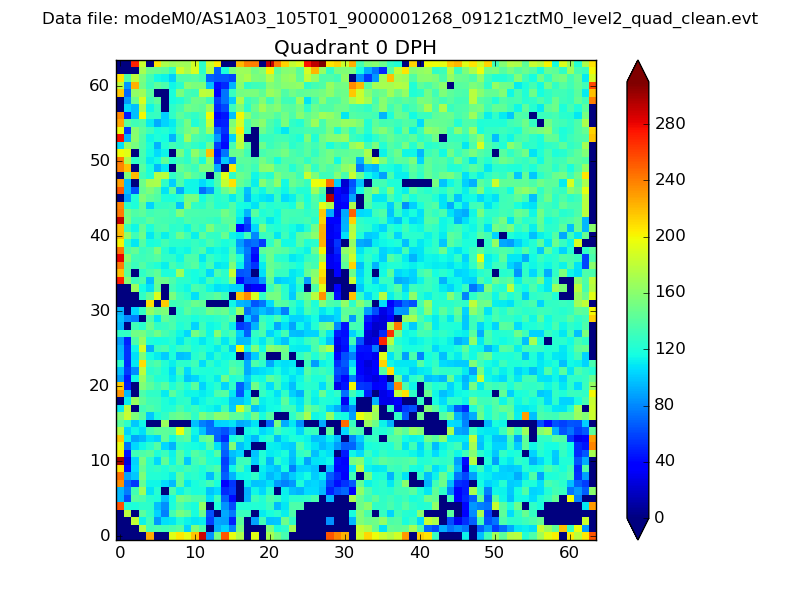 |
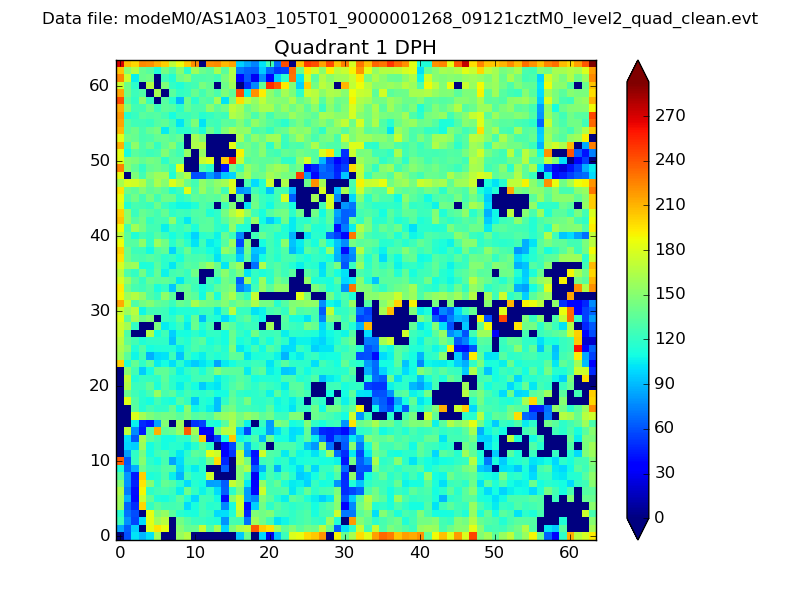 |
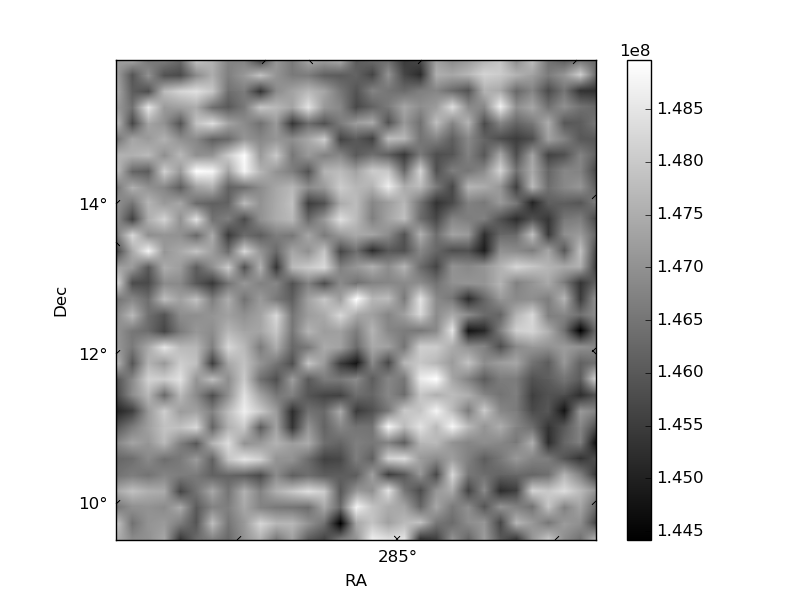
Quadrant B |
|---|---|---|---|
| Quadrant D | 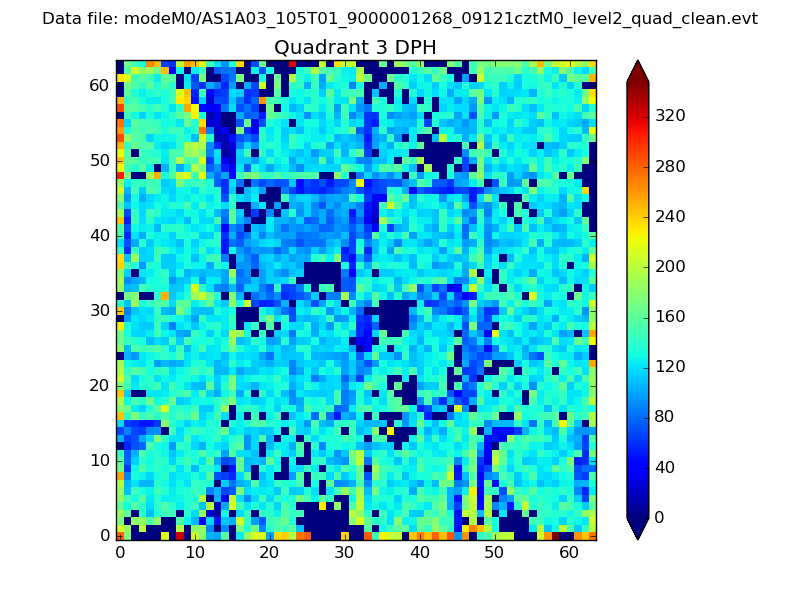 |
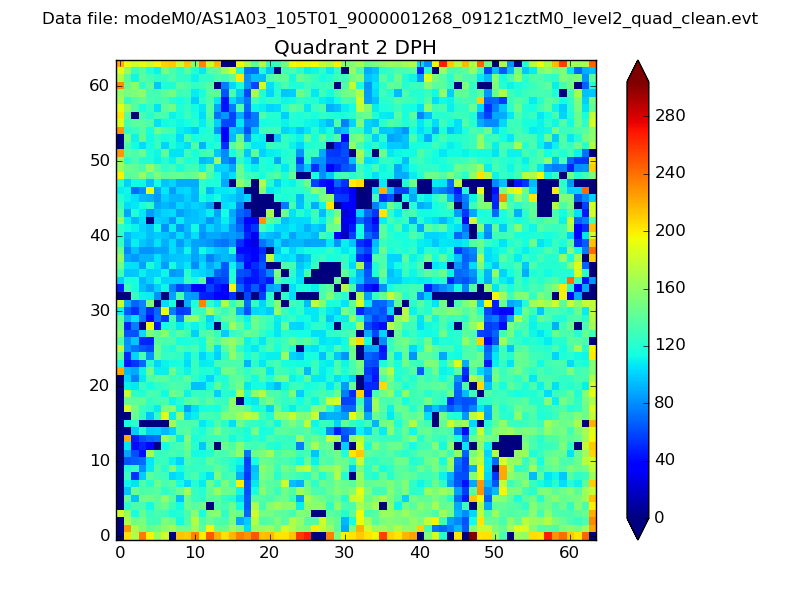 |
Quadrant C |
| Plot type | Count rate plots | Images |
|---|---|---|
| Comparison with Poisson distribution Blue bars denote a histogram of data divided into 1 sec bins. Red curve is a Poisson curve with rate = median count rate of data. |
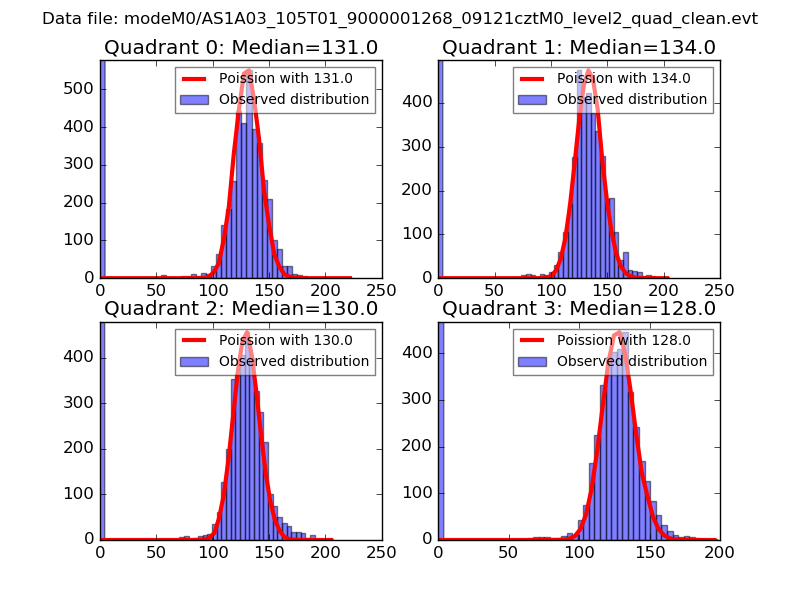 |
 |
| Quadrant-wise count rates Data is divided into 100 sec bins |
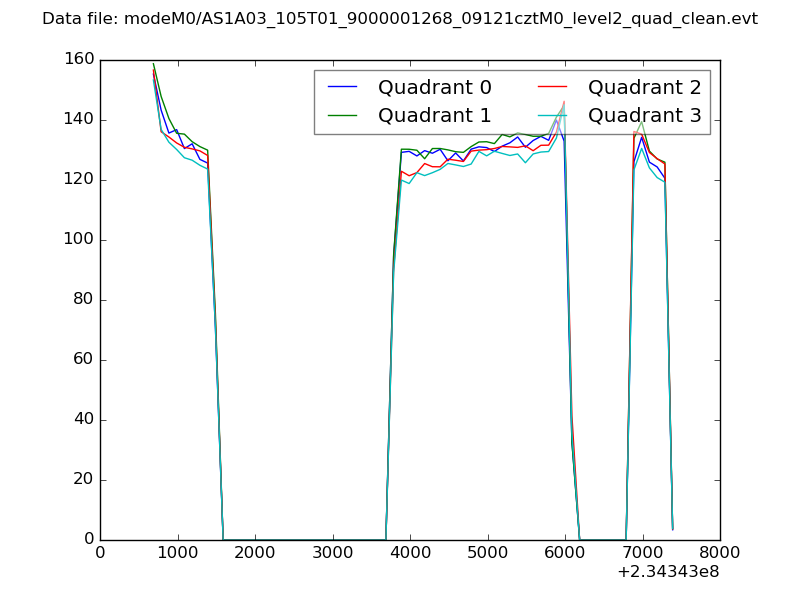 |
|
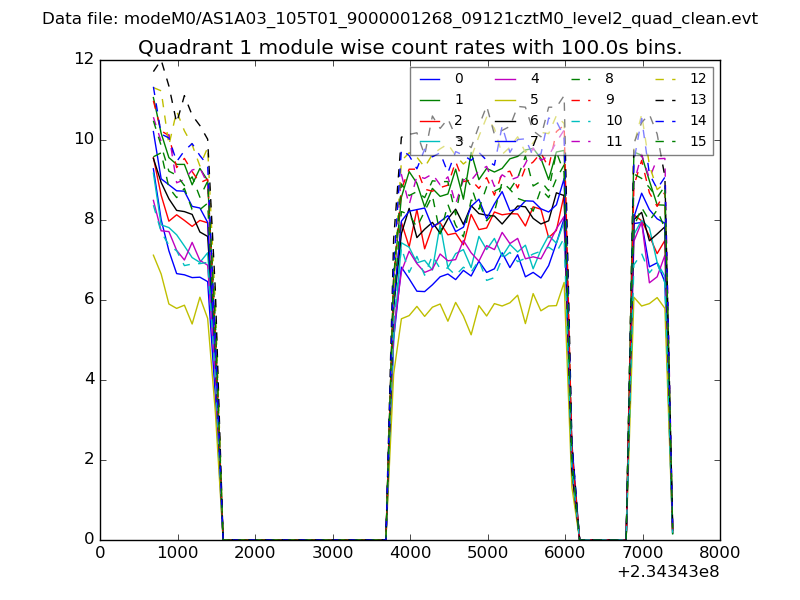
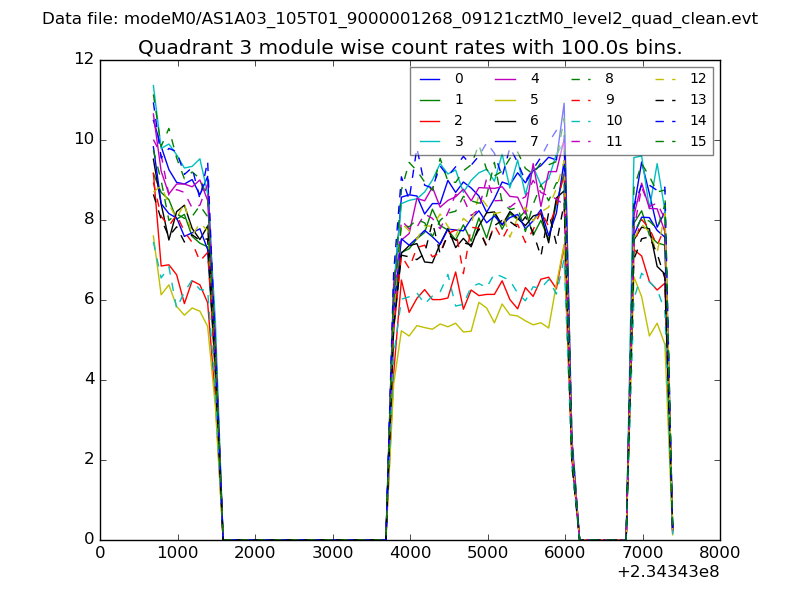
| Module-wise count rates for Quadrant A Data is divided into 100 sec bins |
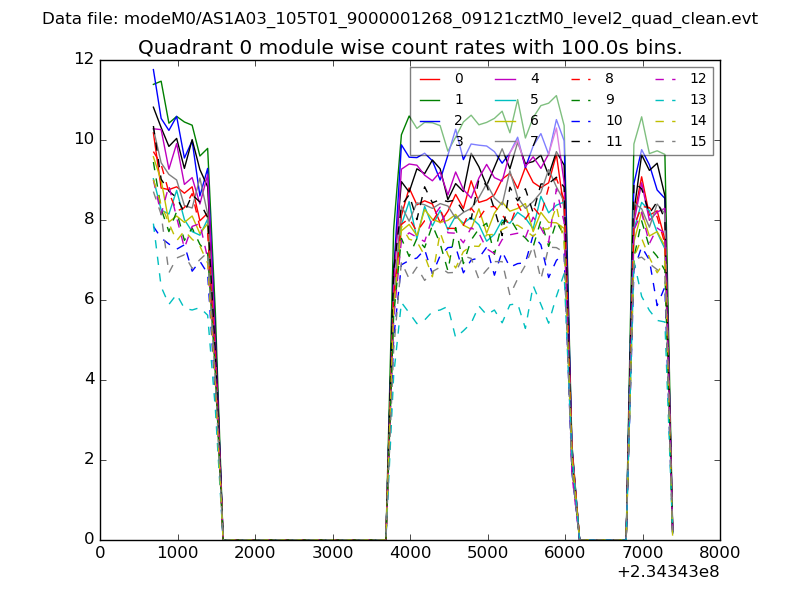 |
 |
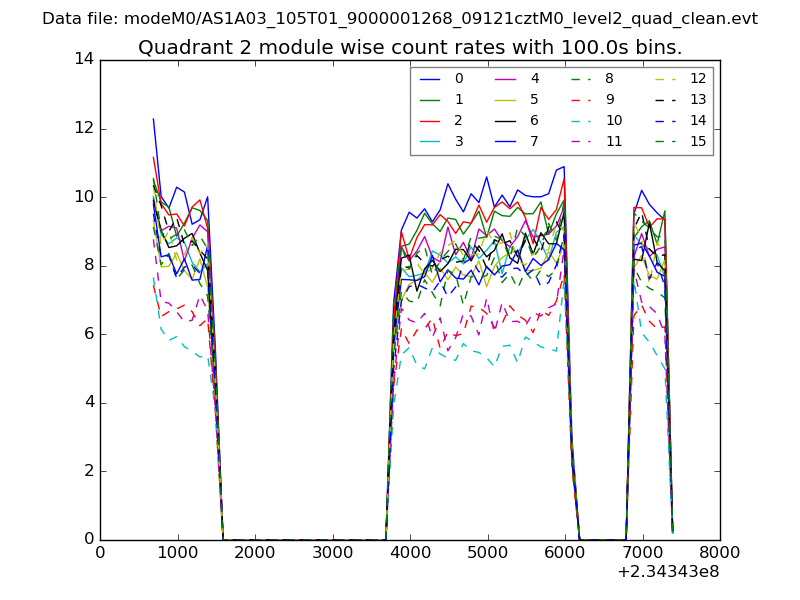
| Module-wise count rates for Quadrant B Data is divided into 100 sec bins |
 |
 |
| Module-wise count rates for Quadrant C Data is divided into 100 sec bins |
 |
 |
| Module-wise count rates for Quadrant D Data is divided into 100 sec bins |
 |
 |
| Parameter | Plot |
|---|---|
| CZT HV Monitor | 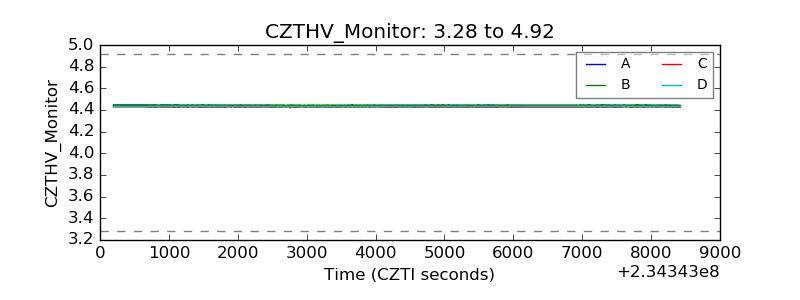 |
| D_VDD | 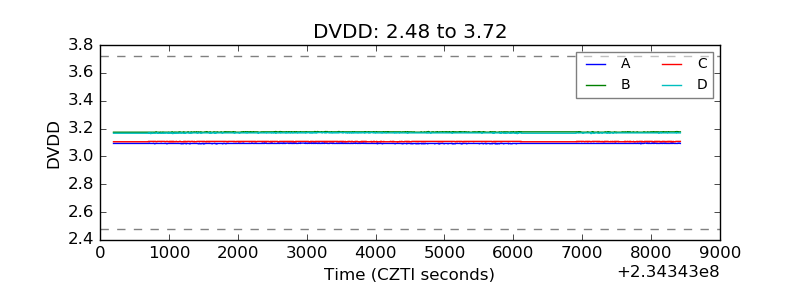 |
| Temperature 1 | 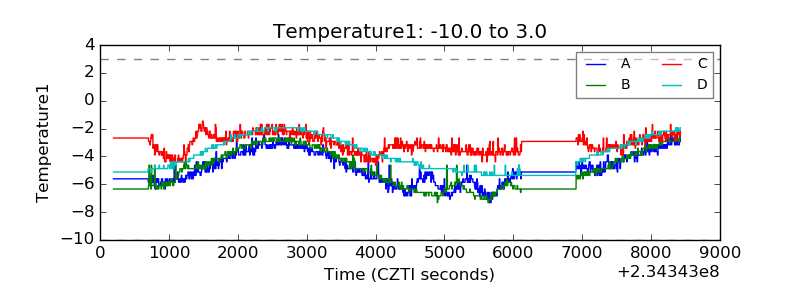 |
| Veto HV Monitor | 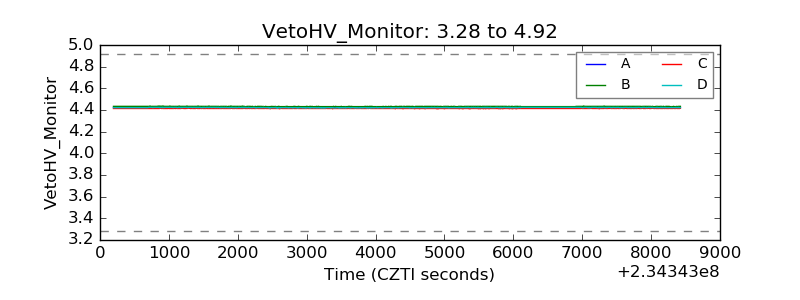 |
| Veto LLD | 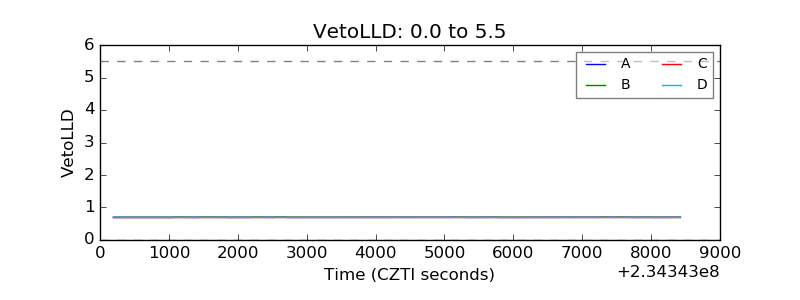 |
| Alpha Counter | 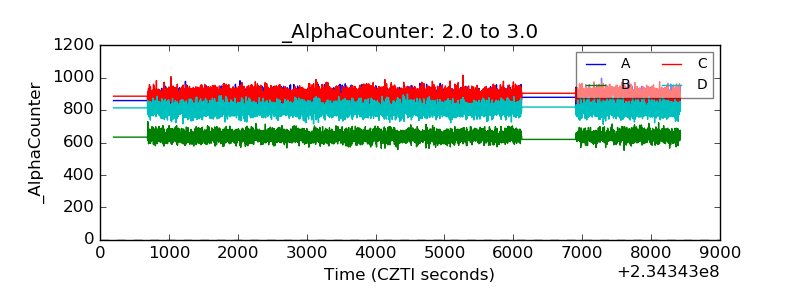 |
| _CPM_Rate | 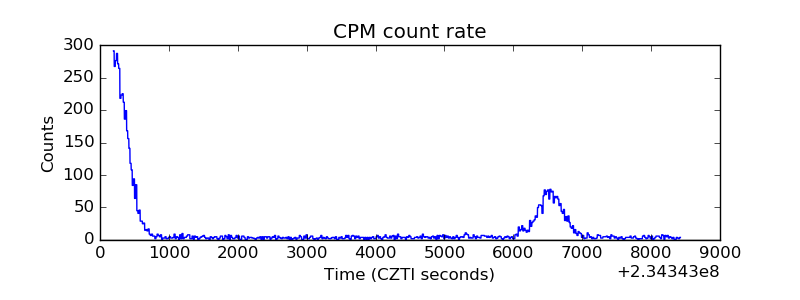 |
| CZT Counter | 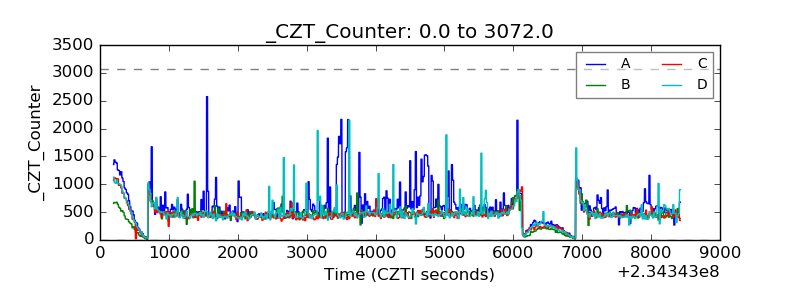 |
| +2.5 Volts monitor |  |
| +5 Volts monitor |  |
| _ROLL_ROT | 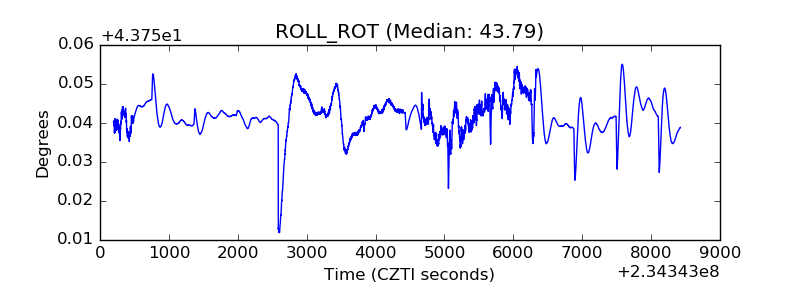 |
| _Roll_DEC | 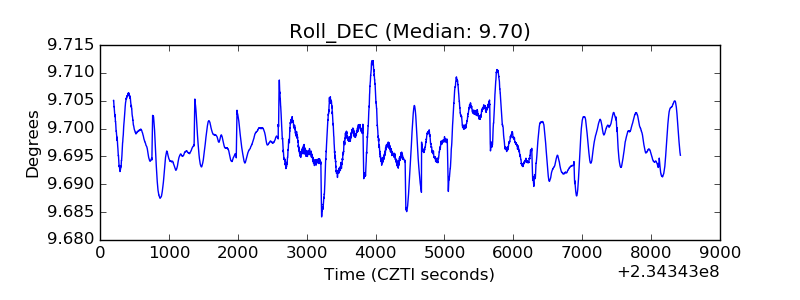 |
| _Roll_RA | 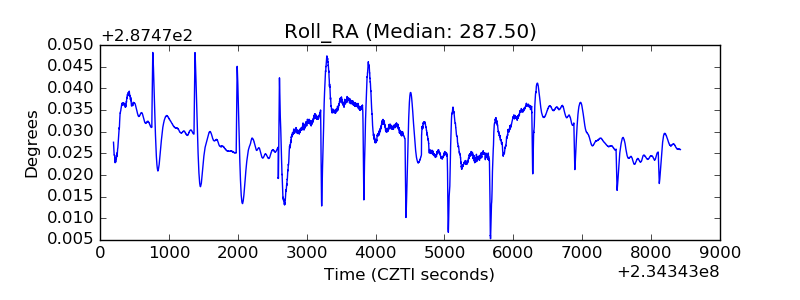 |
| Veto Counter | 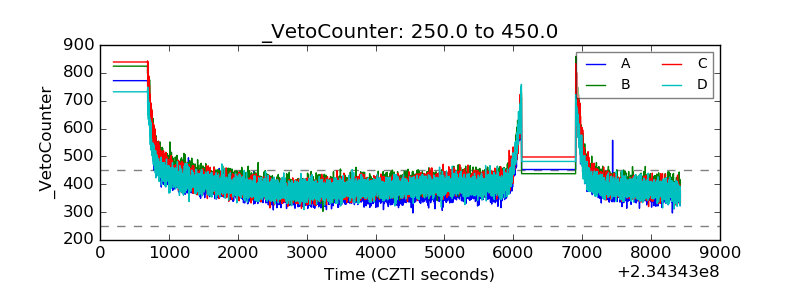 |