| Param | Original file | Final file |
|---|---|---|
| Filename | modeM0/AS1A03_105T01_9000001268_09122cztM0_level2.evt | modeM0/AS1A03_105T01_9000001268_09122cztM0_level2_quad_clean.evt |
| Size (bytes) | 501,819,840 | 75,542,400 |
| Size | 478.6 MB | 72.0 MB |
| Events in quadrant A | 4,263,331 | 450,226 |
| Events in quadrant B | 3,466,105 | 455,044 |
| Events in quadrant C | 3,292,229 | 447,036 |
| Events in quadrant D | 3,686,997 | 433,719 |
| Mode M0 | |||
|---|---|---|---|
| Quadrant | BADHDUFLAG | Total packets | Discarded packets |
| A | 0 | 17070 | 4 |
| B | 0 | 14923 | 1 |
| C | 0 | 14843 | 1 |
| D | 0 | 15968 | 1 |
| Mode SS | |||
|---|---|---|---|
| Quadrant | BADHDUFLAG | Total packets | Discarded packets |
| A | 0 | 148 | 0 |
| B | 0 | 148 | 0 |
| C | 0 | 148 | 0 |
| D | 0 | 148 | 0 |
| Mode M9 | |||
|---|---|---|---|
| Quadrant | BADHDUFLAG | Total packets | Discarded packets |
| A | 0 | 4 | 0 |
| B | 0 | 4 | 0 |
| C | 0 | 4 | 0 |
| D | 0 | 4 | 0 |
| Quadrant | Total seconds | Saturated seconds | Saturation percentage |
|---|---|---|---|
| A | 7197 | 251 | 3.487564% |
| B | 7198 | 136 | 1.889414% |
| C | 7198 | 97 | 1.347597% |
| D | 7198 | 166 | 2.306196% |
Noise dominated data is calculated using 1-second bins in cleaned event files. If a bin has >2000 counts, and if more than 50% of those come from <1% of pixels, then it is considered to be noise-dominated and hence unusable.
| Quadrant | # 1 sec bins | Bins with >0 counts | Bins with >2000 counts | High rate bins dominated by noise | Noise dominated (total time) | Noise dominated (detector-on time) | Marked lightcurve |
|---|---|---|---|---|---|---|---|
| A | 7533 | 7198 | 87 | 87 | 1.15% | 1.21% | 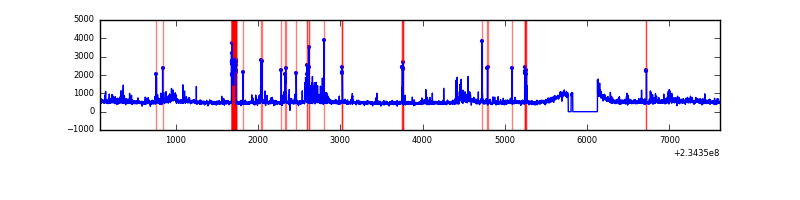 |
| B | 7533 | 7198 | 0 | 0 | 0.00% | 0.00% |  |
| C | 7533 | 7198 | 0 | 0 | 0.00% | 0.00% | 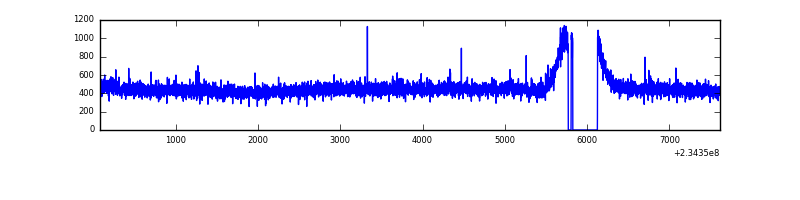 |
| D | 7533 | 7198 | 50 | 50 | 0.66% | 0.69% |  |
Top three noisy pixels from each quadrant. If the there are fewer than three noisy pixels in the level2.evt file, extra rows are filled as -1
| Pixel properties | Quadrant properties | ||||||
|---|---|---|---|---|---|---|---|
| Quadrant | DetID | PixID | Counts | Sigma | Mean | Median | Sigma |
| A | 8 | 5 | 816585 | 4601.25 | 869 | 851 | 177.3 |
| A | 1 | 162 | 40931 | 226.08 | 869 | 851 | 177.3 |
| A | 4 | 2 | 22923 | 124.5 | 869 | 851 | 177.3 |
| B | 0 | 214 | 54596 | 316.81 | 873 | 852 | 169.6 |
| B | 12 | 111 | 19373 | 109.18 | 873 | 852 | 169.6 |
| B | 11 | 111 | 15638 | 87.16 | 873 | 852 | 169.6 |
| C | 13 | 61 | 6251 | 27.41 | 842 | 846 | 197.2 |
| C | 14 | 67 | 3826 | 15.11 | 842 | 846 | 197.2 |
| C | 12 | 4 | 3171 | 11.79 | 842 | 846 | 197.2 |
| D | 1 | 52 | 259435 | 1241.71 | 837 | 815 | 208.3 |
| D | 2 | 14 | 202883 | 970.19 | 837 | 815 | 208.3 |
| D | 2 | 234 | 25862 | 120.26 | 837 | 815 | 208.3 |
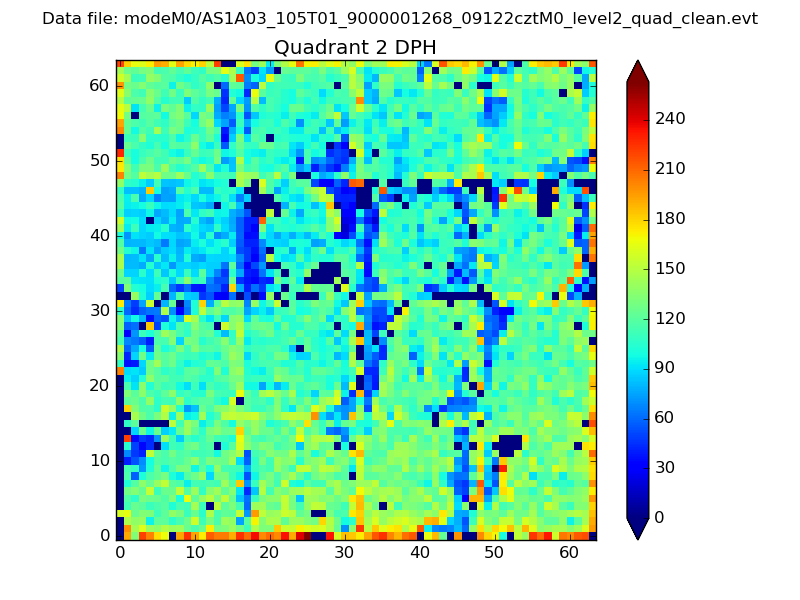
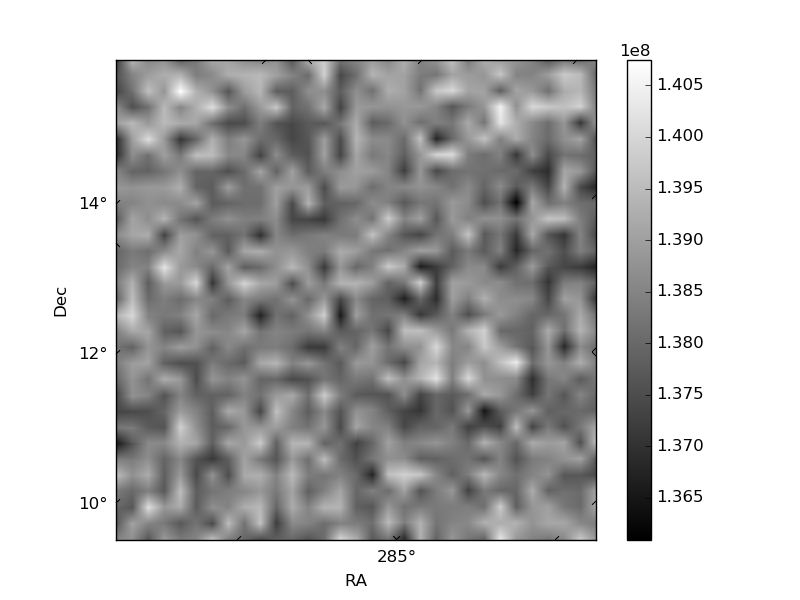
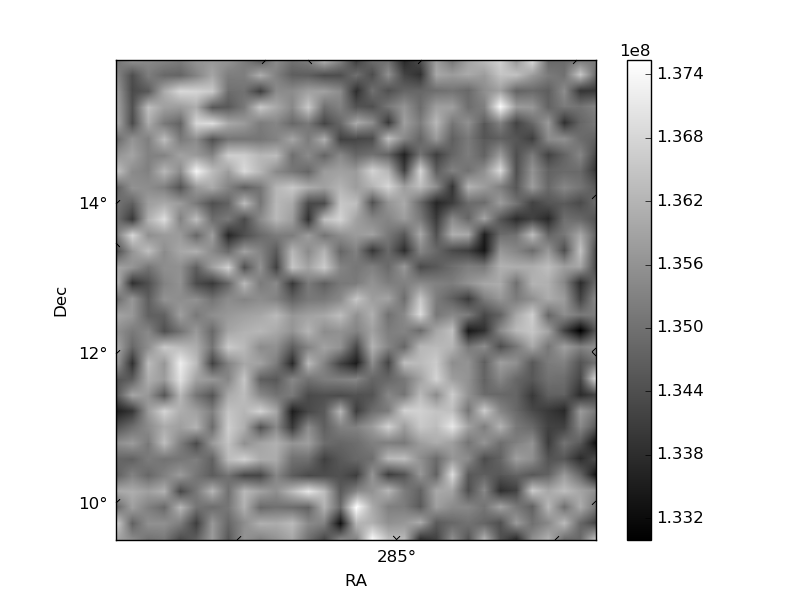
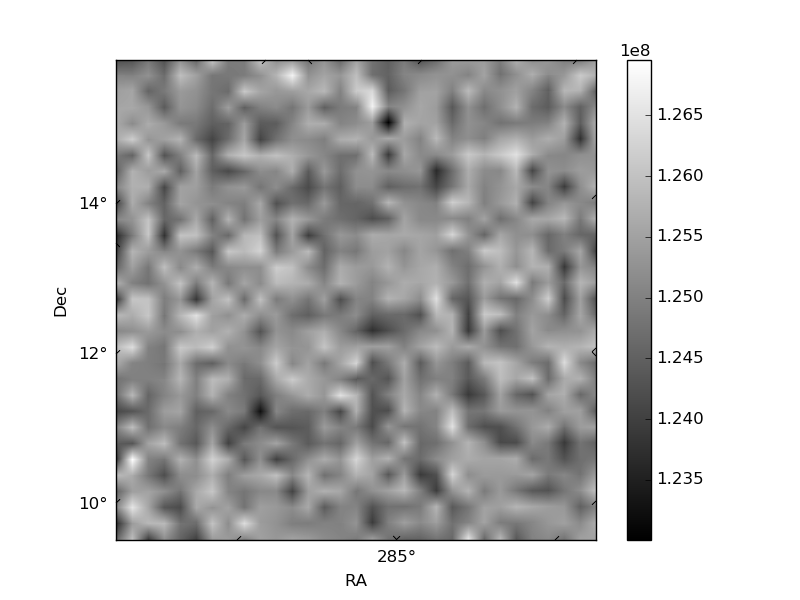
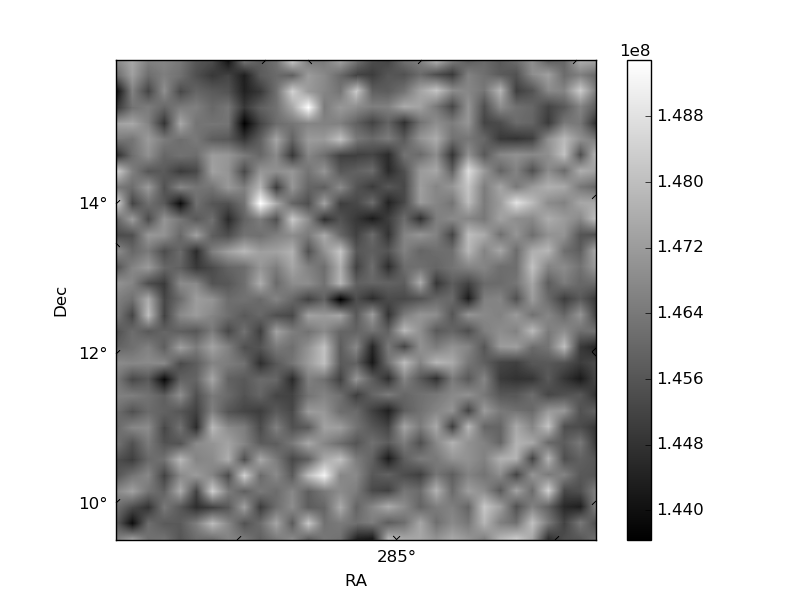
Histogram calculated using DETX and DETY for each event in the final _common_clean file
| Quadrant A | 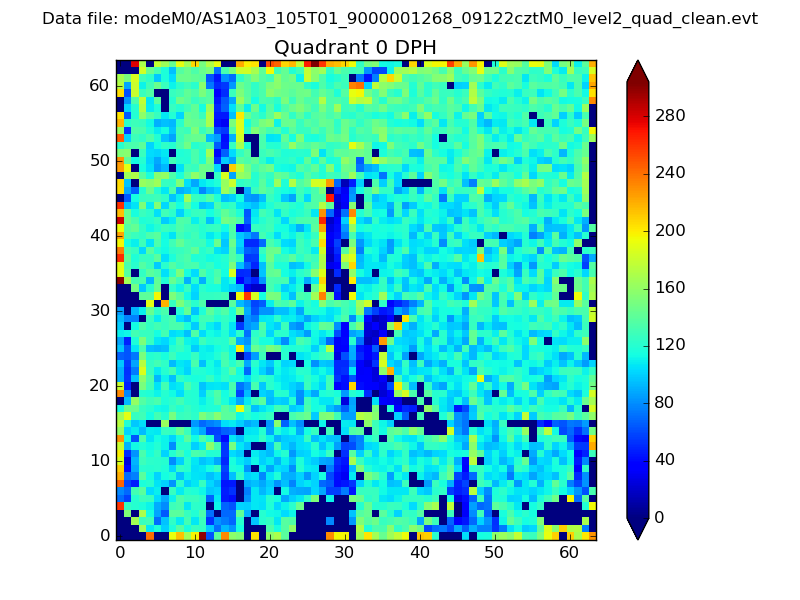 |
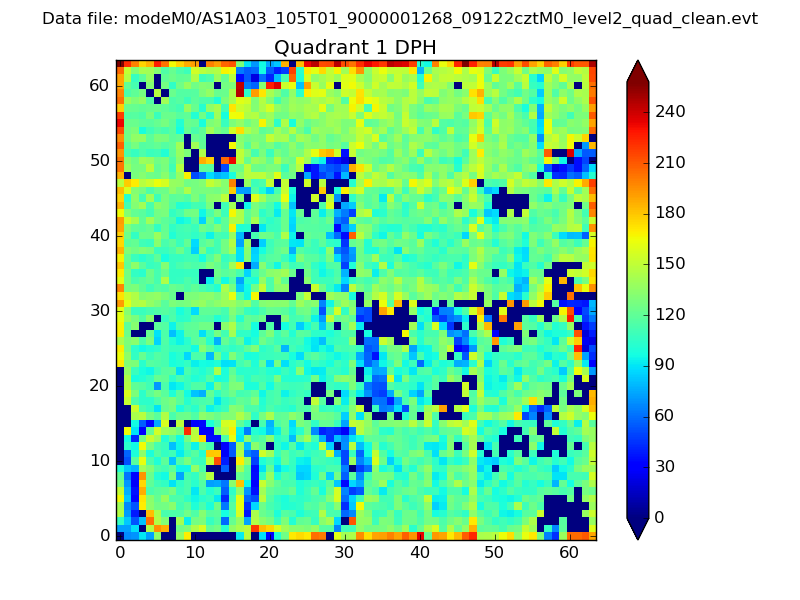 |
Quadrant B |
|---|---|---|---|
| Quadrant D | 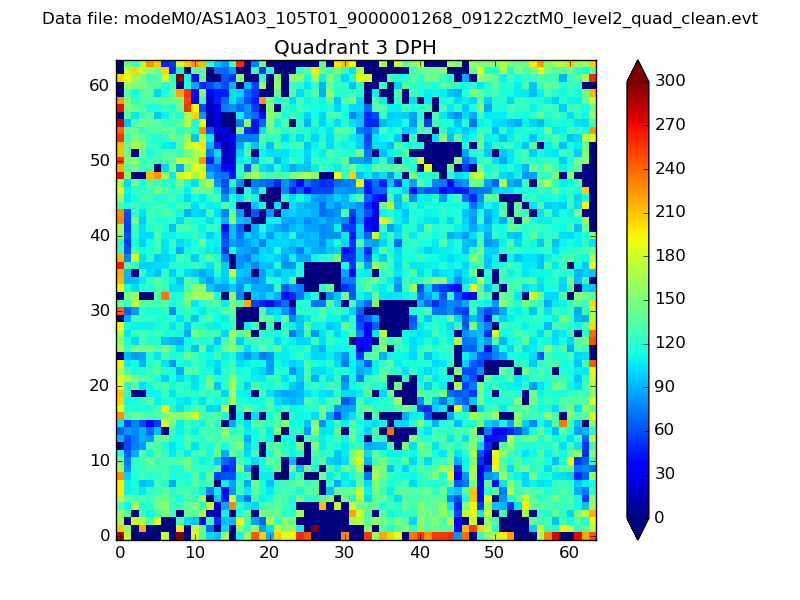 |
 |
Quadrant C |
| Plot type | Count rate plots | Images |
|---|---|---|
| Comparison with Poisson distribution Blue bars denote a histogram of data divided into 1 sec bins. Red curve is a Poisson curve with rate = median count rate of data. |
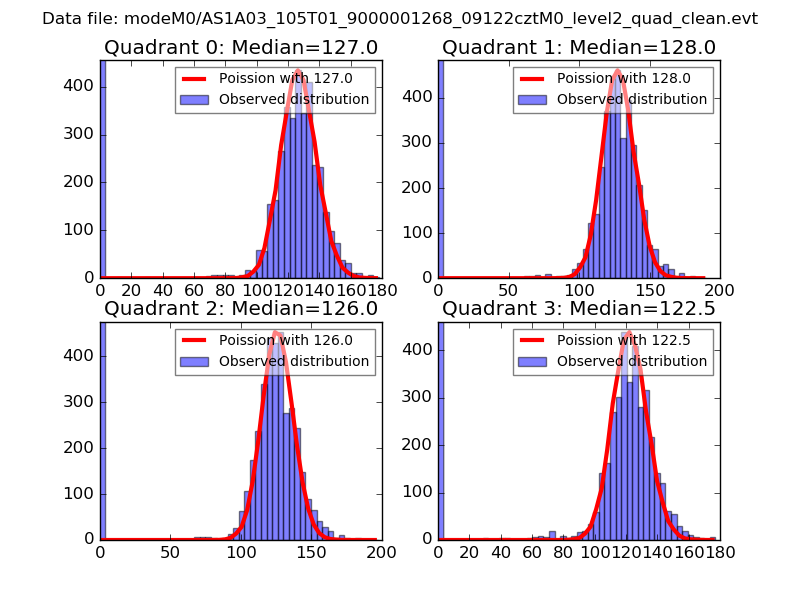 |
 |
| Quadrant-wise count rates Data is divided into 100 sec bins |
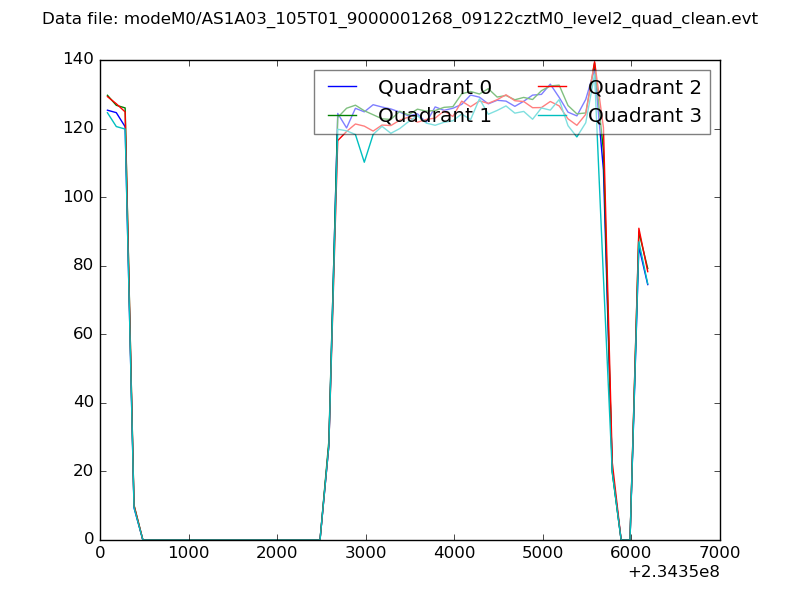 |
|
| Module-wise count rates for Quadrant A Data is divided into 100 sec bins |
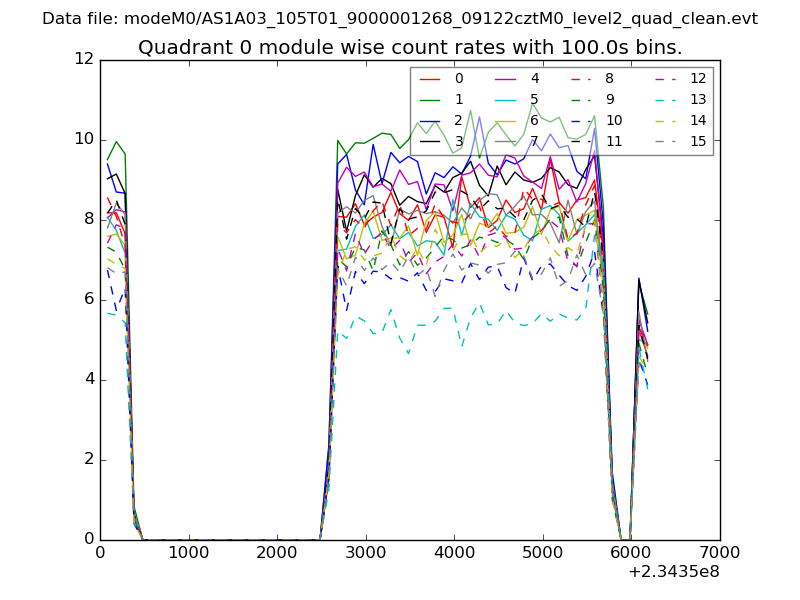 |
 |
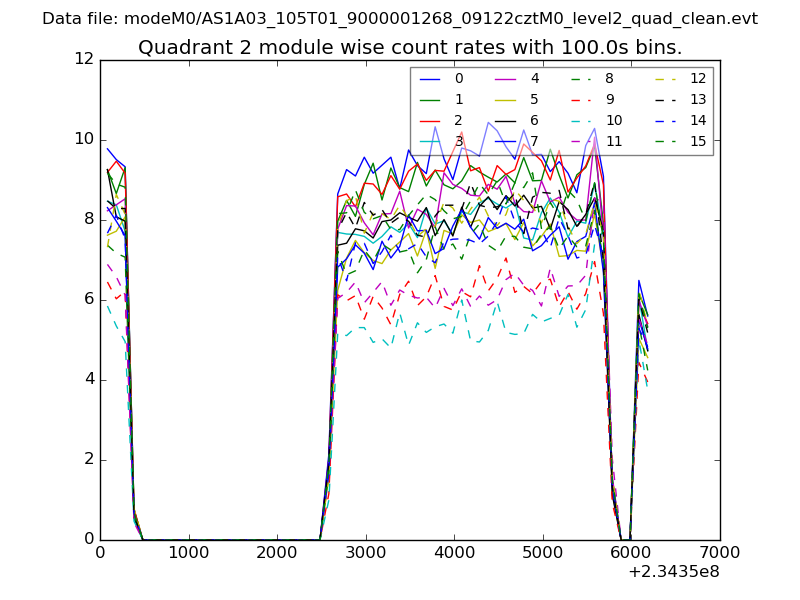
| Module-wise count rates for Quadrant B Data is divided into 100 sec bins |
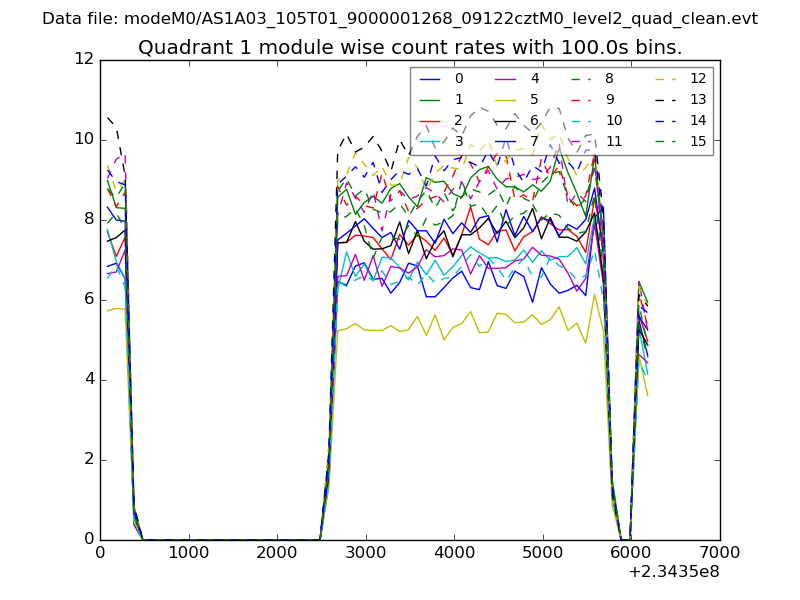 |
 |
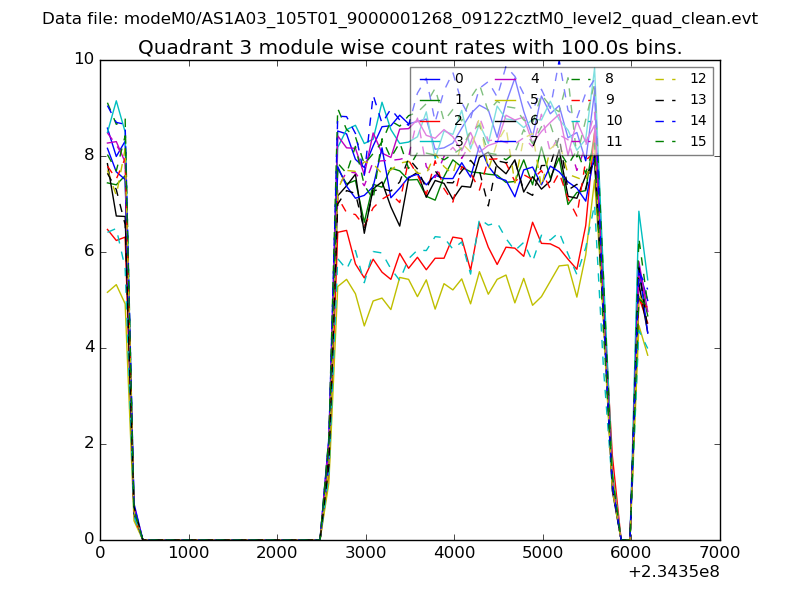
| Module-wise count rates for Quadrant C Data is divided into 100 sec bins |
 |
 |
| Module-wise count rates for Quadrant D Data is divided into 100 sec bins |
 |
 |
| Parameter | Plot |
|---|---|
| CZT HV Monitor | 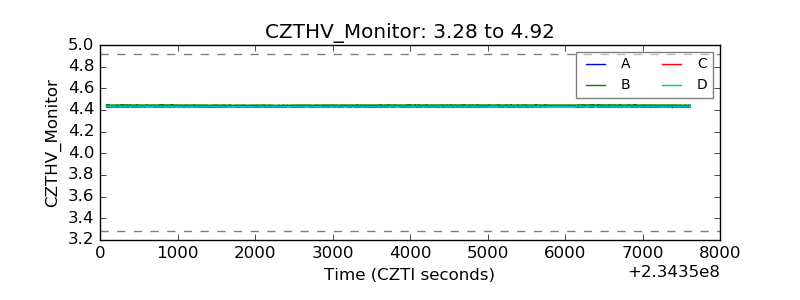 |
| D_VDD | 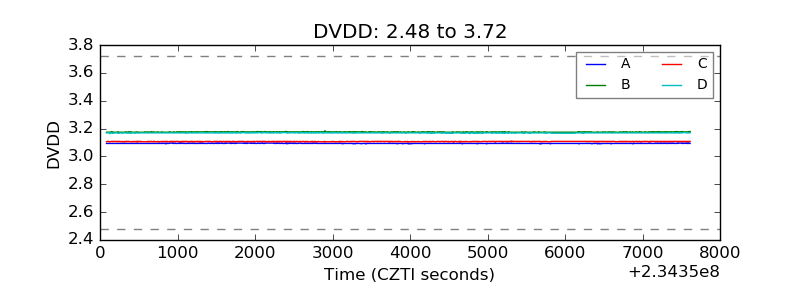 |
| Temperature 1 |  |
| Veto HV Monitor | 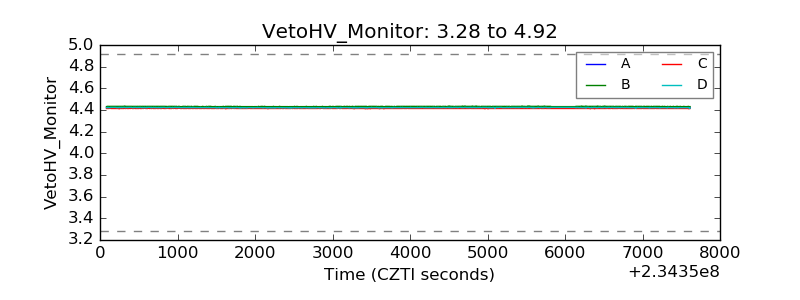 |
| Veto LLD | 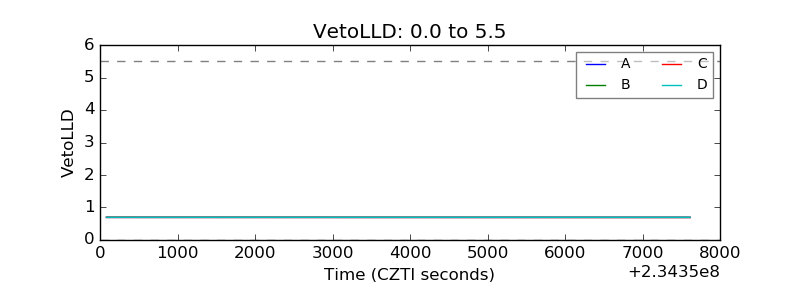 |
| Alpha Counter | 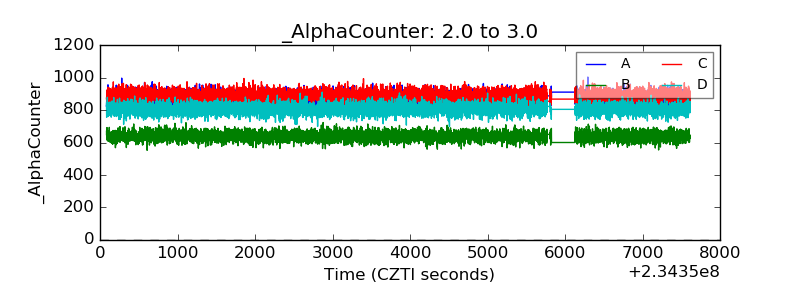 |
| _CPM_Rate | 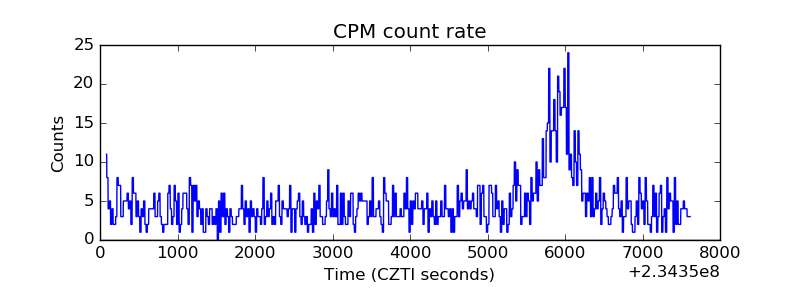 |
| CZT Counter | 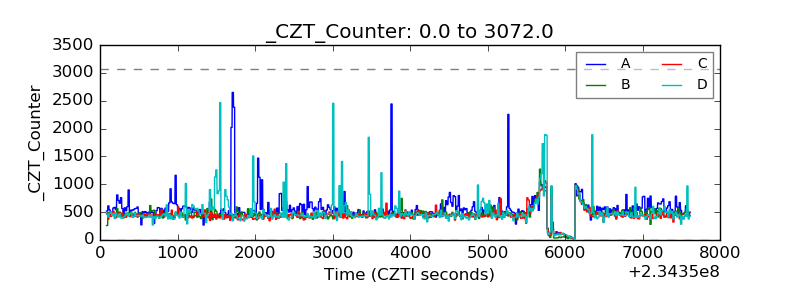 |
| +2.5 Volts monitor |  |
| +5 Volts monitor |  |
| _ROLL_ROT | 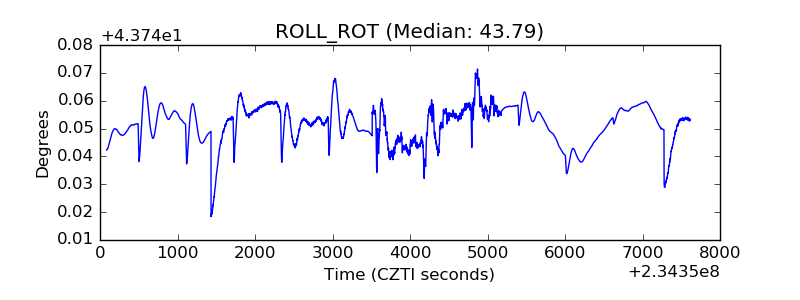 |
| _Roll_DEC | 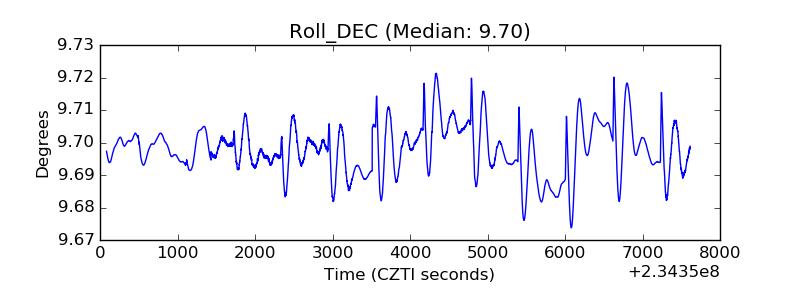 |
| _Roll_RA | 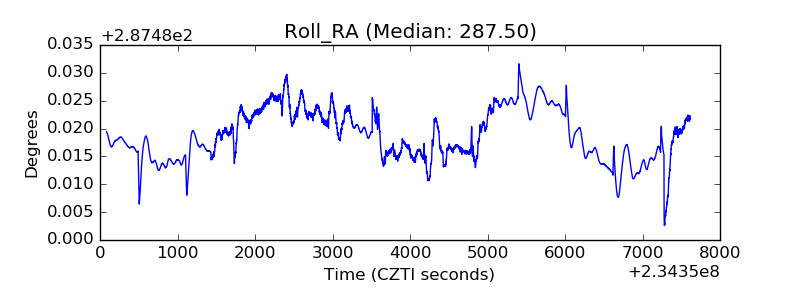 |
| Veto Counter | 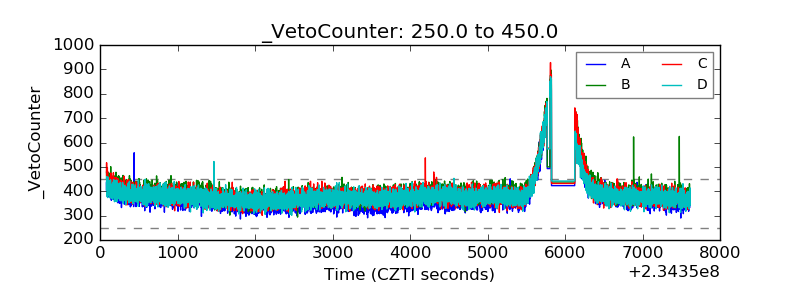 |