| Param | Original file | Final file |
|---|---|---|
| Filename | modeM0/AS1A03_105T01_9000001268_09123cztM0_level2.evt | modeM0/AS1A03_105T01_9000001268_09123cztM0_level2_quad_clean.evt |
| Size (bytes) | 553,083,840 | 77,817,600 |
| Size | 527.5 MB | 74.2 MB |
| Events in quadrant A | 4,637,180 | 457,863 |
| Events in quadrant B | 3,803,837 | 466,923 |
| Events in quadrant C | 3,631,387 | 456,098 |
| Events in quadrant D | 4,155,877 | 440,872 |
| Mode M0 | |||
|---|---|---|---|
| Quadrant | BADHDUFLAG | Total packets | Discarded packets |
| A | 0 | 18962 | 402 |
| B | 0 | 16466 | 232 |
| C | 0 | 16436 | 216 |
| D | 0 | 17953 | 334 |
| Mode SS | |||
|---|---|---|---|
| Quadrant | BADHDUFLAG | Total packets | Discarded packets |
| A | 0 | 160 | 4 |
| B | 0 | 160 | 4 |
| C | 0 | 160 | 4 |
| D | 0 | 160 | 0 |
| Mode M9 | |||
|---|---|---|---|
| Quadrant | BADHDUFLAG | Total packets | Discarded packets |
| A | 0 | 5 | 0 |
| B | 0 | 5 | 0 |
| C | 0 | 5 | 0 |
| D | 0 | 5 | 0 |
| Quadrant | Total seconds | Saturated seconds | Saturation percentage |
|---|---|---|---|
| A | 7649 | 357 | 4.667277% |
| B | 7708 | 284 | 3.684484% |
| C | 7718 | 203 | 2.630215% |
| D | 7686 | 324 | 4.215457% |
Noise dominated data is calculated using 1-second bins in cleaned event files. If a bin has >2000 counts, and if more than 50% of those come from <1% of pixels, then it is considered to be noise-dominated and hence unusable.
| Quadrant | # 1 sec bins | Bins with >0 counts | Bins with >2000 counts | High rate bins dominated by noise | Noise dominated (total time) | Noise dominated (detector-on time) | Marked lightcurve |
|---|---|---|---|---|---|---|---|
| A | 8255 | 7790 | 50 | 50 | 0.61% | 0.64% | 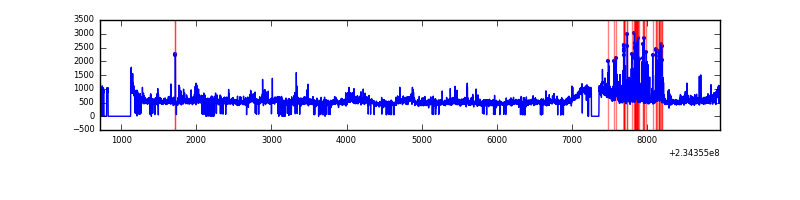 |
| B | 8255 | 7804 | 0 | 0 | 0.00% | 0.00% | 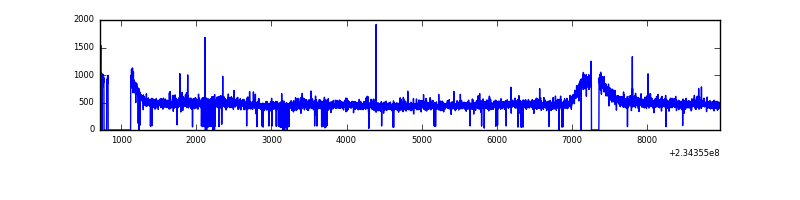 |
| C | 8255 | 7810 | 1 | 1 | 0.01% | 0.01% | 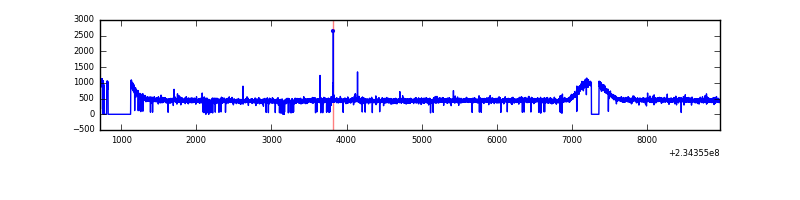 |
| D | 8255 | 7792 | 108 | 108 | 1.31% | 1.39% |  |
Top three noisy pixels from each quadrant. If the there are fewer than three noisy pixels in the level2.evt file, extra rows are filled as -1
| Pixel properties | Quadrant properties | ||||||
|---|---|---|---|---|---|---|---|
| Quadrant | DetID | PixID | Counts | Sigma | Mean | Median | Sigma |
| A | 8 | 5 | 582183 | 3000.92 | 945 | 925 | 193.7 |
| A | 15 | 223 | 209596 | 1077.33 | 945 | 925 | 193.7 |
| A | 15 | 239 | 83845 | 428.1 | 945 | 925 | 193.7 |
| B | 0 | 214 | 71265 | 375.41 | 956 | 931 | 187.4 |
| B | 12 | 111 | 21536 | 109.98 | 956 | 931 | 187.4 |
| B | 11 | 111 | 17417 | 88.0 | 956 | 931 | 187.4 |
| C | 13 | 61 | 6886 | 27.33 | 926 | 931 | 217.9 |
| C | 14 | 234 | 6221 | 24.28 | 926 | 931 | 217.9 |
| C | 8 | 128 | 5913 | 22.86 | 926 | 931 | 217.9 |
| D | 1 | 52 | 332813 | 1451.43 | 918 | 893 | 228.7 |
| D | 2 | 14 | 237564 | 1034.92 | 918 | 893 | 228.7 |
| D | 8 | 195 | 58581 | 252.26 | 918 | 893 | 228.7 |
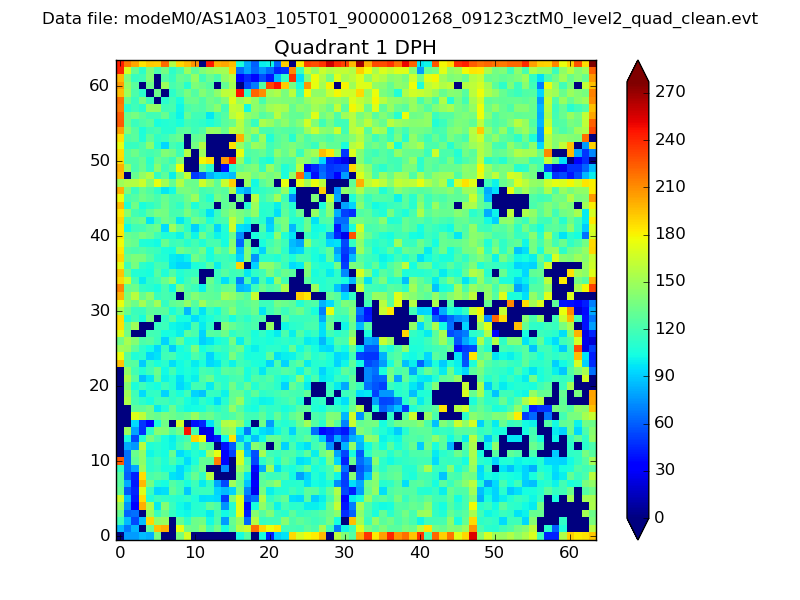
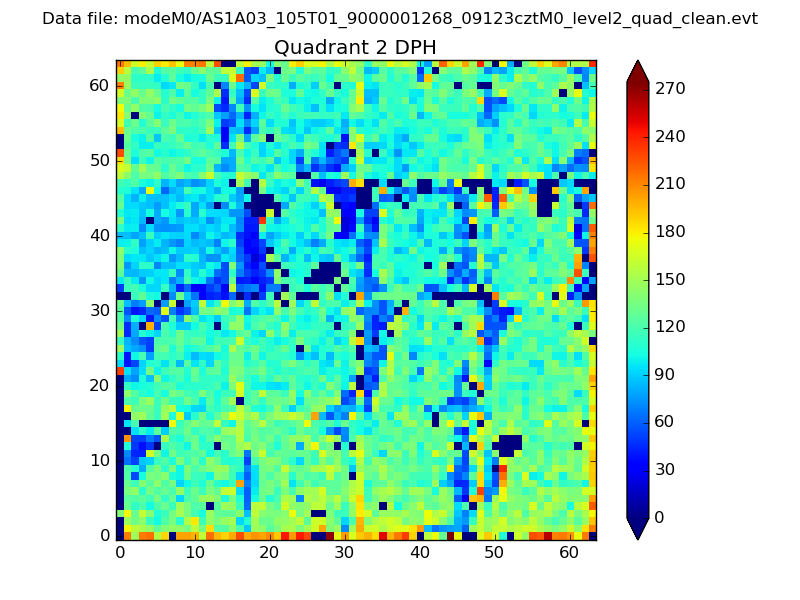
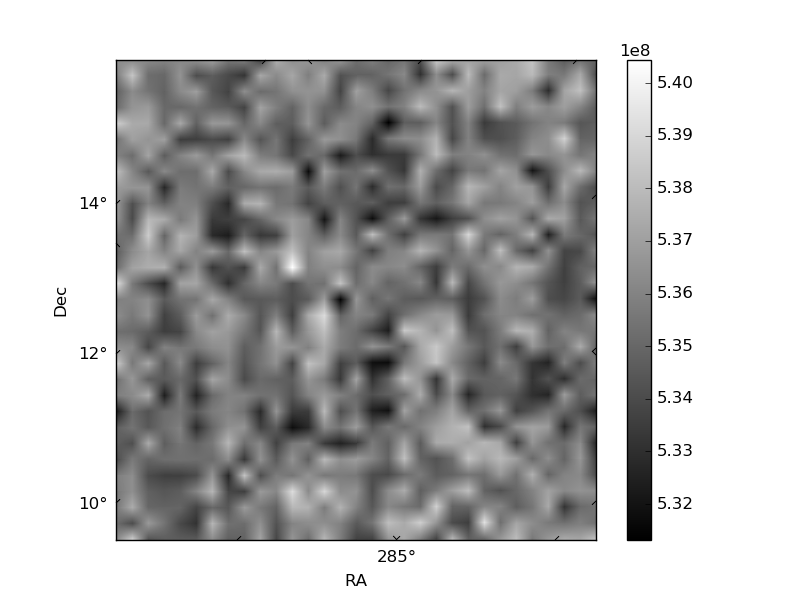
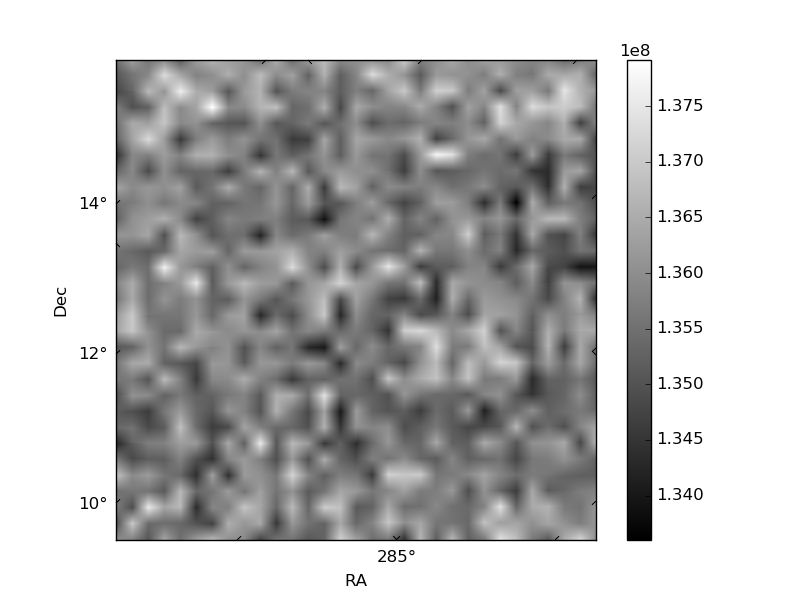
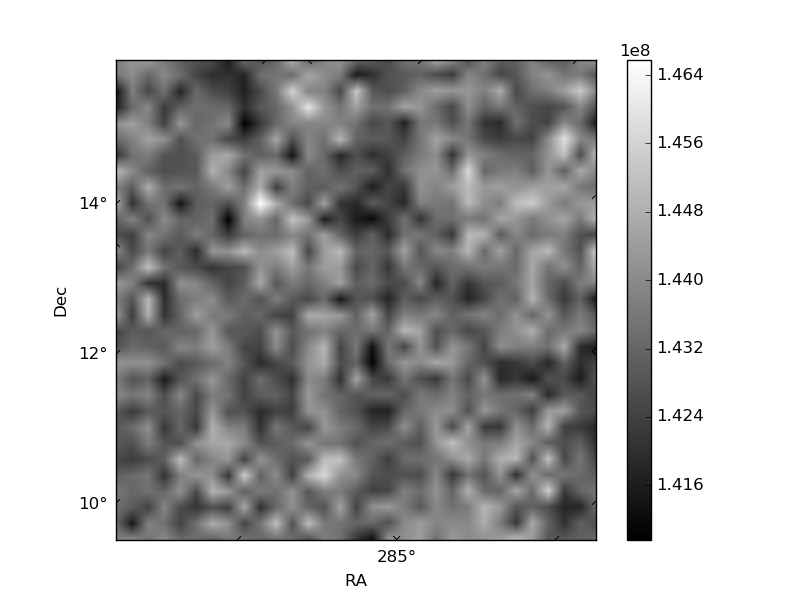
Histogram calculated using DETX and DETY for each event in the final _common_clean file
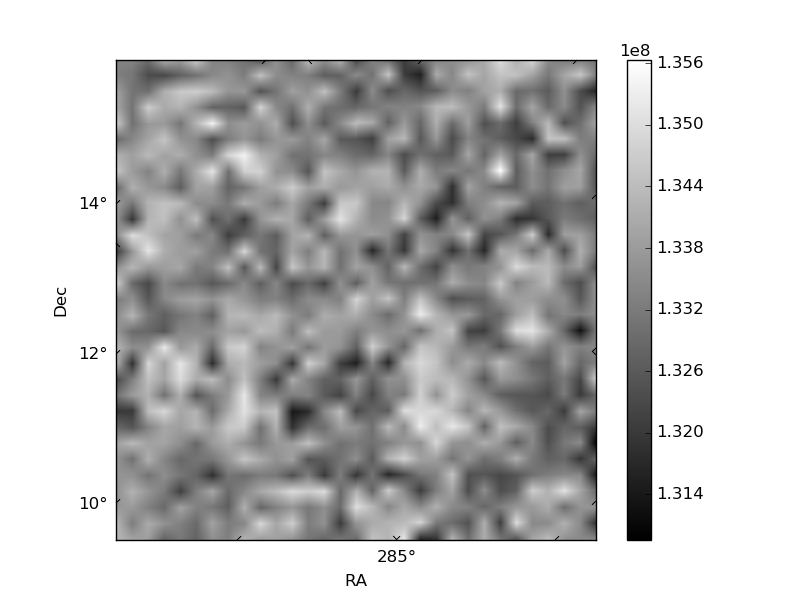
| Quadrant A | 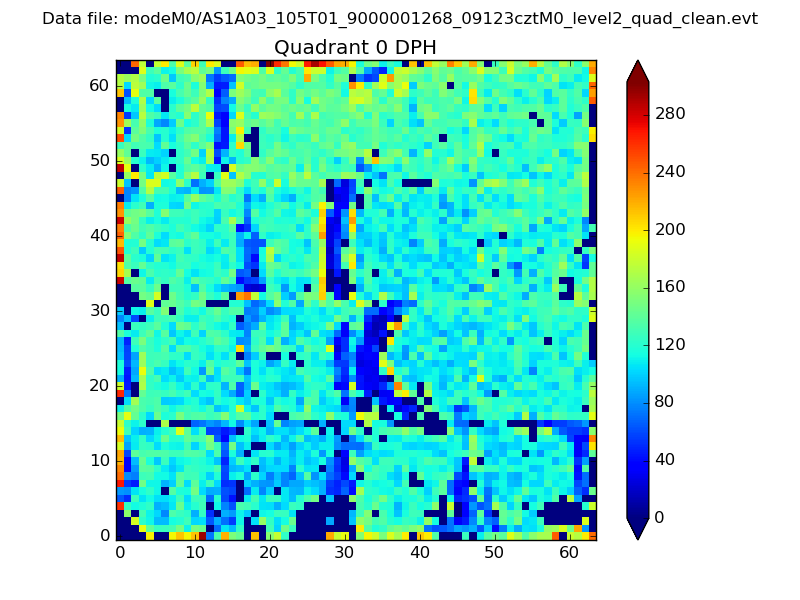 |
 |
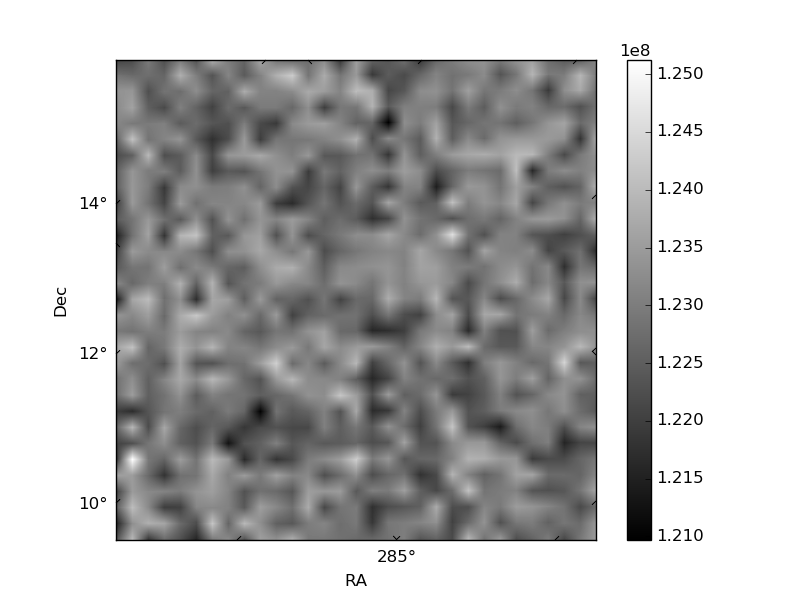
Quadrant B |
|---|---|---|---|
| Quadrant D | 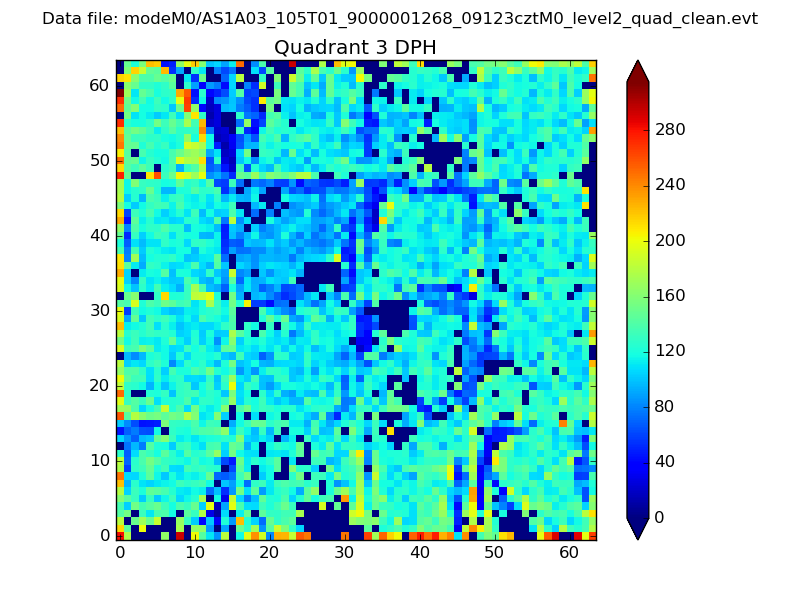 |
 |
Quadrant C |
| Plot type | Count rate plots | Images |
|---|---|---|
| Comparison with Poisson distribution Blue bars denote a histogram of data divided into 1 sec bins. Red curve is a Poisson curve with rate = median count rate of data. |
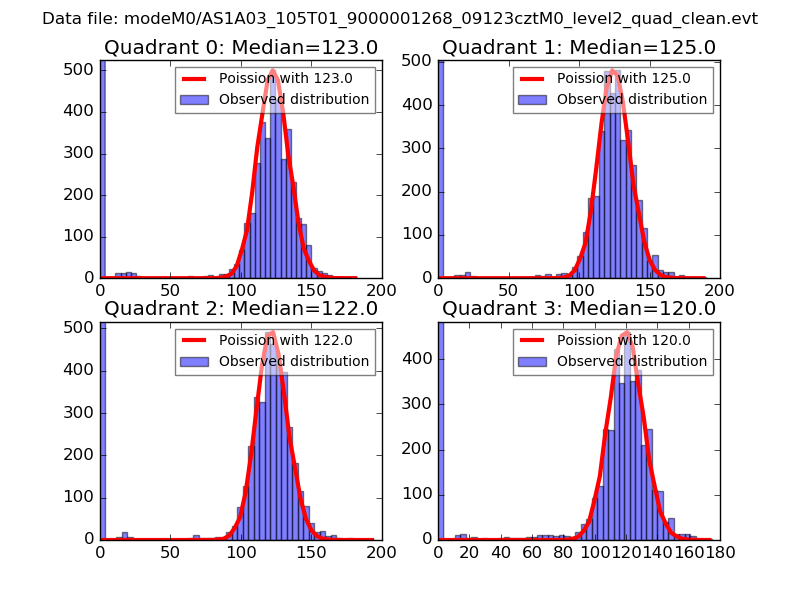 |
 |
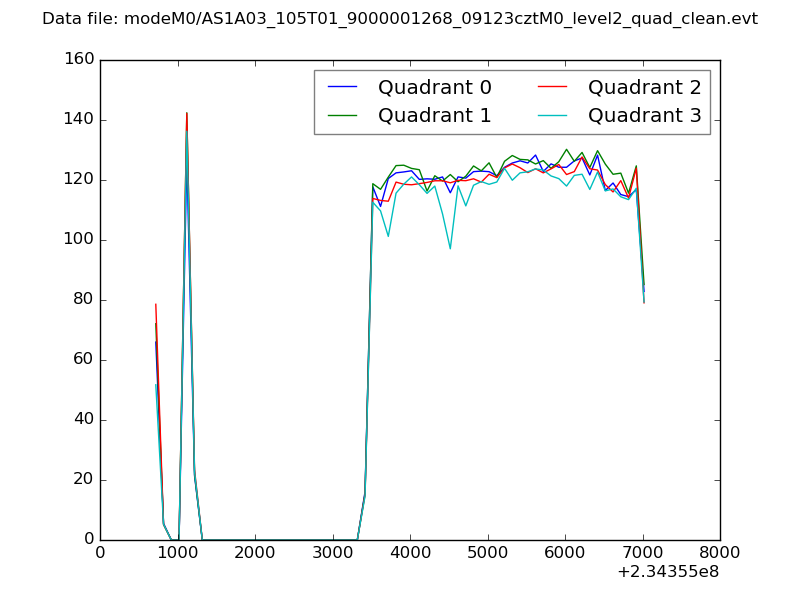
| Quadrant-wise count rates Data is divided into 100 sec bins |
 |
|
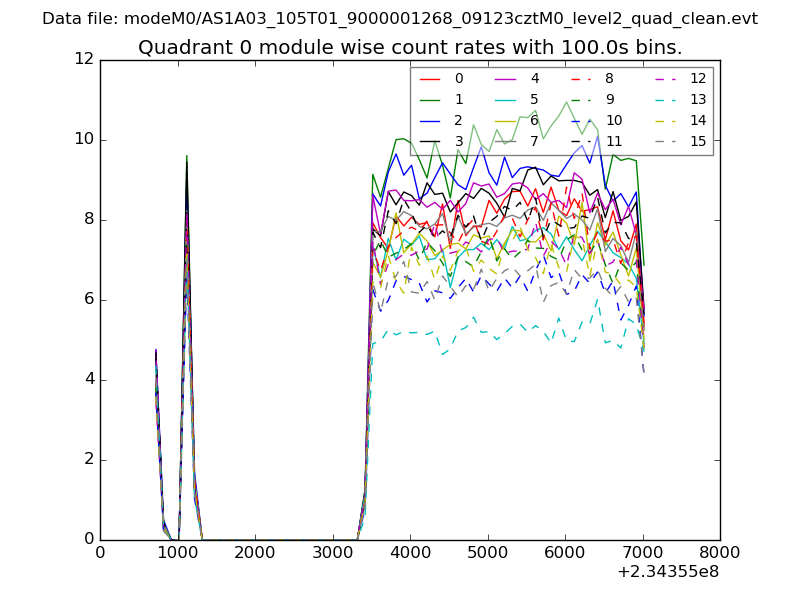
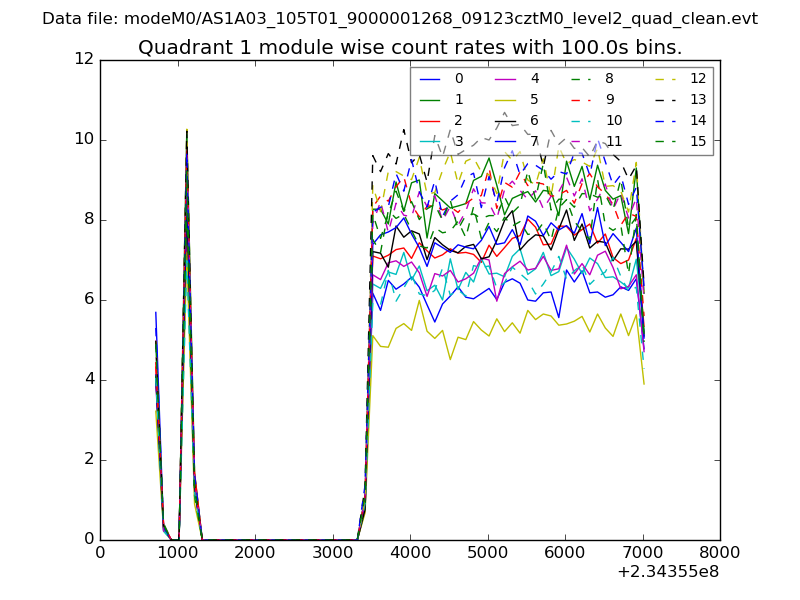
| Module-wise count rates for Quadrant A Data is divided into 100 sec bins |
 |
 |
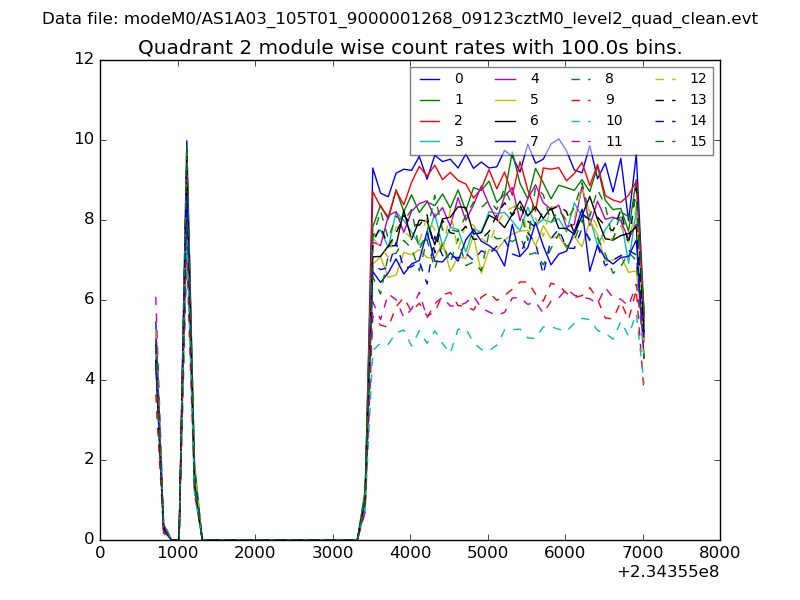
| Module-wise count rates for Quadrant B Data is divided into 100 sec bins |
 |
 |
| Module-wise count rates for Quadrant C Data is divided into 100 sec bins |
 |
 |
| Module-wise count rates for Quadrant D Data is divided into 100 sec bins |
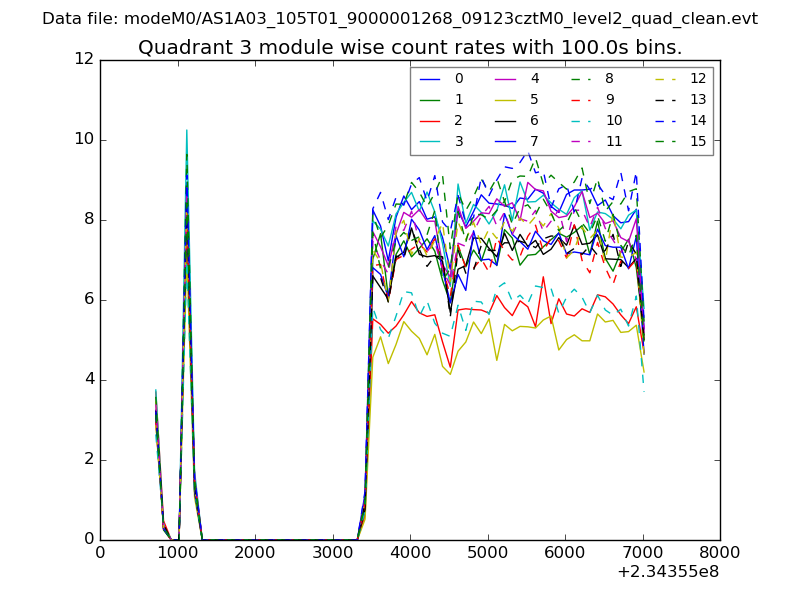 |
 |
| Parameter | Plot |
|---|---|
| CZT HV Monitor | 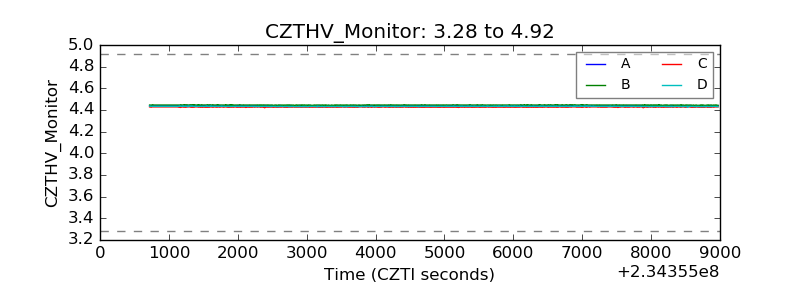 |
| D_VDD | 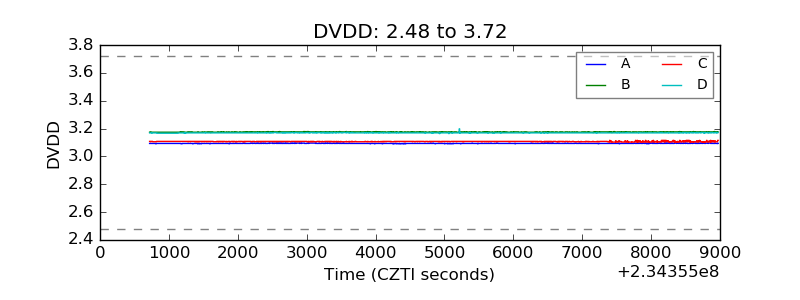 |
| Temperature 1 | 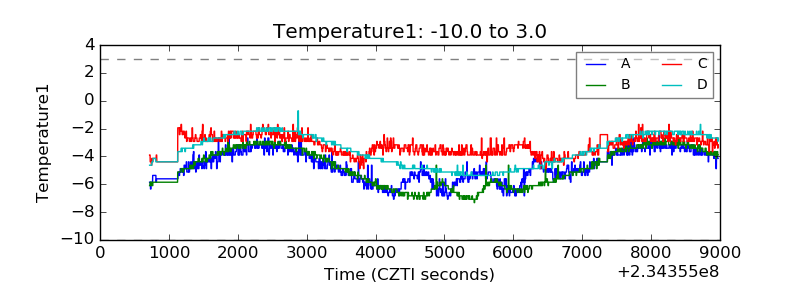 |
| Veto HV Monitor | 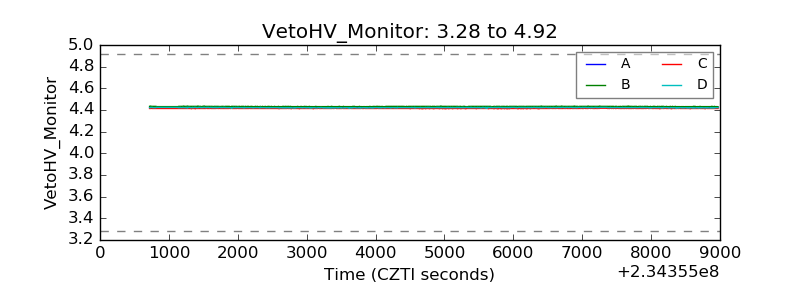 |
| Veto LLD | 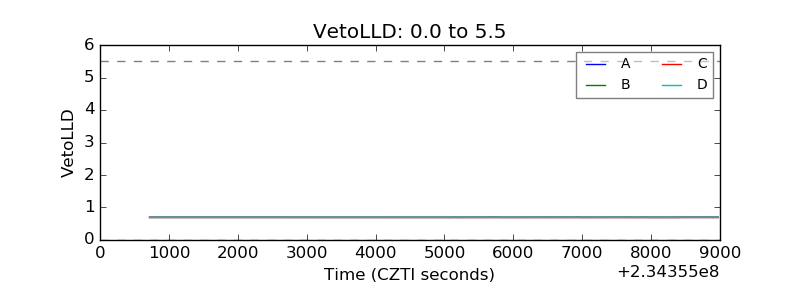 |
| Alpha Counter | 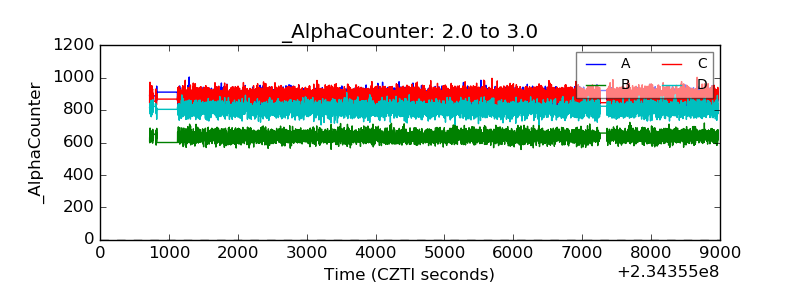 |
| _CPM_Rate | 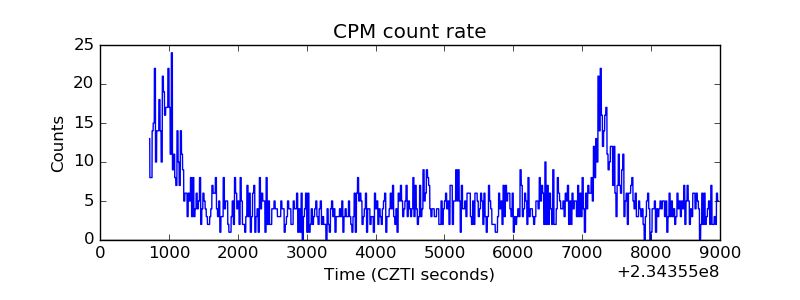 |
| CZT Counter | 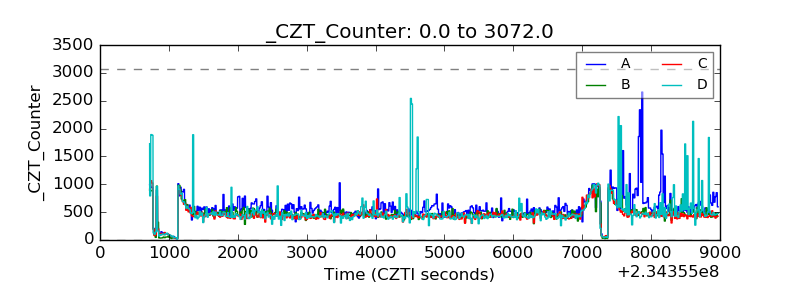 |
| +2.5 Volts monitor |  |
| +5 Volts monitor |  |
| _ROLL_ROT | 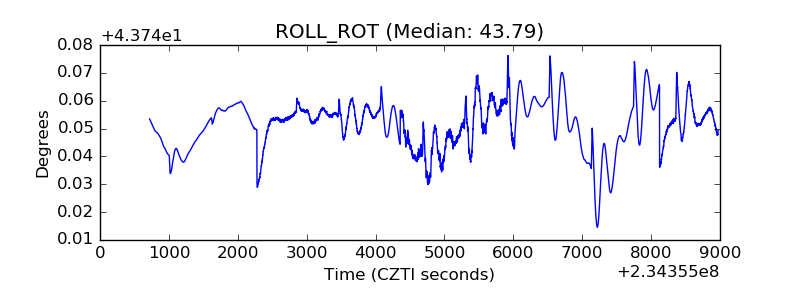 |
| _Roll_DEC | 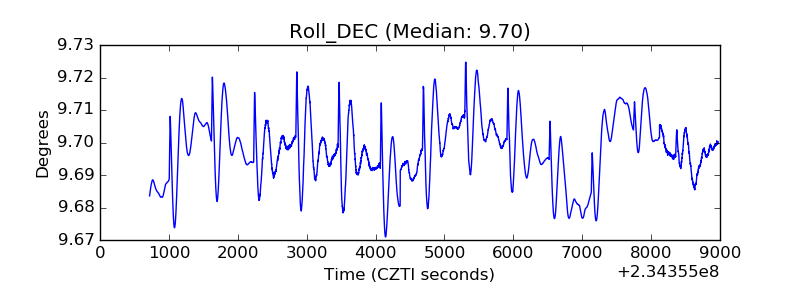 |
| _Roll_RA | 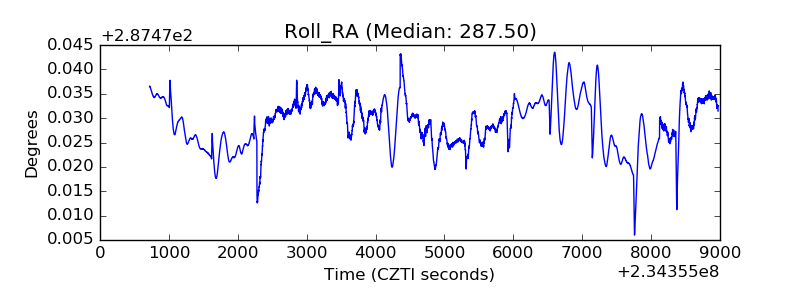 |
| Veto Counter | 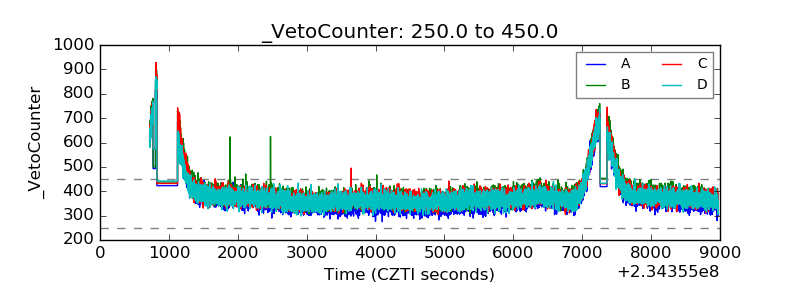 |