| Param | Original file | Final file |
|---|---|---|
| Filename | modeM0/AS1A03_105T01_9000001268_09124cztM0_level2.evt | modeM0/AS1A03_105T01_9000001268_09124cztM0_level2_quad_clean.evt |
| Size (bytes) | 186,580,800 | 11,468,160 |
| Size | 177.9 MB | 10.9 MB |
| Events in quadrant A | 1,704,844 | 45,008 |
| Events in quadrant B | 1,197,324 | 45,123 |
| Events in quadrant C | 1,113,365 | 42,809 |
| Events in quadrant D | 1,471,851 | 42,603 |
| Mode M0 | |||
|---|---|---|---|
| Quadrant | BADHDUFLAG | Total packets | Discarded packets |
| A | 0 | 6628 | 1 |
| B | 0 | 5015 | 3 |
| C | 0 | 4932 | 1 |
| D | 0 | 5885 | 1 |
| Mode SS | |||
|---|---|---|---|
| Quadrant | BADHDUFLAG | Total packets | Discarded packets |
| A | 0 | 48 | 0 |
| B | 0 | 48 | 0 |
| C | 0 | 48 | 0 |
| D | 0 | 48 | 0 |
| Quadrant | Total seconds | Saturated seconds | Saturation percentage |
|---|---|---|---|
| A | 2369 | 144 | 6.078514% |
| B | 2368 | 63 | 2.660473% |
| C | 2369 | 20 | 0.844238% |
| D | 2369 | 84 | 3.545800% |
Noise dominated data is calculated using 1-second bins in cleaned event files. If a bin has >2000 counts, and if more than 50% of those come from <1% of pixels, then it is considered to be noise-dominated and hence unusable.
| Quadrant | # 1 sec bins | Bins with >0 counts | Bins with >2000 counts | High rate bins dominated by noise | Noise dominated (total time) | Noise dominated (detector-on time) | Marked lightcurve |
|---|---|---|---|---|---|---|---|
| A | 2369 | 2369 | 48 | 48 | 2.03% | 2.03% | 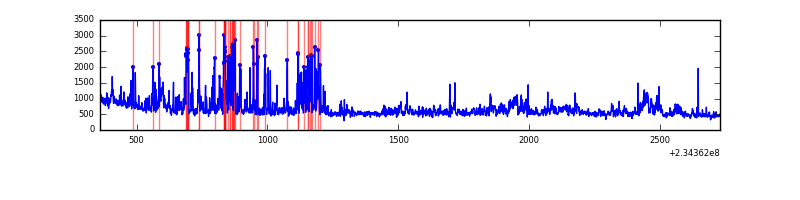 |
| B | 2369 | 2369 | 1 | 1 | 0.04% | 0.04% | 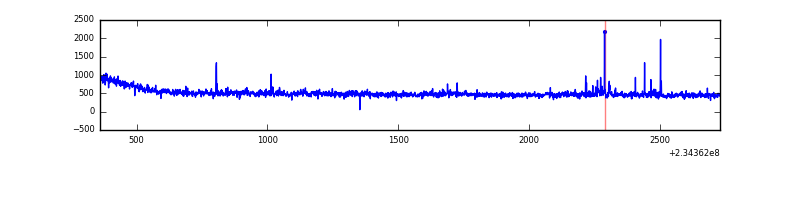 |
| C | 2369 | 2369 | 0 | 0 | 0.00% | 0.00% | 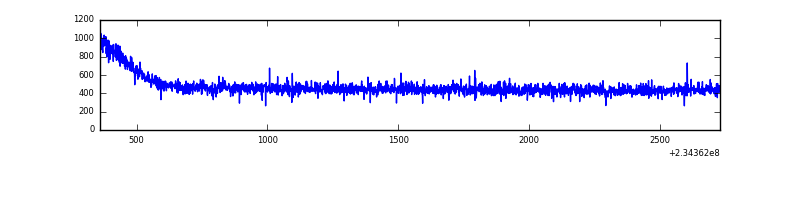 |
| D | 2369 | 2369 | 40 | 40 | 1.69% | 1.69% | 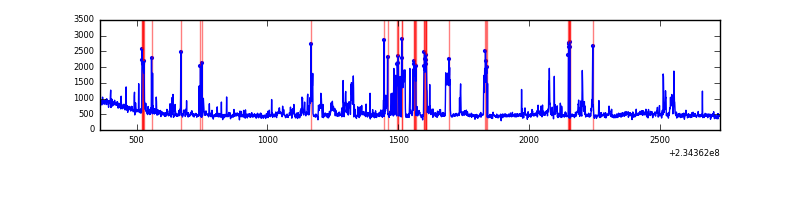 |
Top three noisy pixels from each quadrant. If the there are fewer than three noisy pixels in the level2.evt file, extra rows are filled as -1
| Pixel properties | Quadrant properties | ||||||
|---|---|---|---|---|---|---|---|
| Quadrant | DetID | PixID | Counts | Sigma | Mean | Median | Sigma |
| A | 8 | 5 | 239856 | 3870.8 | 292 | 285 | 61.9 |
| A | 15 | 223 | 211187 | 3407.58 | 292 | 285 | 61.9 |
| A | 15 | 239 | 82929 | 1335.29 | 292 | 285 | 61.9 |
| B | 0 | 214 | 37236 | 619.7 | 295 | 288 | 59.6 |
| B | 12 | 111 | 6624 | 106.27 | 295 | 288 | 59.6 |
| B | 5 | 175 | 5603 | 89.14 | 295 | 288 | 59.6 |
| C | 8 | 128 | 7079 | 100.76 | 282 | 283 | 67.4 |
| C | 8 | 112 | 2802 | 37.35 | 282 | 283 | 67.4 |
| C | 8 | 144 | 2523 | 33.21 | 282 | 283 | 67.4 |
| D | 1 | 52 | 289111 | 3838.68 | 283 | 275 | 75.2 |
| D | 2 | 14 | 63217 | 836.51 | 283 | 275 | 75.2 |
| D | 8 | 195 | 23088 | 303.19 | 283 | 275 | 75.2 |
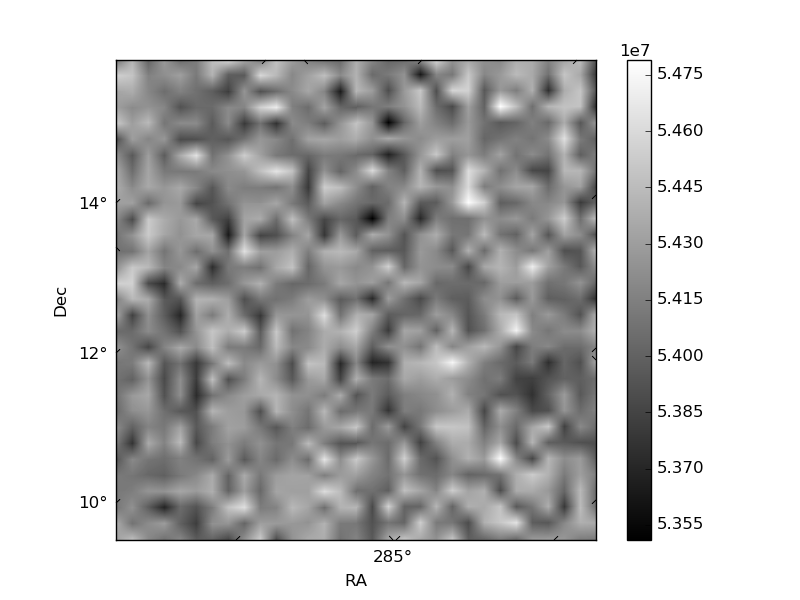
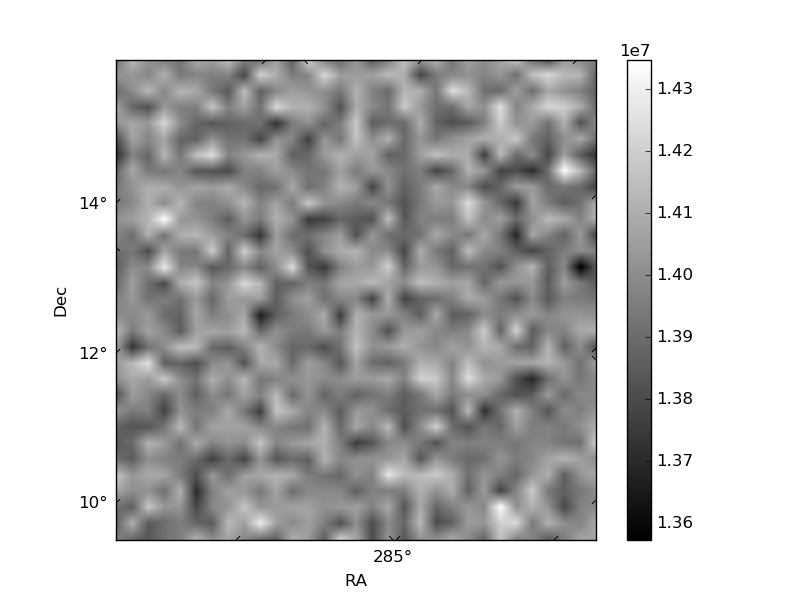
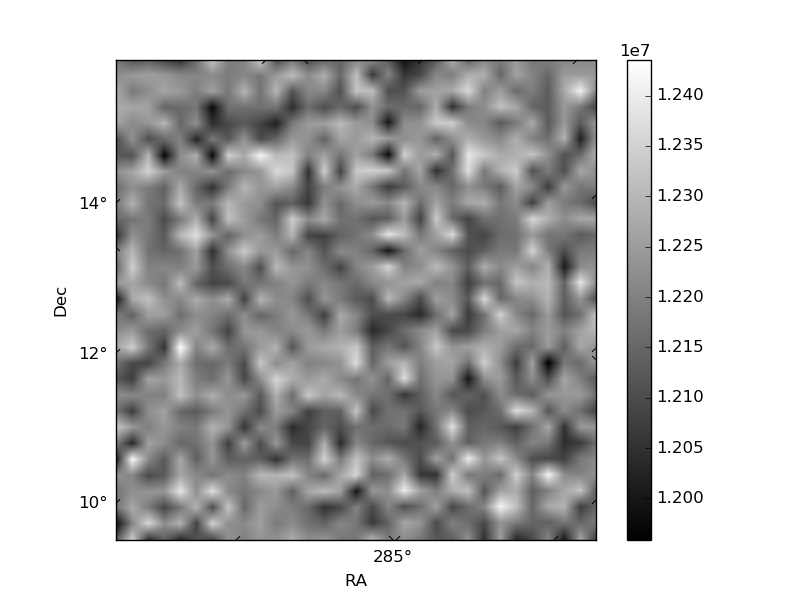
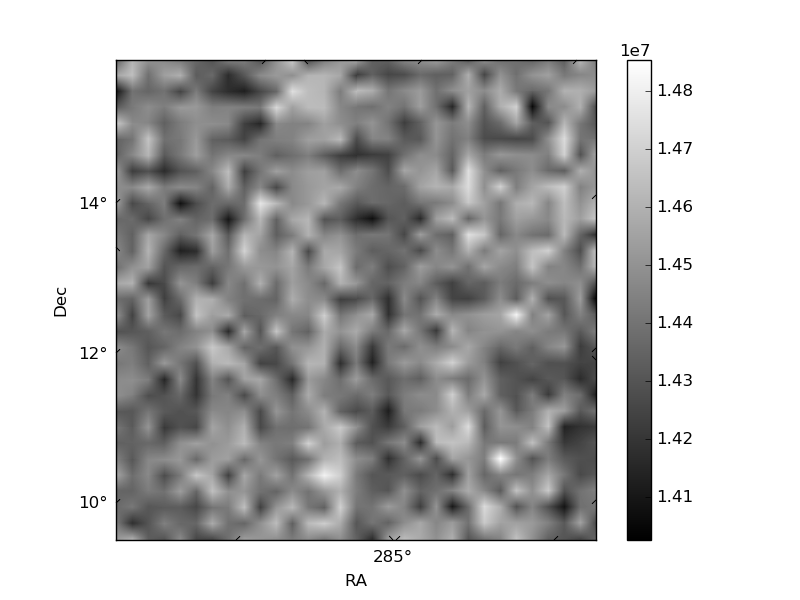
Histogram calculated using DETX and DETY for each event in the final _common_clean file
| Quadrant A | 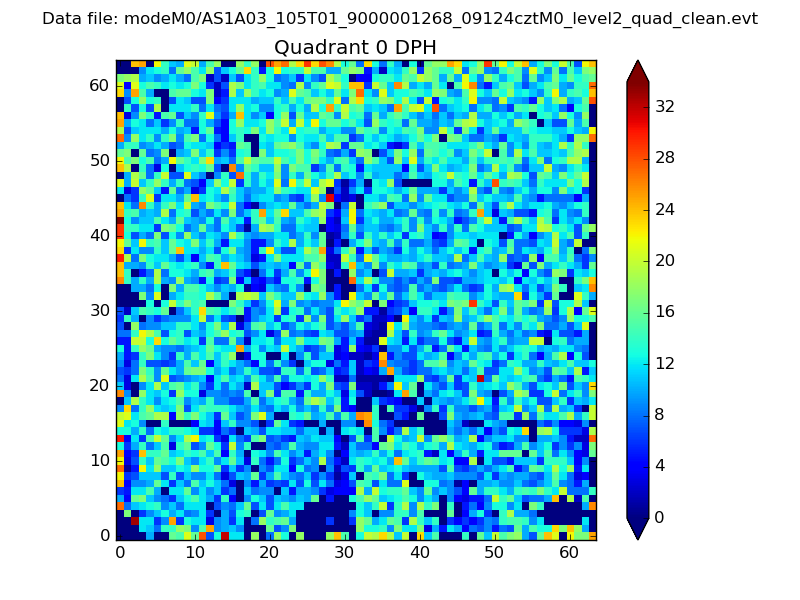 |
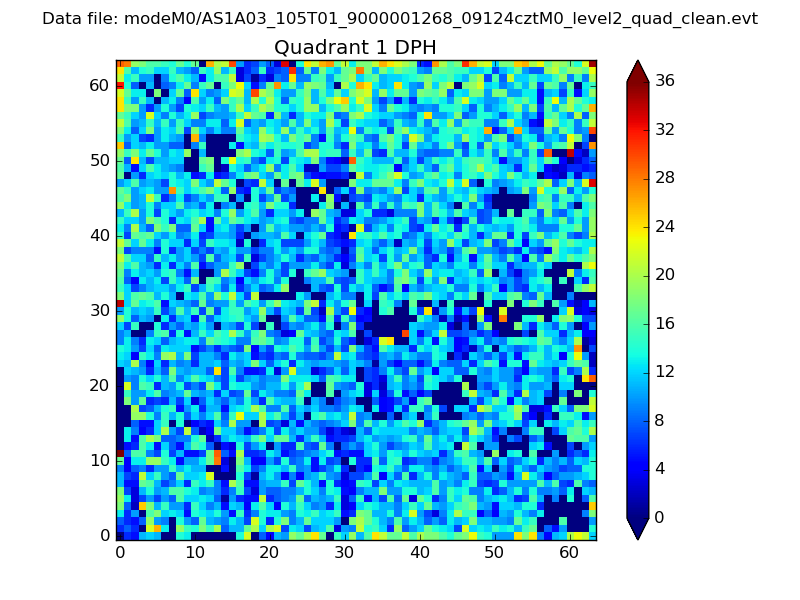 |
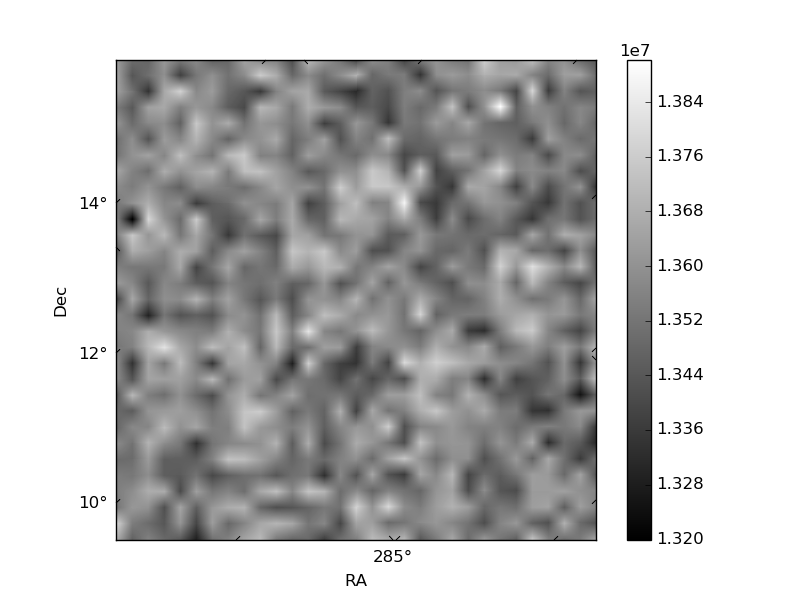
Quadrant B |
|---|---|---|---|
| Quadrant D | 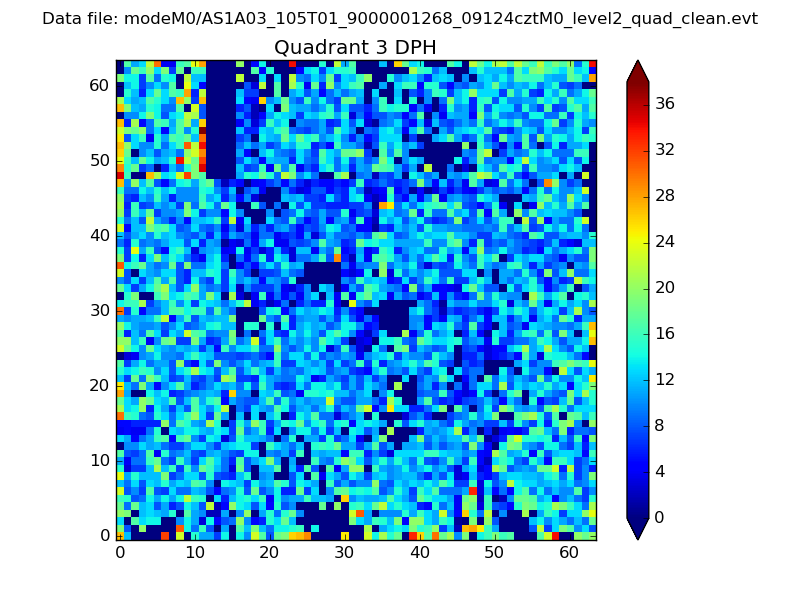 |
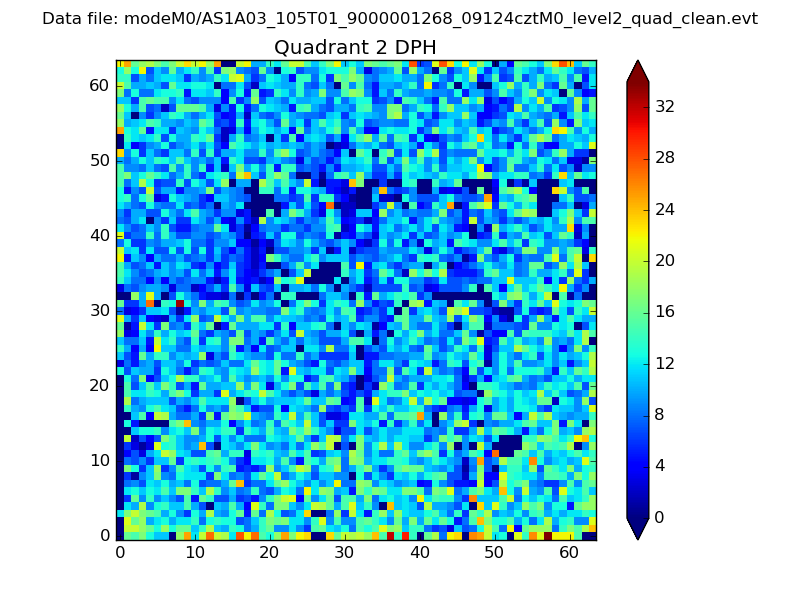 |
Quadrant C |
| Plot type | Count rate plots | Images |
|---|---|---|
| Comparison with Poisson distribution Blue bars denote a histogram of data divided into 1 sec bins. Red curve is a Poisson curve with rate = median count rate of data. |
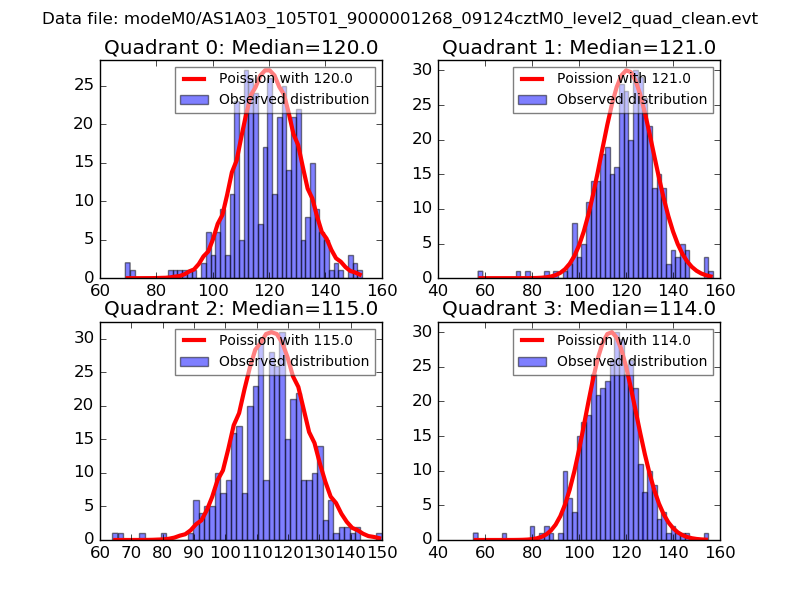 |
 |
| Quadrant-wise count rates Data is divided into 100 sec bins |
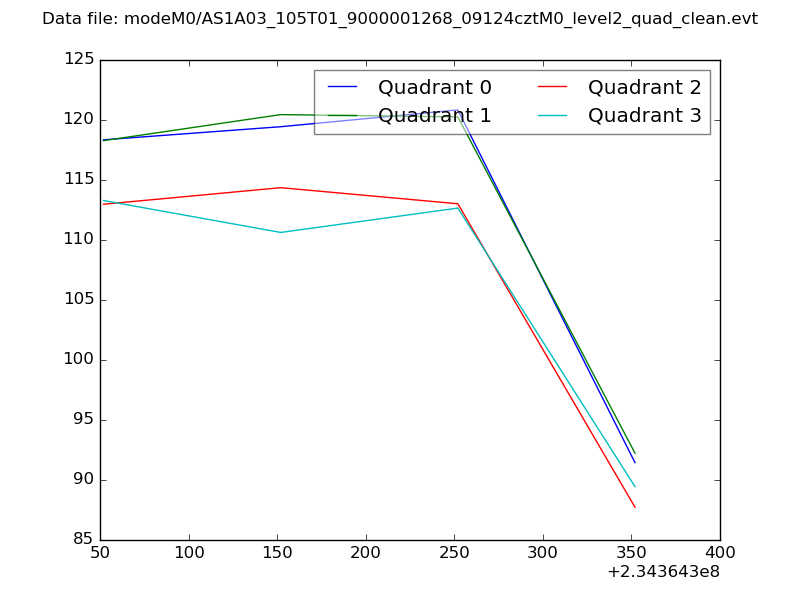 |
|
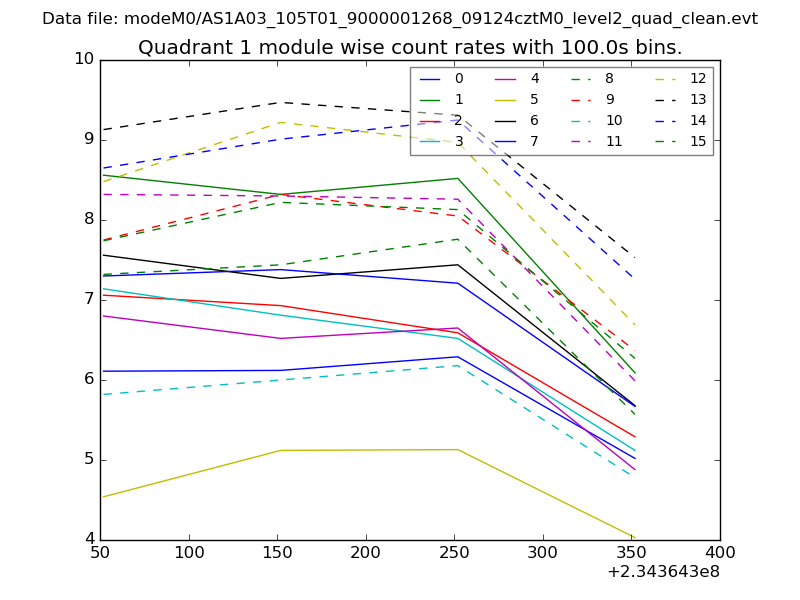
| Module-wise count rates for Quadrant A Data is divided into 100 sec bins |
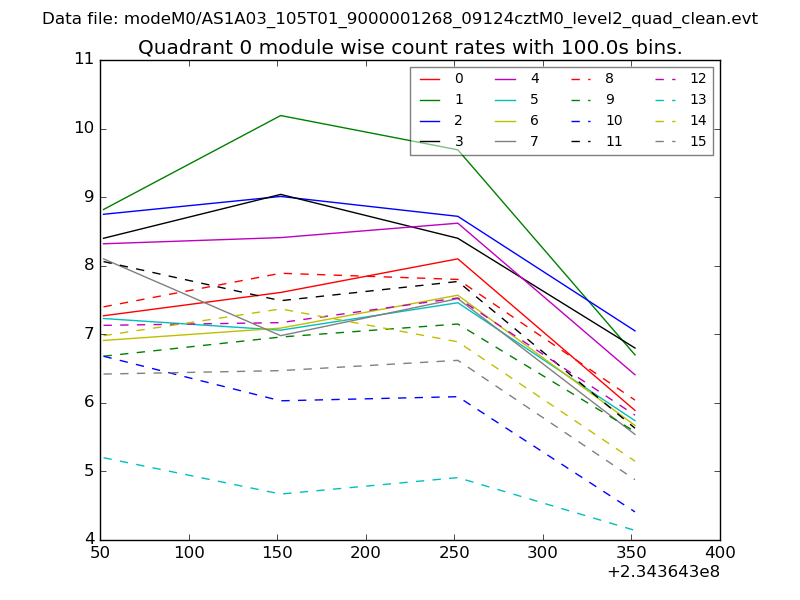 |
 |
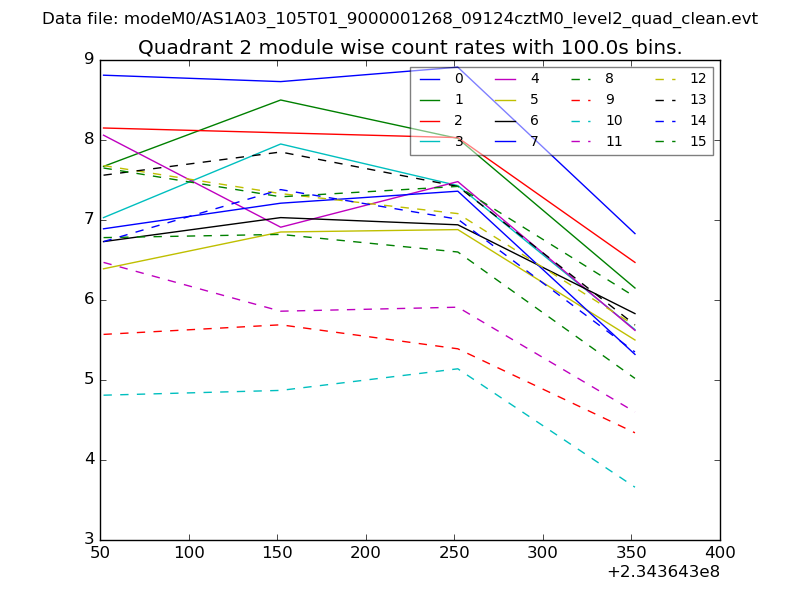
| Module-wise count rates for Quadrant B Data is divided into 100 sec bins |
 |
 |
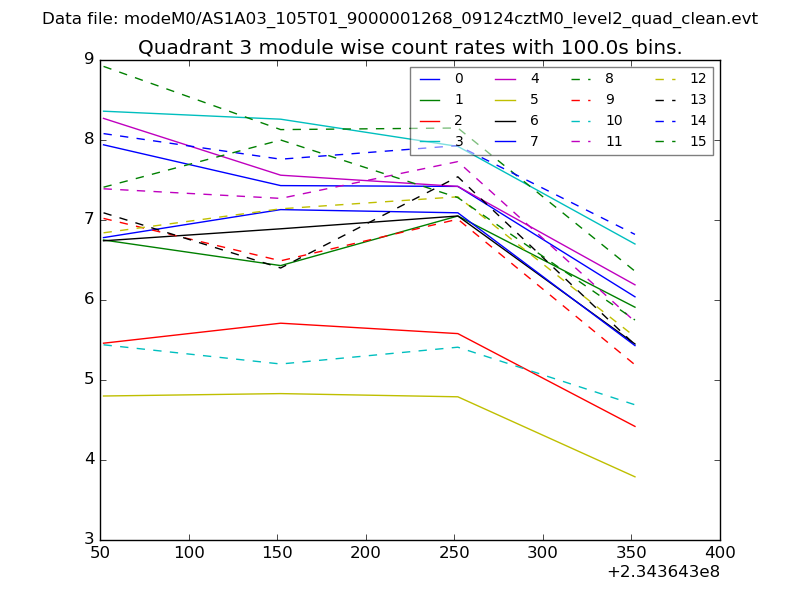
| Module-wise count rates for Quadrant C Data is divided into 100 sec bins |
 |
 |
| Module-wise count rates for Quadrant D Data is divided into 100 sec bins |
 |
 |
| Parameter | Plot |
|---|---|
| CZT HV Monitor | 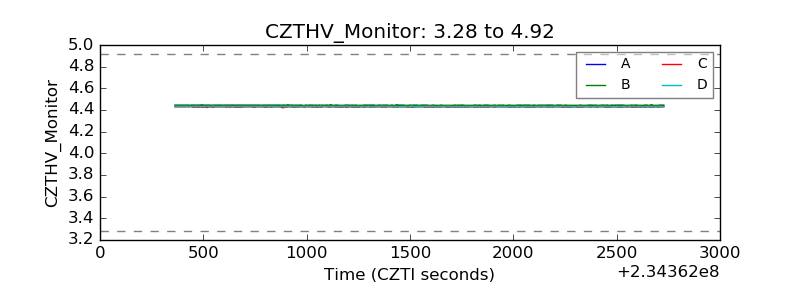 |
| D_VDD | 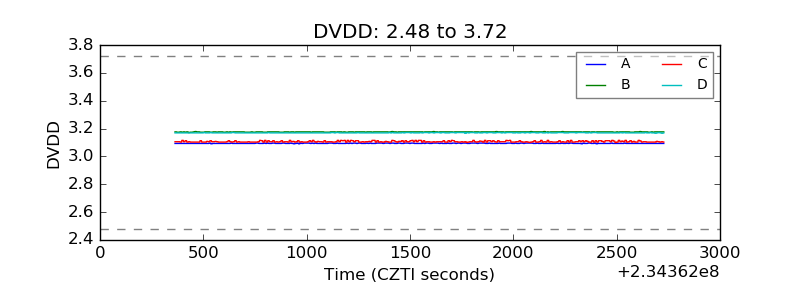 |
| Temperature 1 | 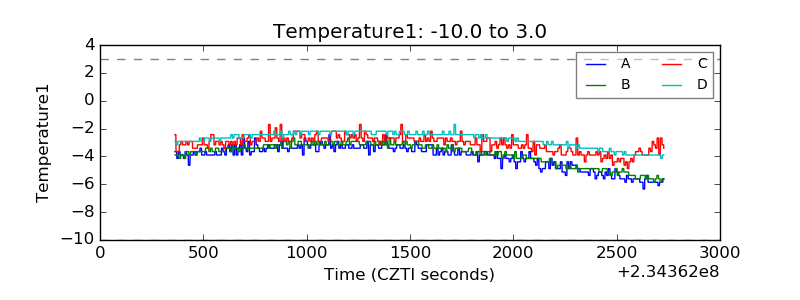 |
| Veto HV Monitor | 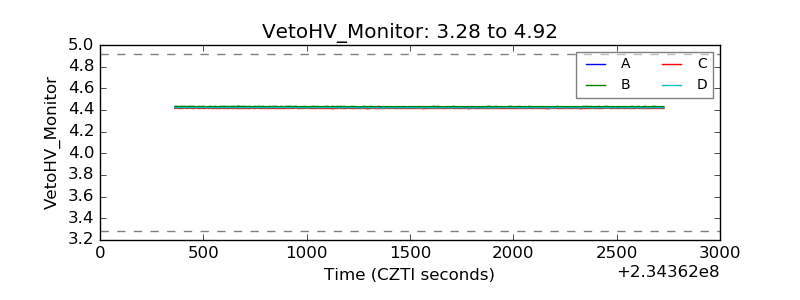 |
| Veto LLD | 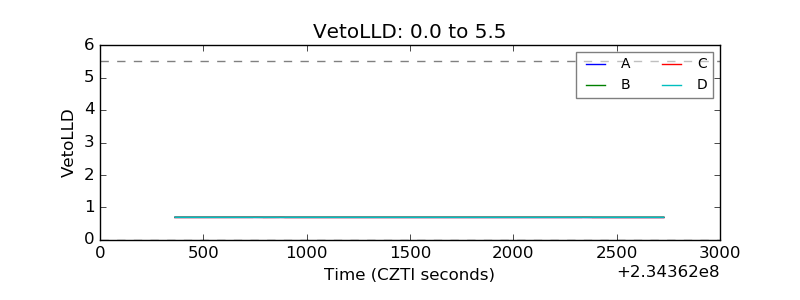 |
| Alpha Counter | 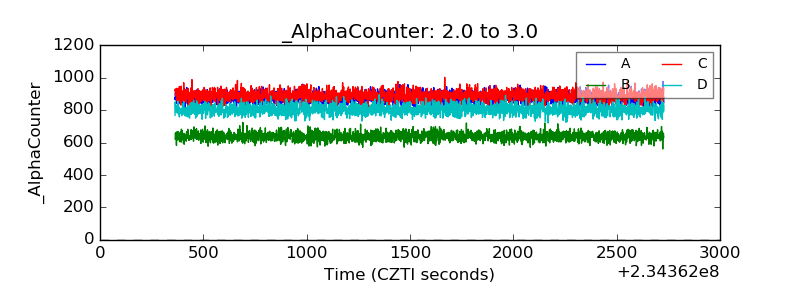 |
| _CPM_Rate | 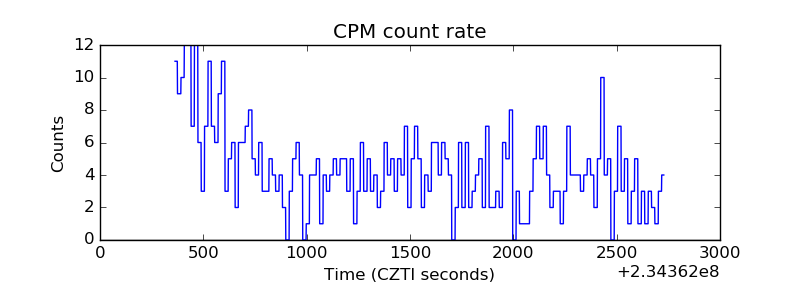 |
| CZT Counter | 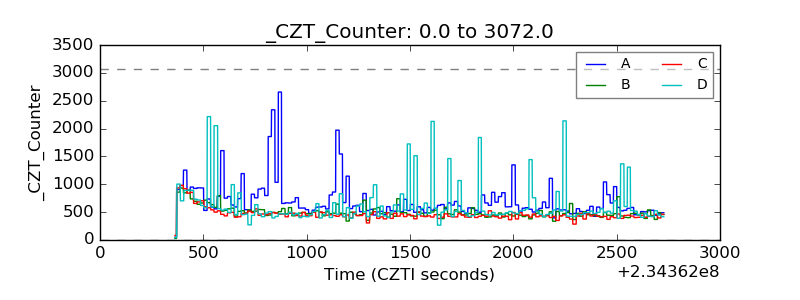 |
| +2.5 Volts monitor |  |
| +5 Volts monitor |  |
| _ROLL_ROT | 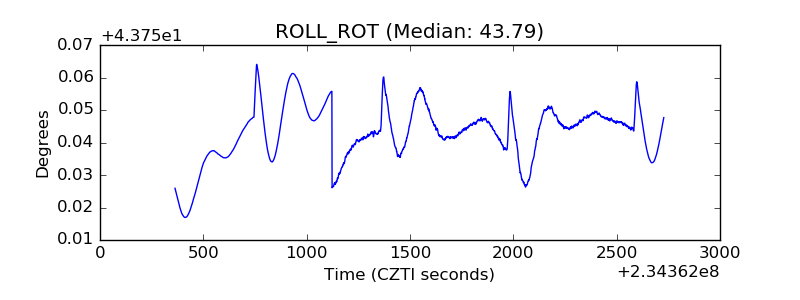 |
| _Roll_DEC | 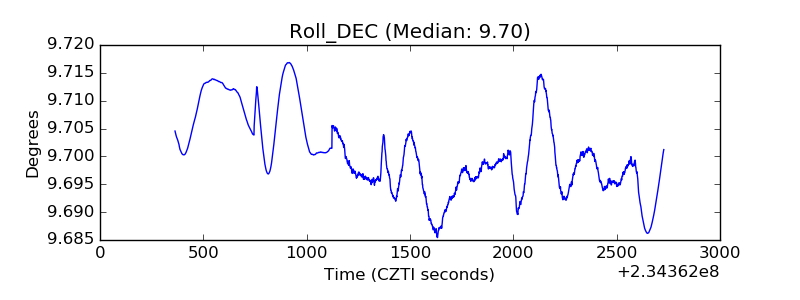 |
| _Roll_RA | 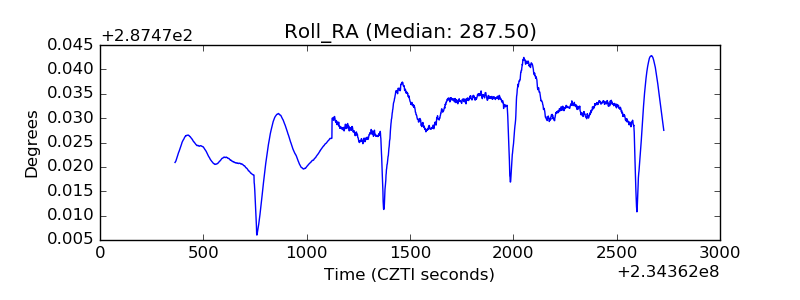 |
| Veto Counter | 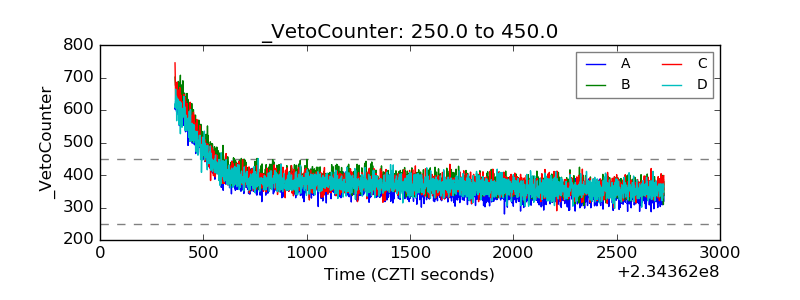 |