| Param | Original file | Final file |
|---|---|---|
| Filename | modeM0/AS1G07_028T01_9000001272cztM0_level2.fits | modeM0/AS1G07_028T01_9000001272cztM0_level2_quad_clean.evt |
| Size (bytes) | 148,374,720 | 129,885,120 |
| Size | 141.5 MB | 123.9 MB |
| Events in quadrant A | 884,046 | 737,416 |
| Events in quadrant B | 866,696 | 743,743 |
| Events in quadrant C | 880,206 | 700,059 |
| Events in quadrant D | 759,058 | 647,618 |
| Mode M9 | |||
|---|---|---|---|
| Quadrant | BADHDUFLAG | Total packets | Discarded packets |
| A | 0 | 30 | 0 |
| B | 0 | 30 | 0 |
| C | 0 | 30 | 0 |
| D | 0 | 30 | 0 |
| Mode M0 | |||
|---|---|---|---|
| Quadrant | BADHDUFLAG | Total packets | Discarded packets |
| A | 0 | 42000 | 0 |
| B | 0 | 33073 | 0 |
| C | 0 | 36195 | 0 |
| D | 0 | 40899 | 0 |
| Mode SS | |||
|---|---|---|---|
| Quadrant | BADHDUFLAG | Total packets | Discarded packets |
| A | 0 | 328 | 0 |
| B | 0 | 328 | 0 |
| C | 0 | 328 | 0 |
| D | 0 | 328 | 0 |
| Quadrant | Total seconds | Saturated seconds | Saturation percentage |
|---|---|---|---|
| A | 15988 | 332 | 2.076557% |
| B | 15998 | 99 | 0.618827% |
| C | 15989 | 120 | 0.750516% |
| D | 15992 | 458 | 2.863932% |
Noise dominated data is calculated using 1-second bins in cleaned event files. If a bin has >2000 counts, and if more than 50% of those come from <1% of pixels, then it is considered to be noise-dominated and hence unusable.
| Quadrant | # 1 sec bins | Bins with >0 counts | Bins with >2000 counts | High rate bins dominated by noise | Noise dominated (total time) | Noise dominated (detector-on time) | Marked lightcurve |
|---|---|---|---|---|---|---|---|
| A | 19041 | 16006 | 0 | 0 | 0.00% | 0.00% |  |
| B | 19041 | 16008 | 0 | 0 | 0.00% | 0.00% |  |
| C | 19041 | 16005 | 0 | 0 | 0.00% | 0.00% |  |
| D | 19041 | 16008 | 0 | 0 | 0.00% | 0.00% |  |
Top three noisy pixels from each quadrant. If the there are fewer than three noisy pixels in the level2.evt file, extra rows are filled as -1
| Pixel properties | Quadrant properties | ||||||
|---|---|---|---|---|---|---|---|
| Quadrant | DetID | PixID | Counts | Sigma | Mean | Median | Sigma |
| A | 14 | 188 | 885 | 11.32 | 229 | 215 | 59.2 |
| A | 0 | 29 | 875 | 11.15 | 229 | 215 | 59.2 |
| A | 14 | 204 | 797 | 9.83 | 229 | 215 | 59.2 |
| B | 2 | 9 | 732 | 10.68 | 228 | 217 | 48.2 |
| B | 5 | 232 | 624 | 8.44 | 228 | 217 | 48.2 |
| B | 12 | 226 | 586 | 7.65 | 228 | 217 | 48.2 |
| C | 9 | 188 | 607 | 6.19 | 232 | 214 | 63.5 |
| C | 9 | 242 | 588 | 5.89 | 232 | 214 | 63.5 |
| C | 7 | 111 | 578 | 5.73 | 232 | 214 | 63.5 |
| D | 3 | 31 | 554 | 6.12 | 215 | 196 | 58.5 |
| D | 3 | 14 | 541 | 5.89 | 215 | 196 | 58.5 |
| D | 10 | 189 | 539 | 5.86 | 215 | 196 | 58.5 |
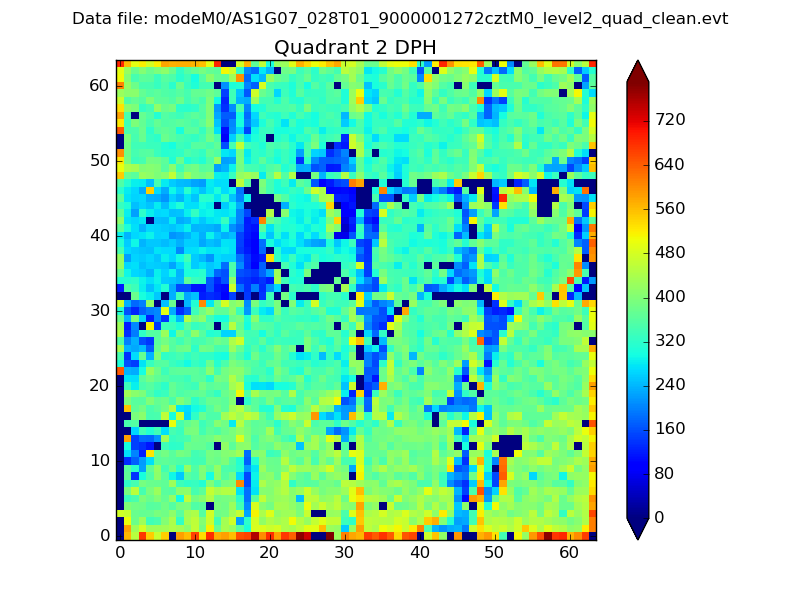
Histogram calculated using DETX and DETY for each event in the final _common_clean file
| Quadrant A |  |
 |
Quadrant B |
|---|---|---|---|
| Quadrant D |  |
 |
Quadrant C |
| Plot type | Count rate plots | Images |
|---|---|---|
| Comparison with Poisson distribution Blue bars denote a histogram of data divided into 1 sec bins. Red curve is a Poisson curve with rate = median count rate of data. |
 |
 |
| Quadrant-wise count rates Data is divided into 100 sec bins |
 |
|
| Module-wise count rates for Quadrant A Data is divided into 100 sec bins |
 |
 |
| Module-wise count rates for Quadrant B Data is divided into 100 sec bins |
 |
 |
| Module-wise count rates for Quadrant C Data is divided into 100 sec bins |
 |
 |
| Module-wise count rates for Quadrant D Data is divided into 100 sec bins |
 |
 |
| Parameter | Plot |
|---|---|
| CZT HV Monitor |  |
| D_VDD |  |
| Temperature 1 |  |
| Veto HV Monitor |  |
| Veto LLD |  |
| Alpha Counter |  |
| _CPM_Rate |  |
| CZT Counter |  |
| +2.5 Volts monitor |  |
| +5 Volts monitor |  |
| _ROLL_ROT |  |
| _Roll_DEC |  |
| _Roll_RA |  |
| Veto Counter |  |