| Param | Original file | Final file |
|---|---|---|
| Filename | modeM0/AS1G07_028T01_9000001272_09127cztM0_level2.evt | modeM0/AS1G07_028T01_9000001272_09127cztM0_level2_quad_clean.evt |
| Size (bytes) | 400,104,000 | 71,369,280 |
| Size | 381.6 MB | 68.1 MB |
| Events in quadrant A | 2,932,683 | 457,740 |
| Events in quadrant B | 2,383,999 | 459,048 |
| Events in quadrant C | 2,350,518 | 451,283 |
| Events in quadrant D | 4,100,993 | 433,365 |
| Mode M9 | |||
|---|---|---|---|
| Quadrant | BADHDUFLAG | Total packets | Discarded packets |
| A | 0 | 9 | 0 |
| B | 0 | 9 | 0 |
| C | 0 | 9 | 0 |
| D | 0 | 9 | 0 |
| Mode M0 | |||
|---|---|---|---|
| Quadrant | BADHDUFLAG | Total packets | Discarded packets |
| A | 0 | 12374 | 22 |
| B | 0 | 10576 | 15 |
| C | 0 | 10564 | 29 |
| D | 0 | 15830 | 21 |
| Mode SS | |||
|---|---|---|---|
| Quadrant | BADHDUFLAG | Total packets | Discarded packets |
| A | 0 | 104 | 0 |
| B | 0 | 104 | 0 |
| C | 0 | 104 | 0 |
| D | 0 | 104 | 0 |
| Quadrant | Total seconds | Saturated seconds | Saturation percentage |
|---|---|---|---|
| A | 5135 | 51 | 0.993184% |
| B | 5138 | 31 | 0.603348% |
| C | 5131 | 26 | 0.506724% |
| D | 5138 | 219 | 4.262359% |
Noise dominated data is calculated using 1-second bins in cleaned event files. If a bin has >2000 counts, and if more than 50% of those come from <1% of pixels, then it is considered to be noise-dominated and hence unusable.
| Quadrant | # 1 sec bins | Bins with >0 counts | Bins with >2000 counts | High rate bins dominated by noise | Noise dominated (total time) | Noise dominated (detector-on time) | Marked lightcurve |
|---|---|---|---|---|---|---|---|
| A | 6010 | 5145 | 3 | 3 | 0.05% | 0.06% | 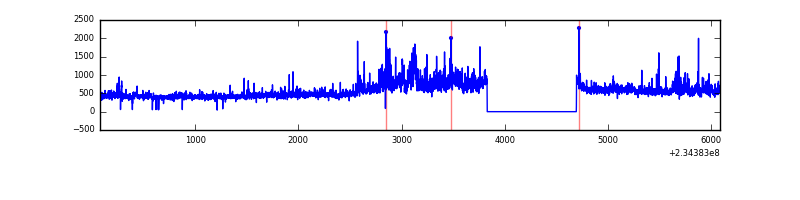 |
| B | 6010 | 5145 | 0 | 0 | 0.00% | 0.00% | 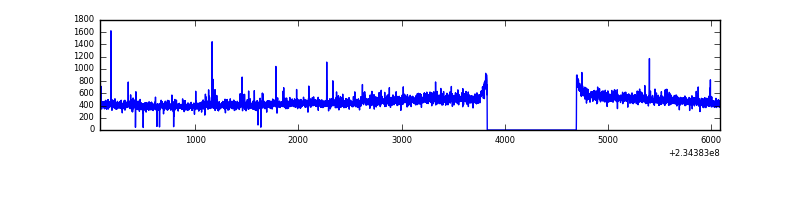 |
| C | 6010 | 5145 | 4 | 4 | 0.07% | 0.08% | 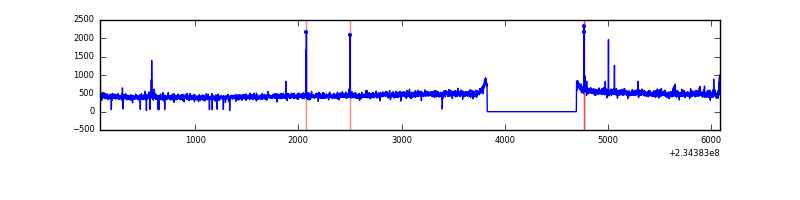 |
| D | 6010 | 5144 | 130 | 130 | 2.16% | 2.53% | 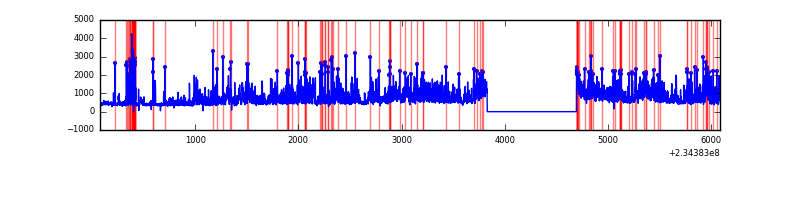 |
Top three noisy pixels from each quadrant. If the there are fewer than three noisy pixels in the level2.evt file, extra rows are filled as -1
| Pixel properties | Quadrant properties | ||||||
|---|---|---|---|---|---|---|---|
| Quadrant | DetID | PixID | Counts | Sigma | Mean | Median | Sigma |
| A | 8 | 5 | 525427 | 4241.15 | 600 | 588 | 123.7 |
| A | 1 | 162 | 55808 | 446.22 | 600 | 588 | 123.7 |
| A | 1 | 178 | 10886 | 83.22 | 600 | 588 | 123.7 |
| B | 0 | 214 | 24939 | 207.8 | 603 | 587 | 117.2 |
| B | 12 | 111 | 13033 | 106.21 | 603 | 587 | 117.2 |
| B | 11 | 111 | 10578 | 85.26 | 603 | 587 | 117.2 |
| C | 14 | 234 | 41432 | 297.12 | 584 | 586 | 137.5 |
| C | 9 | 68 | 30675 | 218.87 | 584 | 586 | 137.5 |
| C | 13 | 61 | 4305 | 27.05 | 584 | 586 | 137.5 |
| D | 1 | 52 | 1823745 | 12400.95 | 573 | 558 | 147.0 |
| D | 2 | 14 | 63895 | 430.81 | 573 | 558 | 147.0 |
| D | 2 | 234 | 20949 | 138.7 | 573 | 558 | 147.0 |
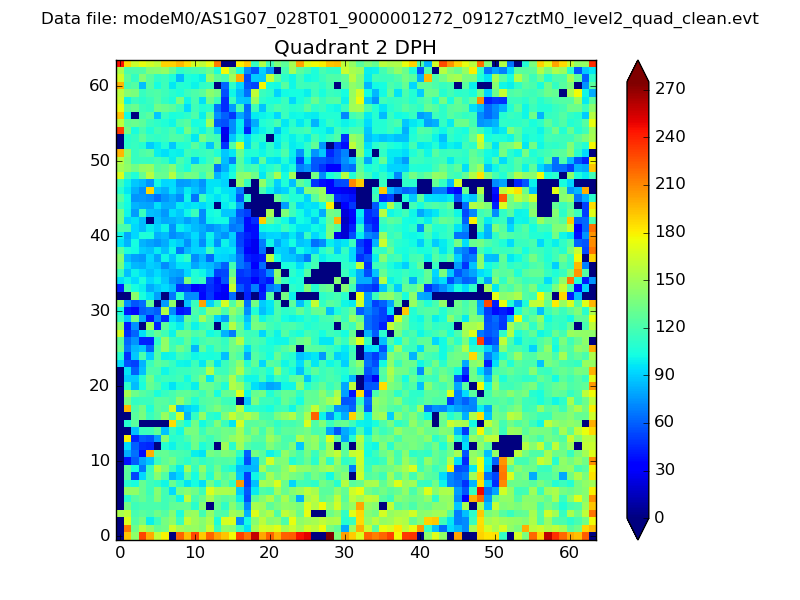
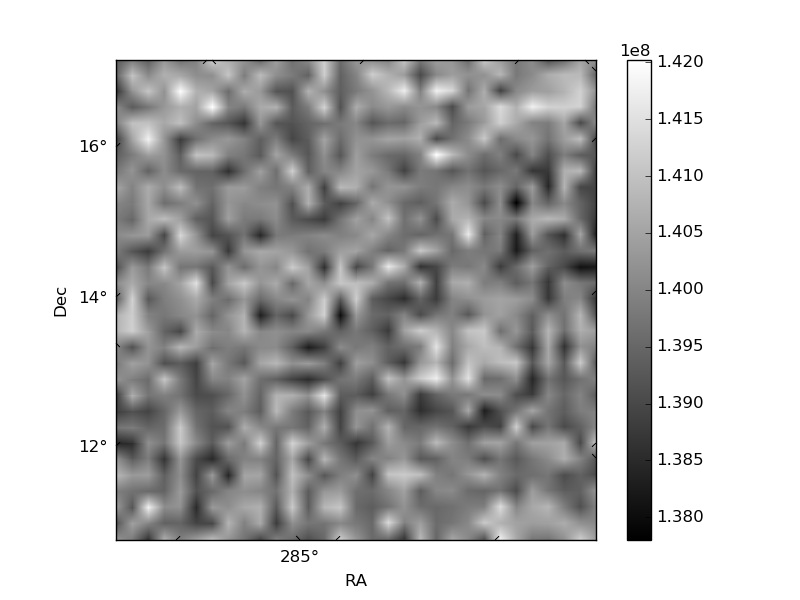
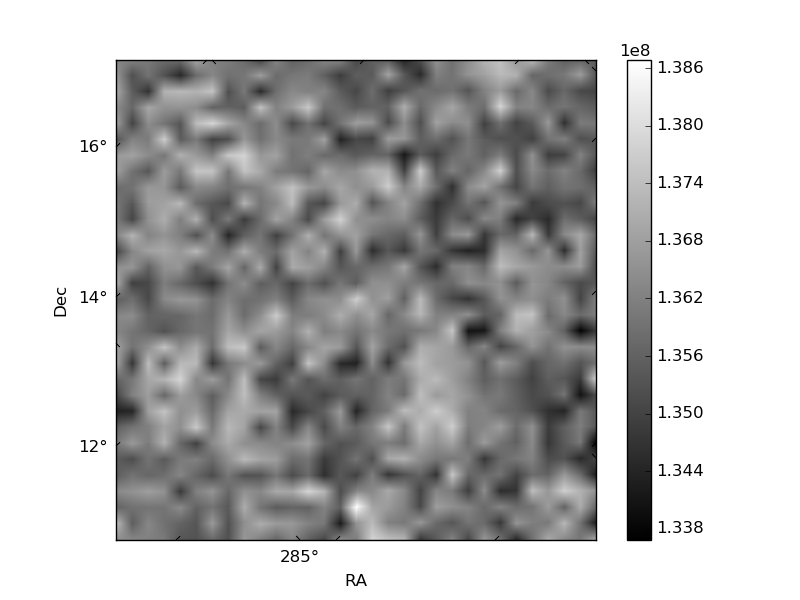
Histogram calculated using DETX and DETY for each event in the final _common_clean file
| Quadrant A | 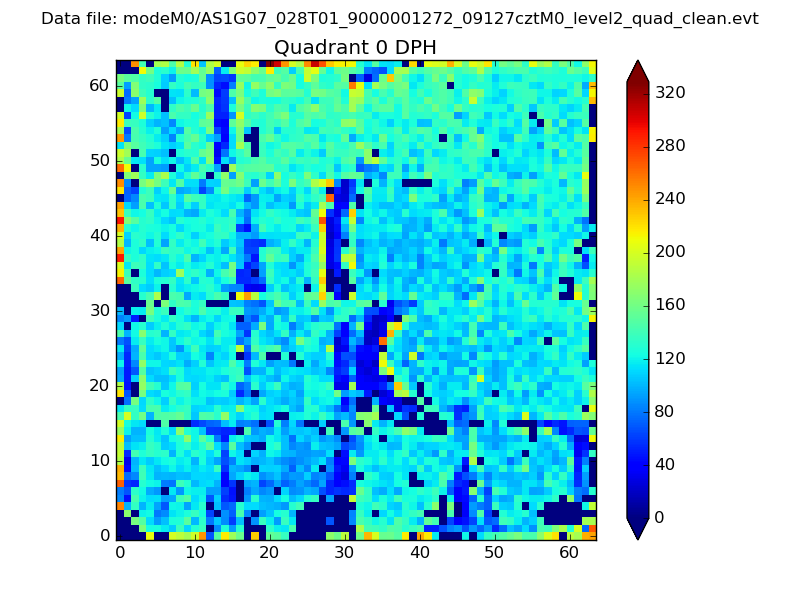 |
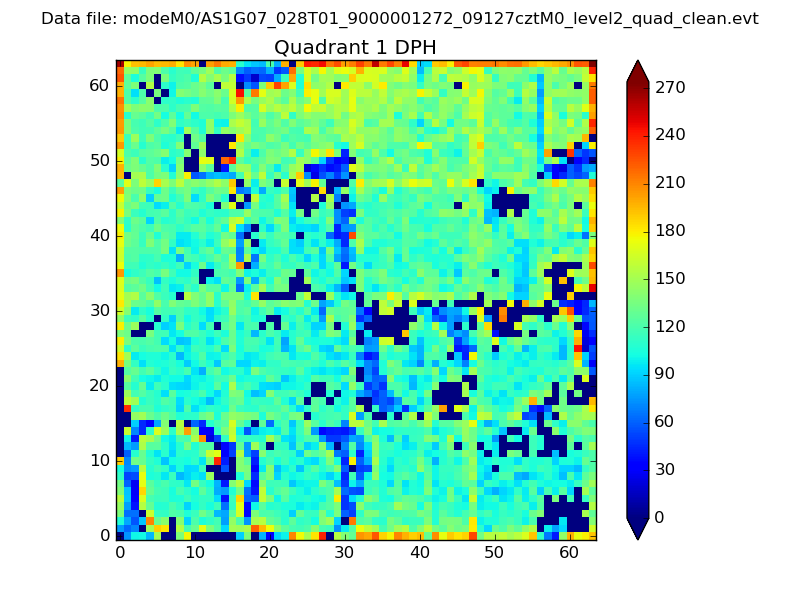 |
Quadrant B |
|---|---|---|---|
| Quadrant D | 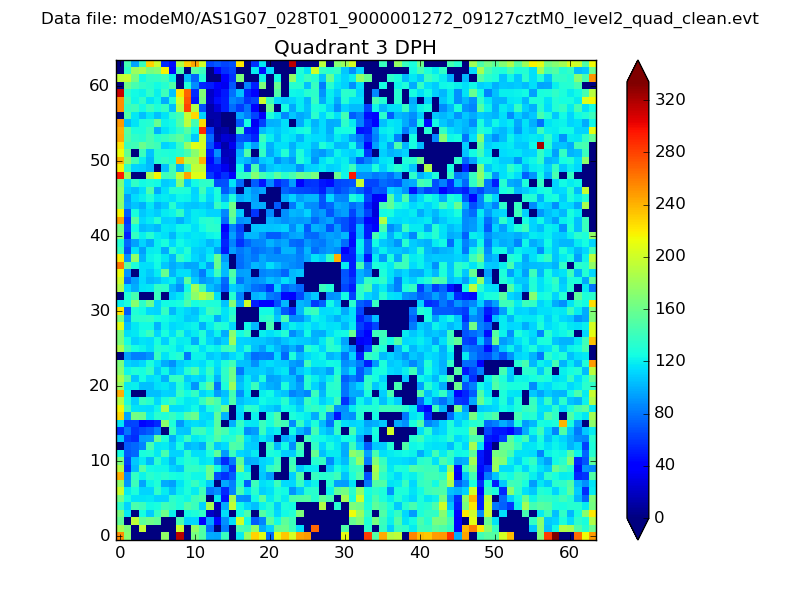 |
 |
Quadrant C |
| Plot type | Count rate plots | Images |
|---|---|---|
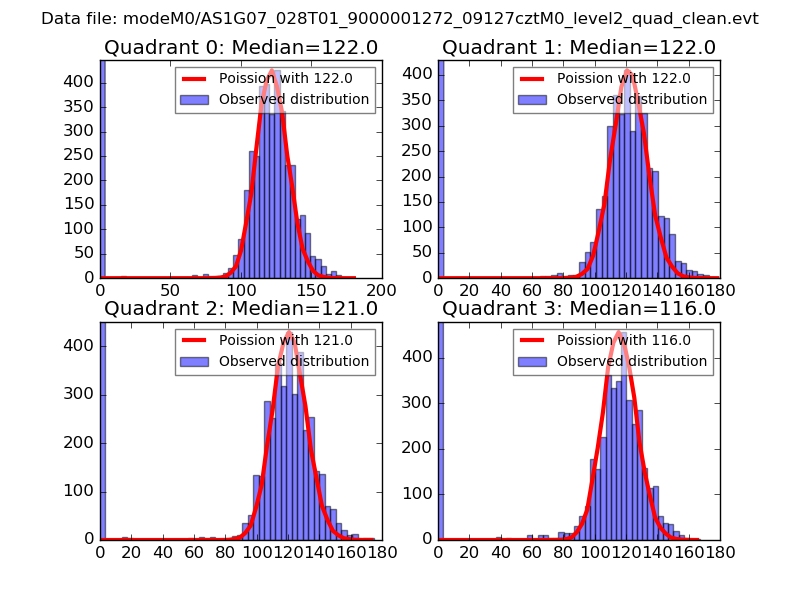
| Comparison with Poisson distribution Blue bars denote a histogram of data divided into 1 sec bins. Red curve is a Poisson curve with rate = median count rate of data. |
 |
 |
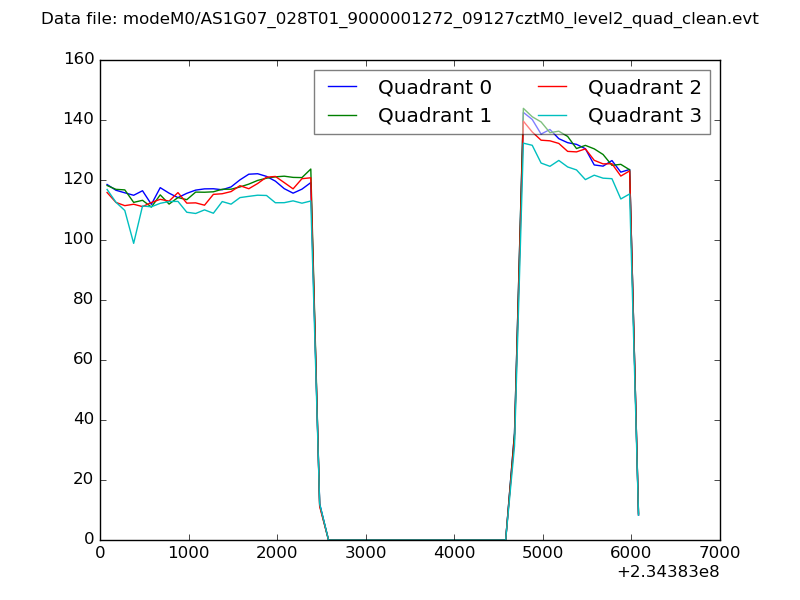
| Quadrant-wise count rates Data is divided into 100 sec bins |
 |
|
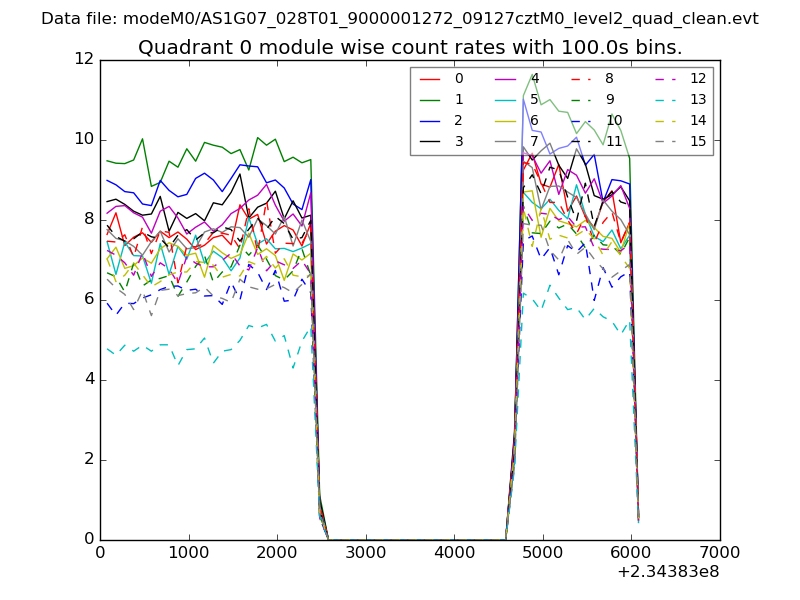
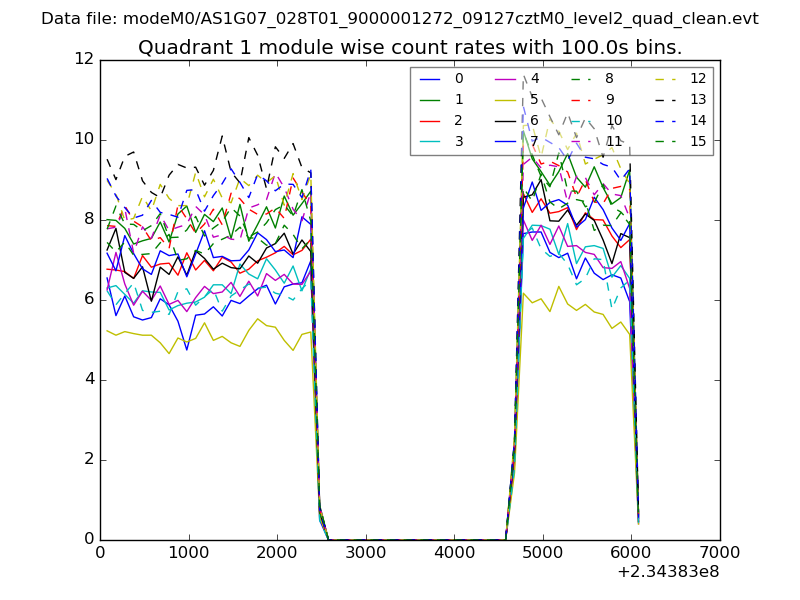
| Module-wise count rates for Quadrant A Data is divided into 100 sec bins |
 |
 |
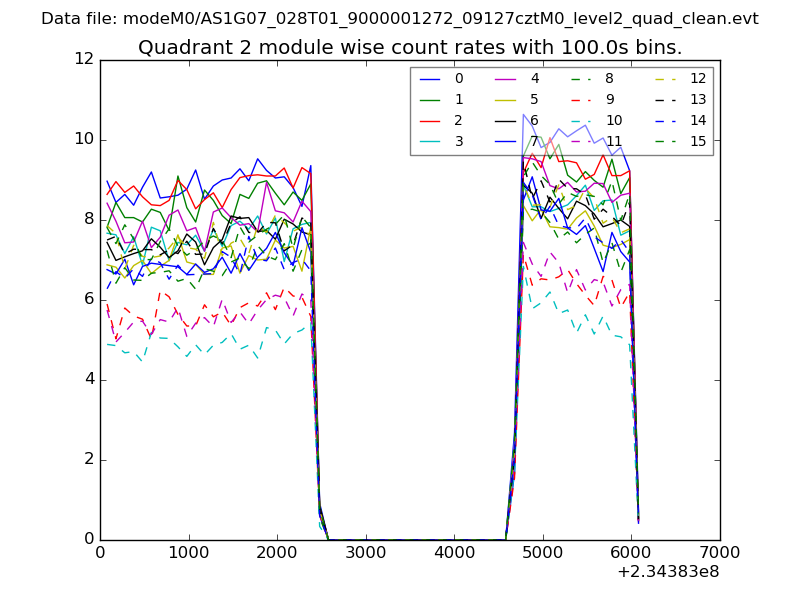
| Module-wise count rates for Quadrant B Data is divided into 100 sec bins |
 |
 |
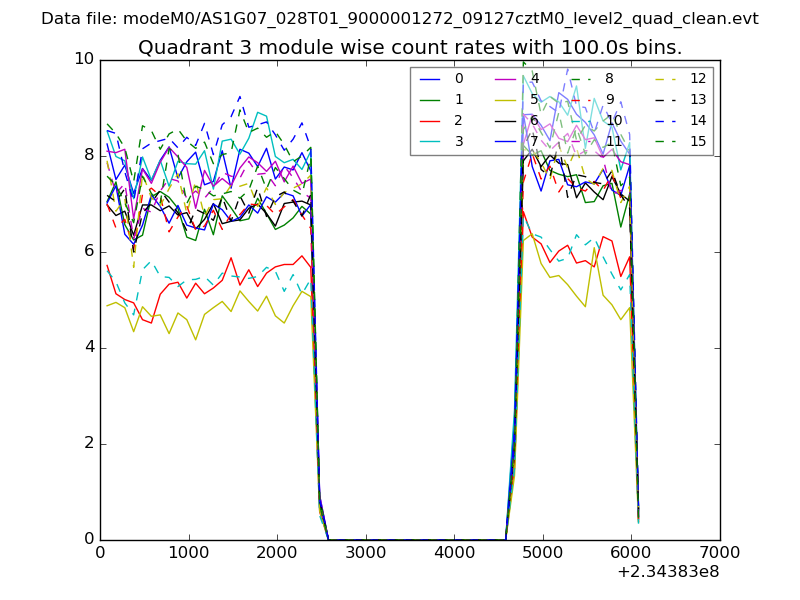
| Module-wise count rates for Quadrant C Data is divided into 100 sec bins |
 |
 |
| Module-wise count rates for Quadrant D Data is divided into 100 sec bins |
 |
 |
| Parameter | Plot |
|---|---|
| CZT HV Monitor | 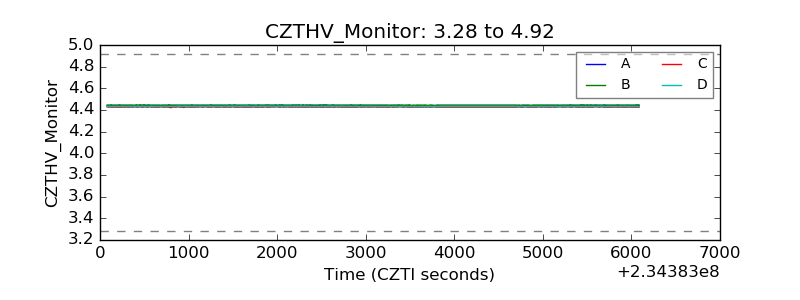 |
| D_VDD | 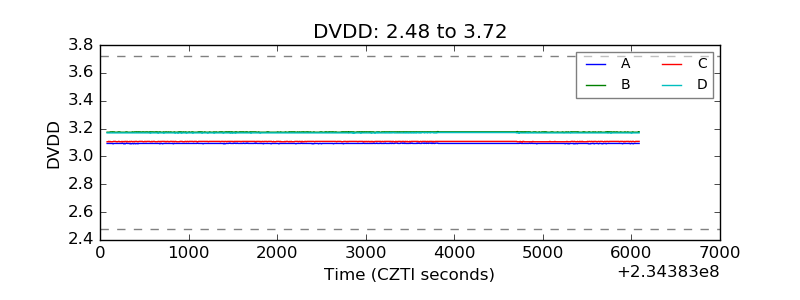 |
| Temperature 1 |  |
| Veto HV Monitor | 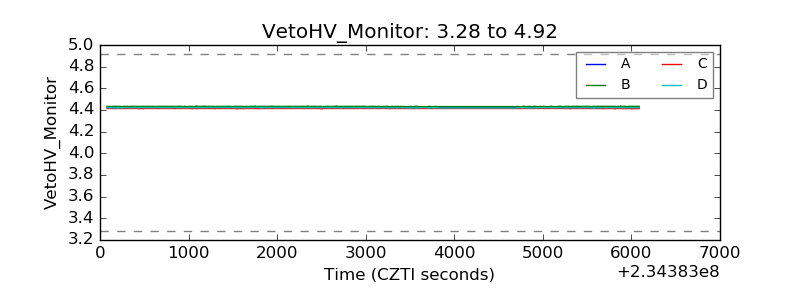 |
| Veto LLD | 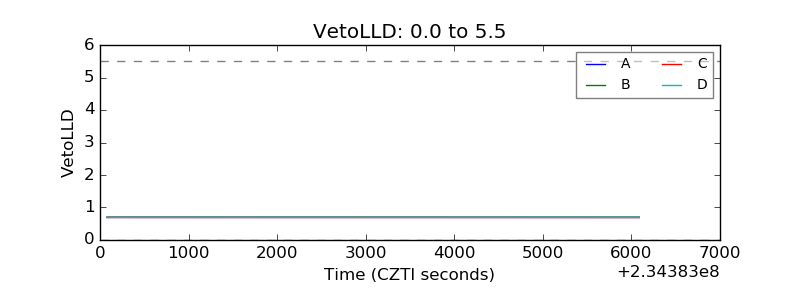 |
| Alpha Counter | 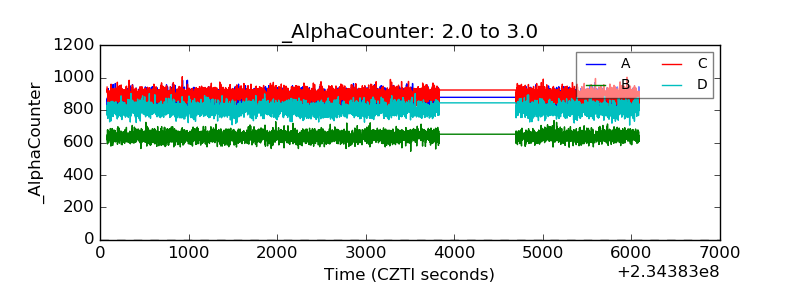 |
| _CPM_Rate | 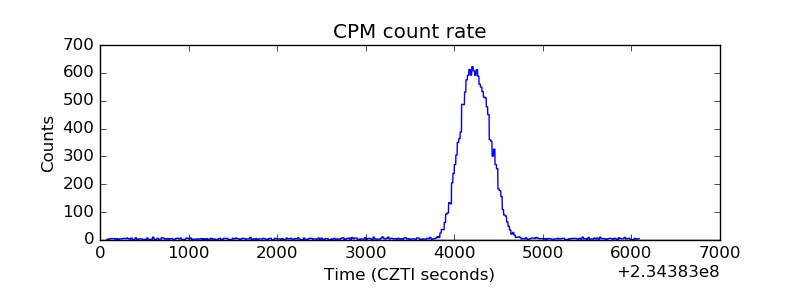 |
| CZT Counter | 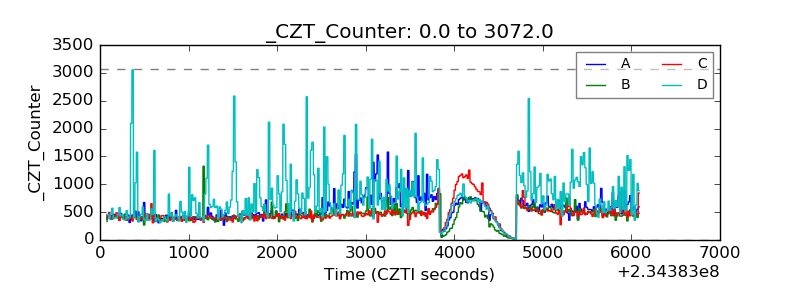 |
| +2.5 Volts monitor |  |
| +5 Volts monitor |  |
| _ROLL_ROT | 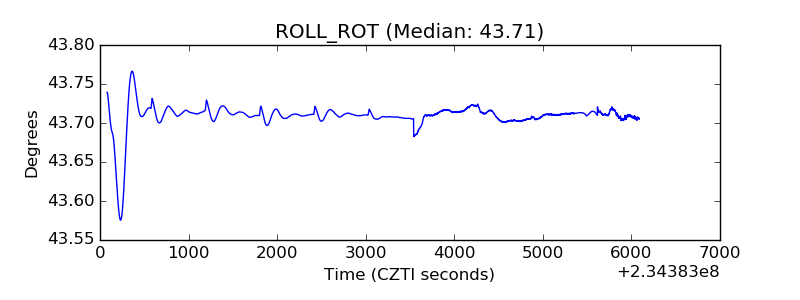 |
| _Roll_DEC | 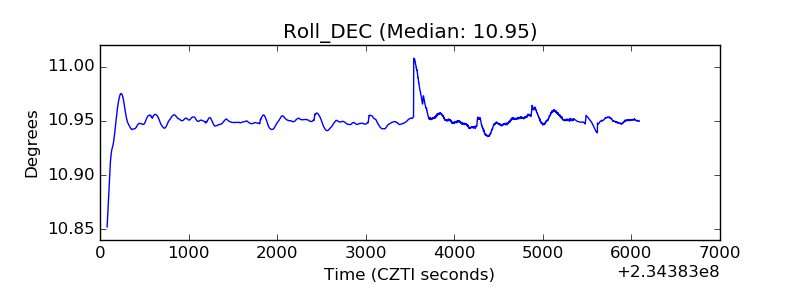 |
| _Roll_RA | 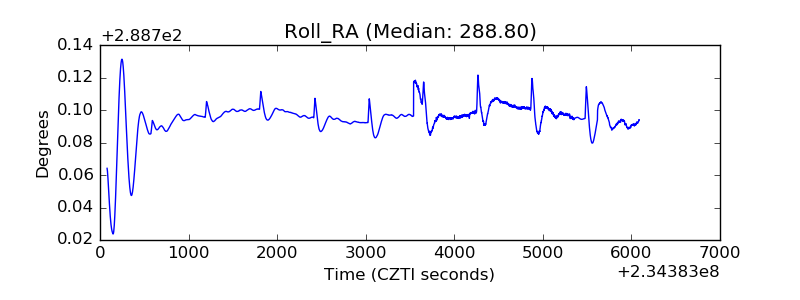 |
| Veto Counter | 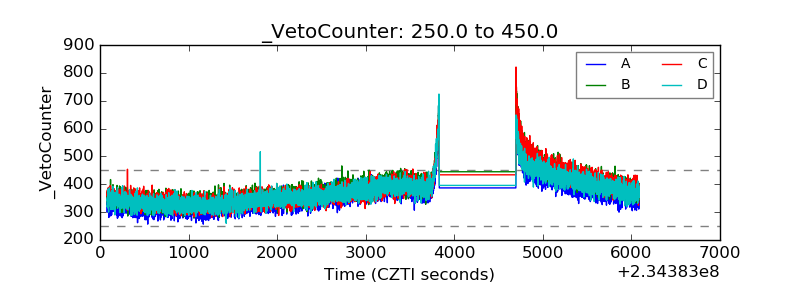 |