| Param | Original file | Final file |
|---|---|---|
| Filename | modeM0/AS1G07_028T01_9000001272_09128cztM0_level2.evt | modeM0/AS1G07_028T01_9000001272_09128cztM0_level2_quad_clean.evt |
| Size (bytes) | 506,471,040 | 95,572,800 |
| Size | 483.0 MB | 91.1 MB |
| Events in quadrant A | 4,315,003 | 614,280 |
| Events in quadrant B | 3,133,873 | 624,937 |
| Events in quadrant C | 3,097,403 | 612,943 |
| Events in quadrant D | 4,346,959 | 584,404 |
| Mode M9 | |||
|---|---|---|---|
| Quadrant | BADHDUFLAG | Total packets | Discarded packets |
| A | 0 | 17 | 0 |
| B | 0 | 17 | 0 |
| C | 0 | 17 | 0 |
| D | 0 | 18 | 0 |
| Mode M0 | |||
|---|---|---|---|
| Quadrant | BADHDUFLAG | Total packets | Discarded packets |
| A | 0 | 17362 | 35 |
| B | 0 | 13690 | 17 |
| C | 0 | 13664 | 23 |
| D | 0 | 17730 | 47 |
| Mode SS | |||
|---|---|---|---|
| Quadrant | BADHDUFLAG | Total packets | Discarded packets |
| A | 0 | 132 | 0 |
| B | 0 | 132 | 0 |
| C | 0 | 132 | 0 |
| D | 0 | 132 | 0 |
| Quadrant | Total seconds | Saturated seconds | Saturation percentage |
|---|---|---|---|
| A | 6566 | 135 | 2.056046% |
| B | 6572 | 35 | 0.532562% |
| C | 6568 | 36 | 0.548112% |
| D | 6564 | 266 | 4.052407% |
Noise dominated data is calculated using 1-second bins in cleaned event files. If a bin has >2000 counts, and if more than 50% of those come from <1% of pixels, then it is considered to be noise-dominated and hence unusable.
| Quadrant | # 1 sec bins | Bins with >0 counts | Bins with >2000 counts | High rate bins dominated by noise | Noise dominated (total time) | Noise dominated (detector-on time) | Marked lightcurve |
|---|---|---|---|---|---|---|---|
| A | 7598 | 6577 | 55 | 55 | 0.72% | 0.84% | 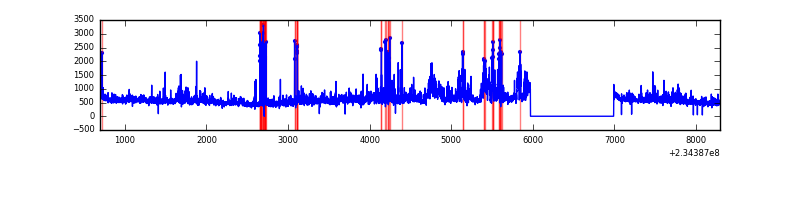 |
| B | 7598 | 6578 | 1 | 1 | 0.01% | 0.02% | 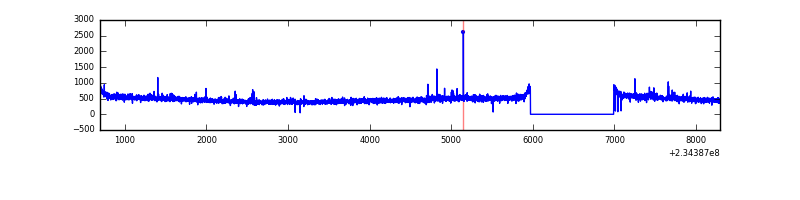 |
| C | 7598 | 6577 | 5 | 5 | 0.07% | 0.08% | 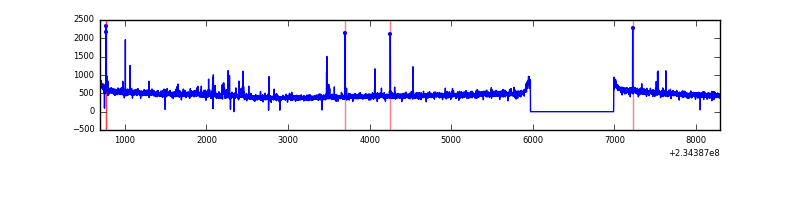 |
| D | 7598 | 6578 | 200 | 200 | 2.63% | 3.04% |  |
Top three noisy pixels from each quadrant. If the there are fewer than three noisy pixels in the level2.evt file, extra rows are filled as -1
| Pixel properties | Quadrant properties | ||||||
|---|---|---|---|---|---|---|---|
| Quadrant | DetID | PixID | Counts | Sigma | Mean | Median | Sigma |
| A | 8 | 5 | 1117400 | 6955.07 | 783 | 767 | 160.5 |
| A | 4 | 2 | 79364 | 489.55 | 783 | 767 | 160.5 |
| A | 1 | 162 | 67087 | 413.08 | 783 | 767 | 160.5 |
| B | 0 | 214 | 53696 | 347.4 | 792 | 773 | 152.3 |
| B | 12 | 111 | 17306 | 108.53 | 792 | 773 | 152.3 |
| B | 11 | 111 | 14011 | 86.9 | 792 | 773 | 152.3 |
| C | 14 | 234 | 68020 | 372.34 | 771 | 776 | 180.6 |
| C | 9 | 68 | 17625 | 93.29 | 771 | 776 | 180.6 |
| C | 12 | 4 | 5957 | 28.69 | 771 | 776 | 180.6 |
| D | 1 | 52 | 1336788 | 6923.18 | 754 | 735 | 193.0 |
| D | 2 | 14 | 99974 | 514.24 | 754 | 735 | 193.0 |
| D | 2 | 234 | 23496 | 117.94 | 754 | 735 | 193.0 |
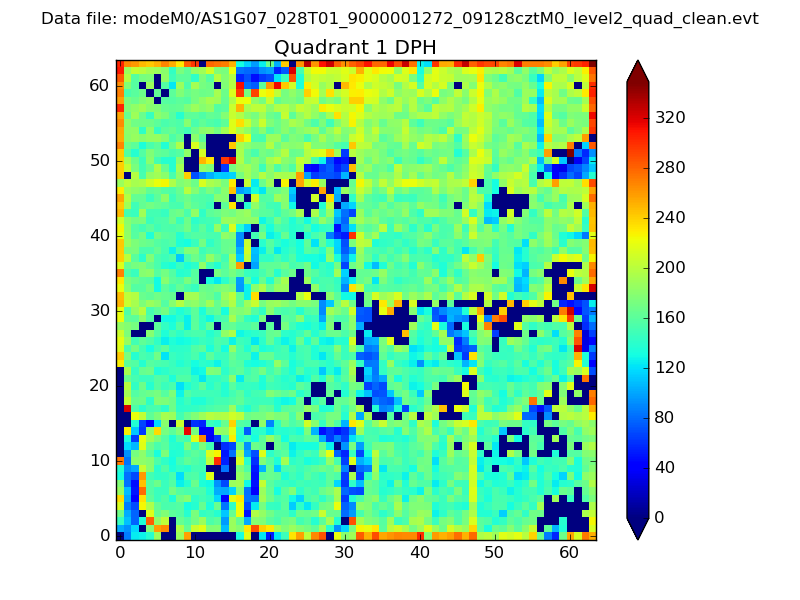
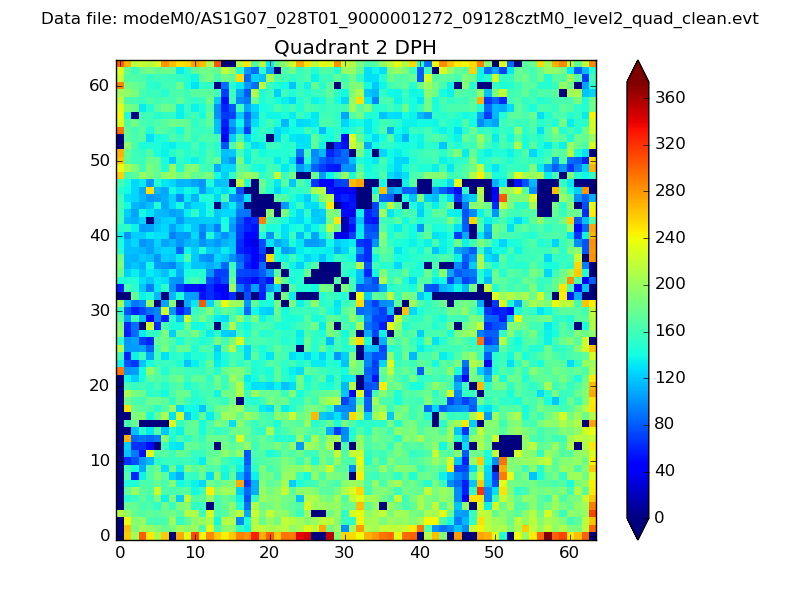
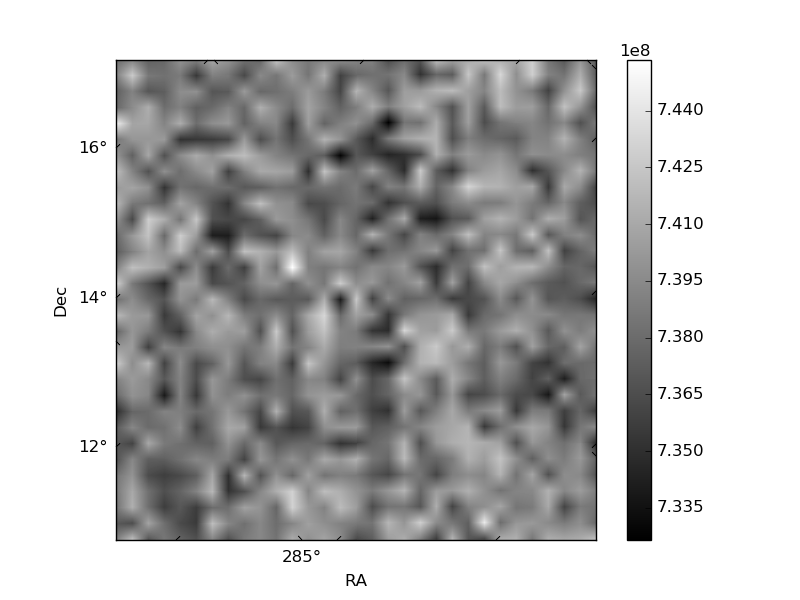
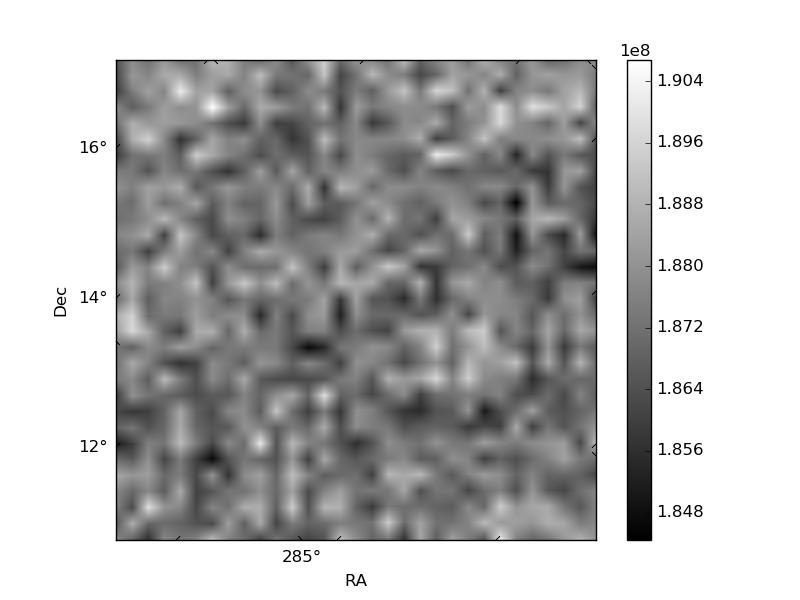
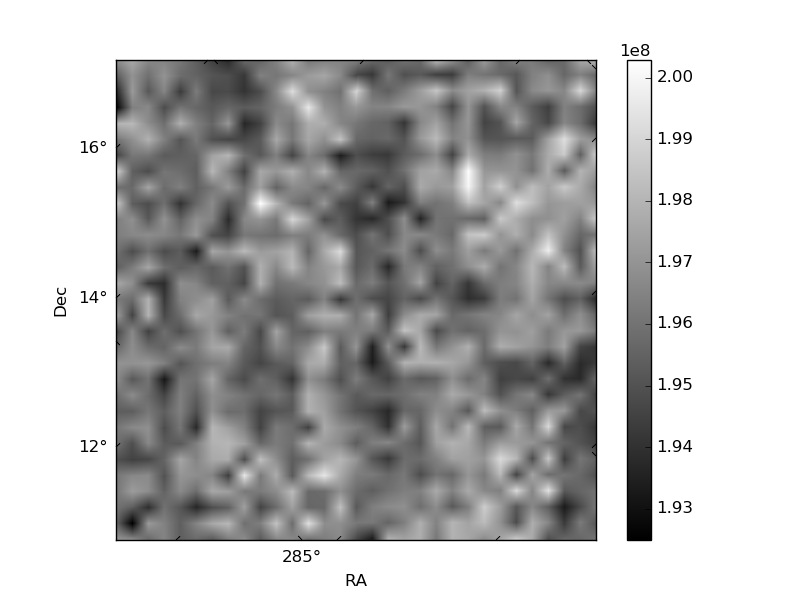
Histogram calculated using DETX and DETY for each event in the final _common_clean file
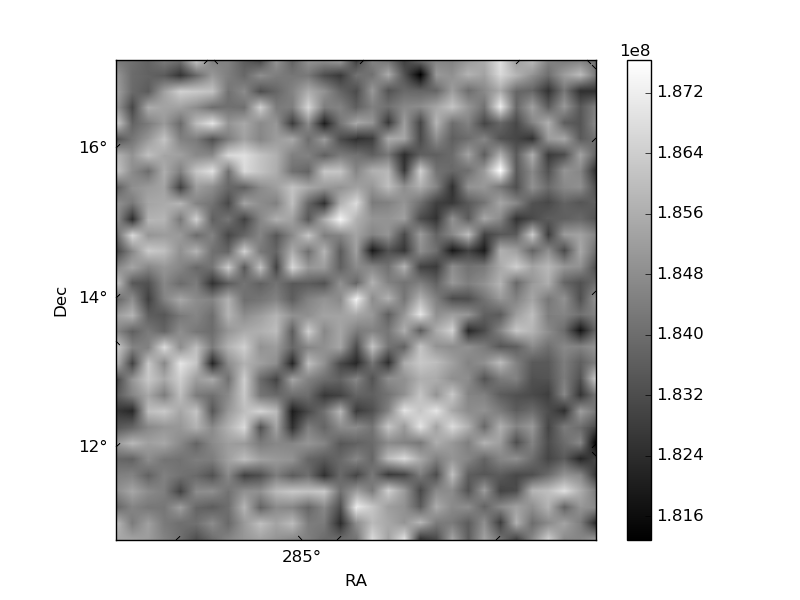
| Quadrant A | 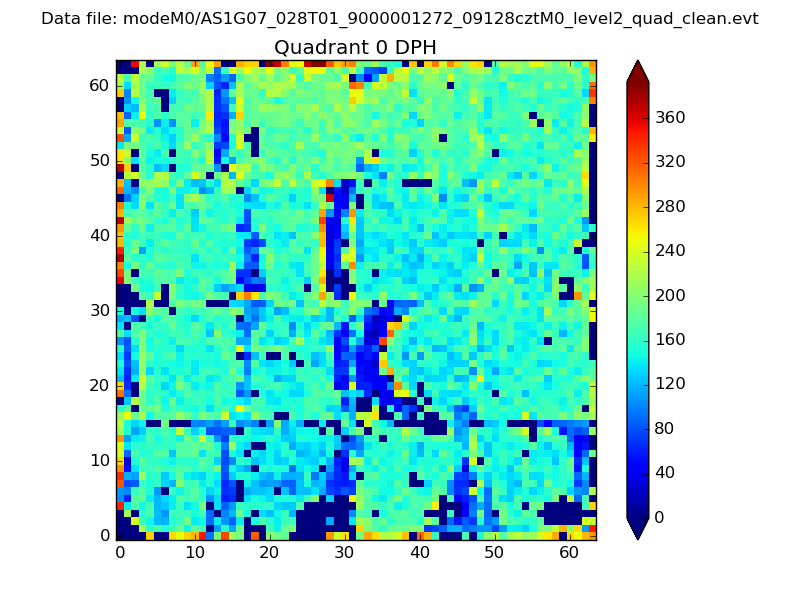 |
 |
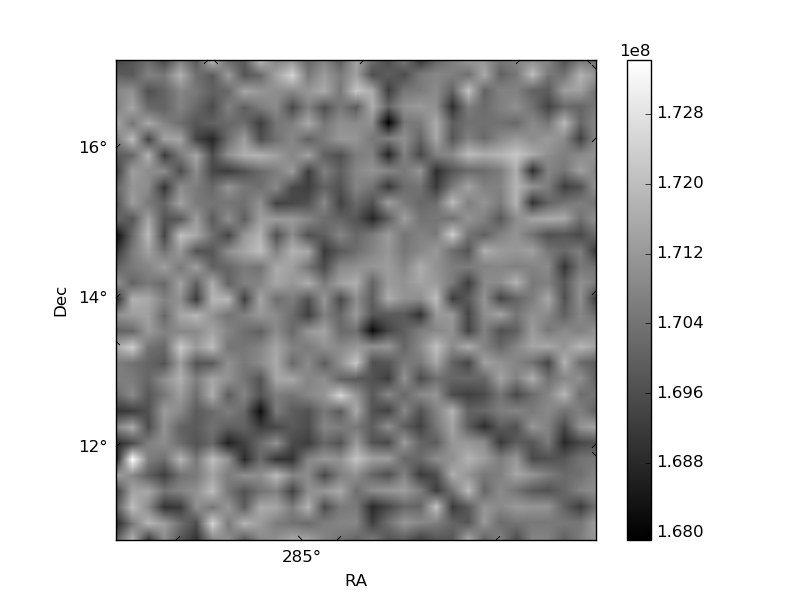
Quadrant B |
|---|---|---|---|
| Quadrant D | 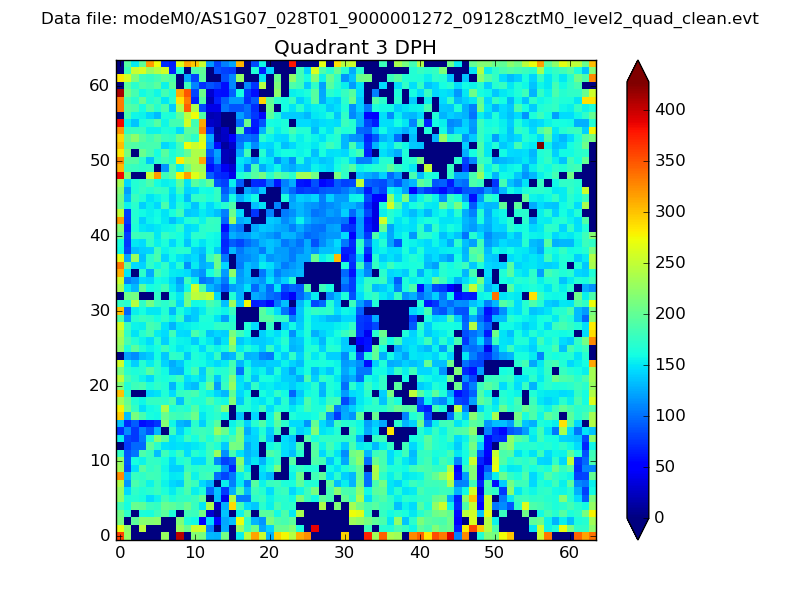 |
 |
Quadrant C |
| Plot type | Count rate plots | Images |
|---|---|---|
| Comparison with Poisson distribution Blue bars denote a histogram of data divided into 1 sec bins. Red curve is a Poisson curve with rate = median count rate of data. |
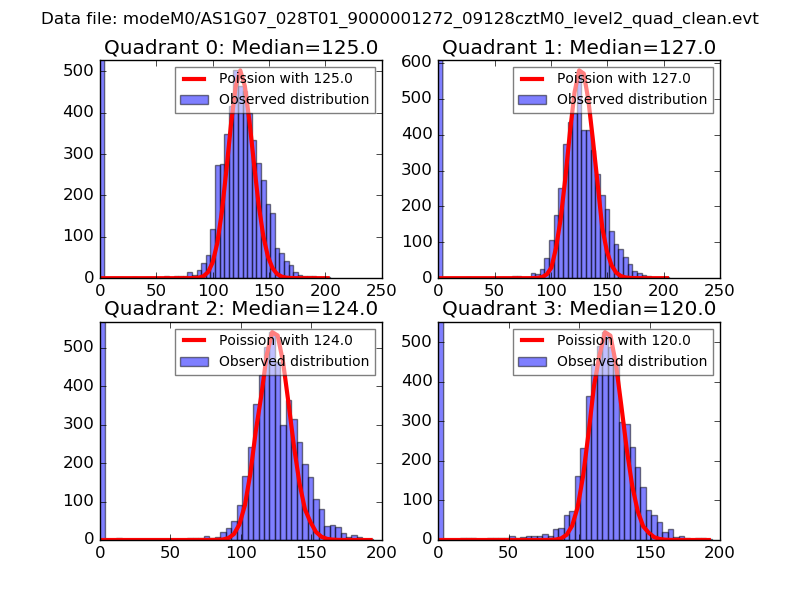 |
 |
| Quadrant-wise count rates Data is divided into 100 sec bins |
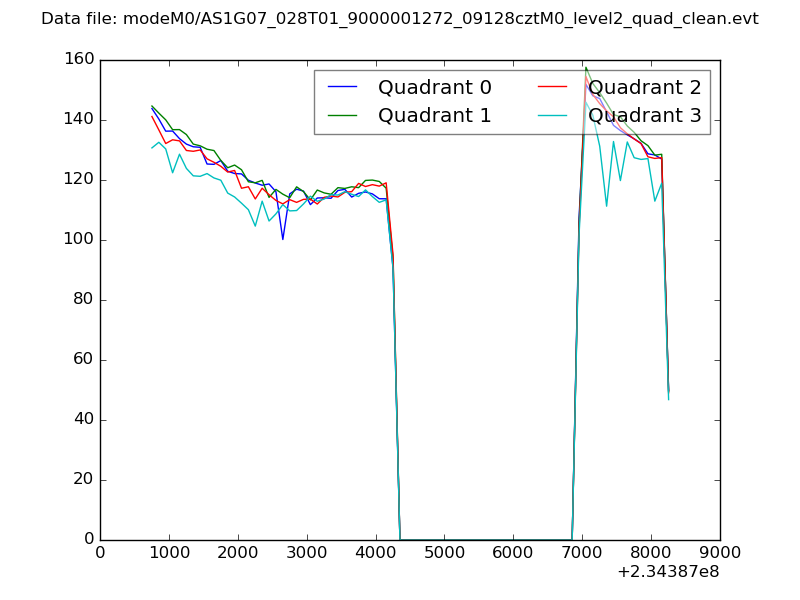 |
|
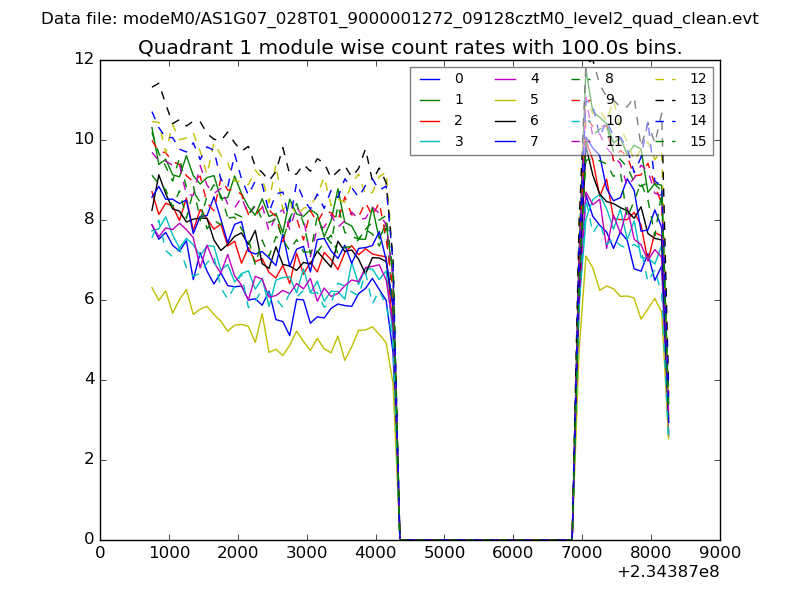
| Module-wise count rates for Quadrant A Data is divided into 100 sec bins |
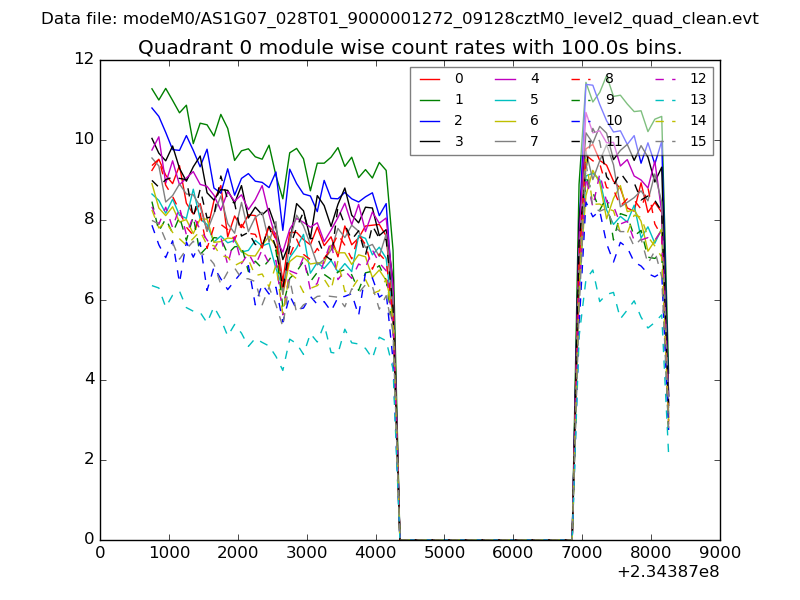 |
 |
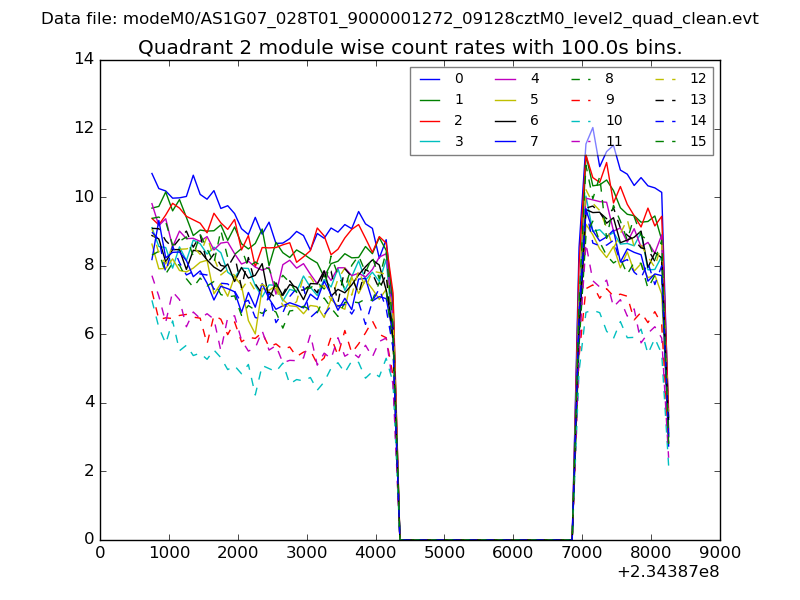
| Module-wise count rates for Quadrant B Data is divided into 100 sec bins |
 |
 |
| Module-wise count rates for Quadrant C Data is divided into 100 sec bins |
 |
 |
| Module-wise count rates for Quadrant D Data is divided into 100 sec bins |
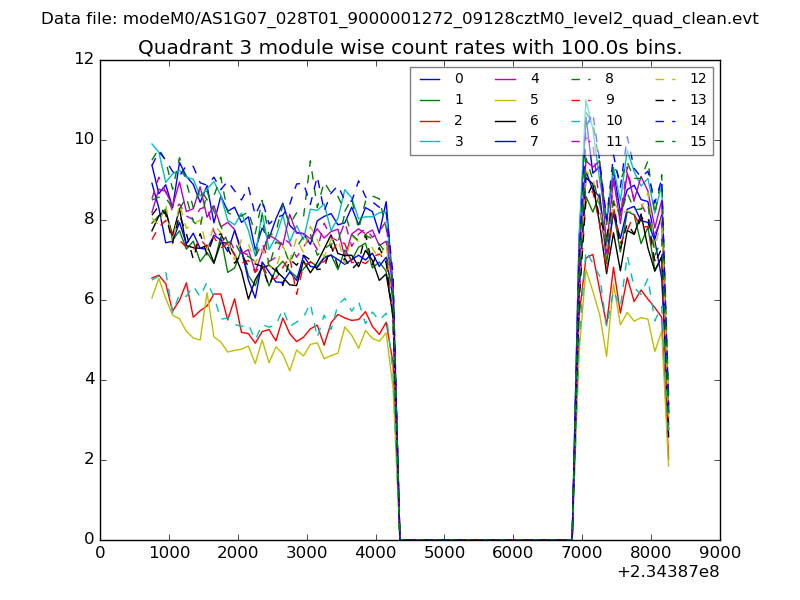 |
 |
| Parameter | Plot |
|---|---|
| CZT HV Monitor | 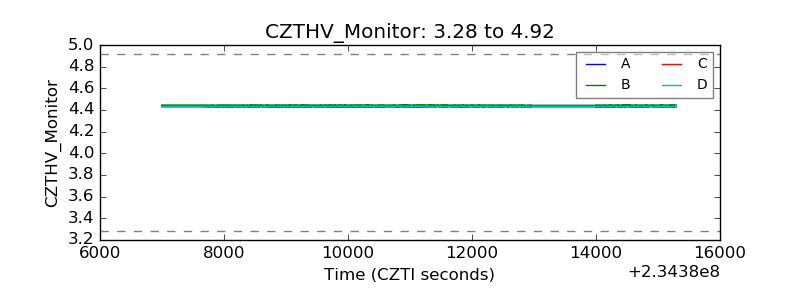 |
| D_VDD | 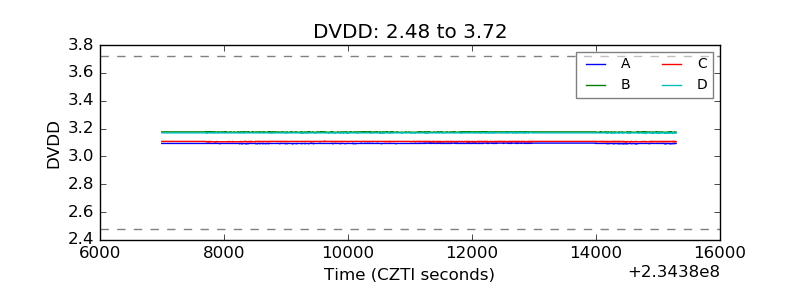 |
| Temperature 1 | 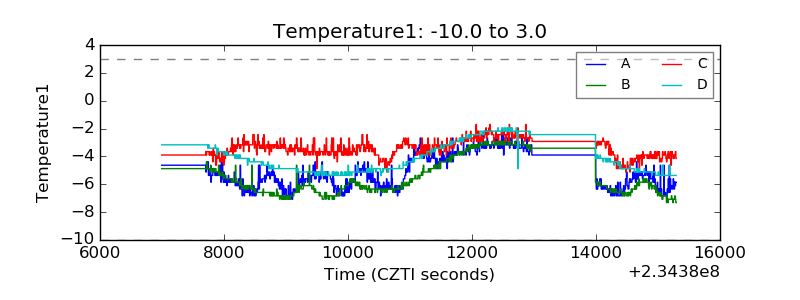 |
| Veto HV Monitor | 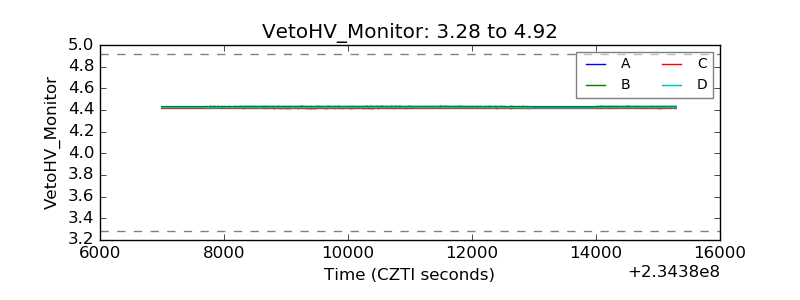 |
| Veto LLD | 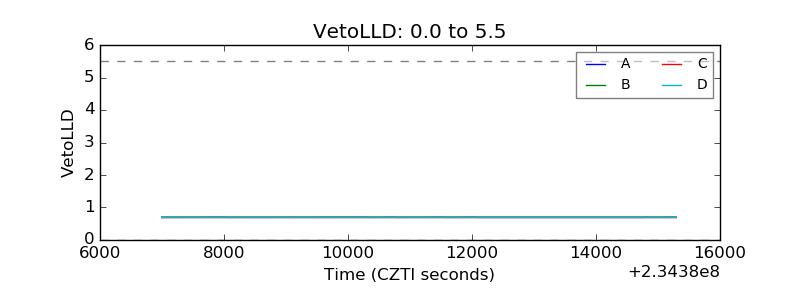 |
| Alpha Counter | 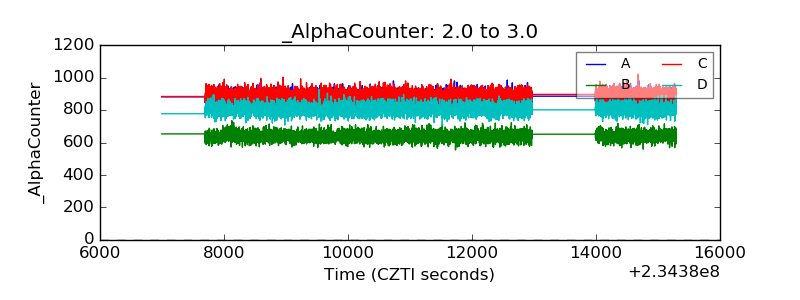 |
| _CPM_Rate | 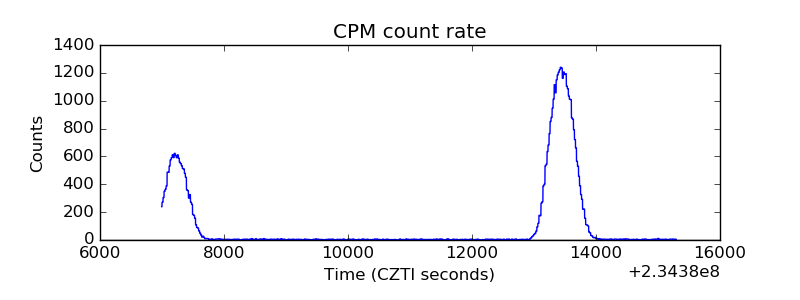 |
| CZT Counter | 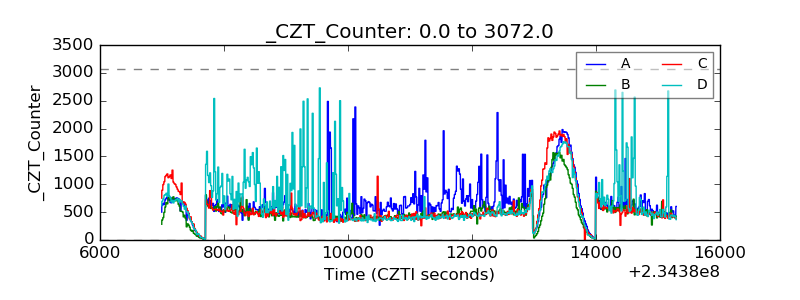 |
| +2.5 Volts monitor |  |
| +5 Volts monitor |  |
| _ROLL_ROT | 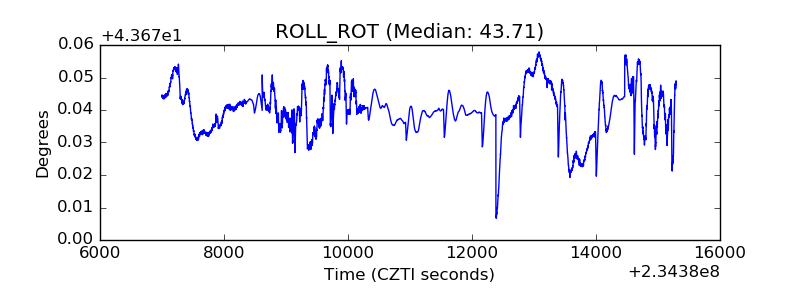 |
| _Roll_DEC | 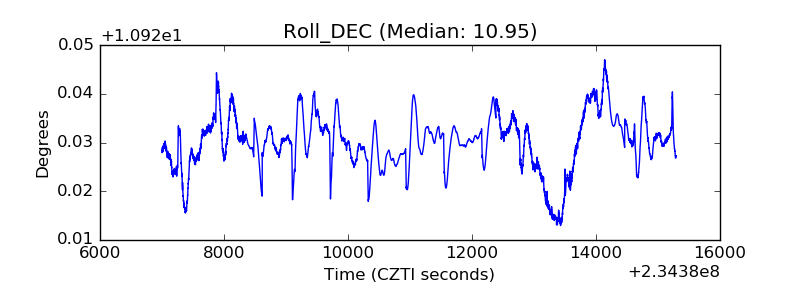 |
| _Roll_RA | 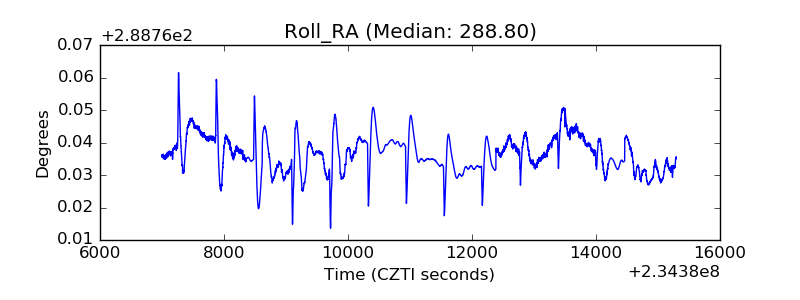 |
| Veto Counter | 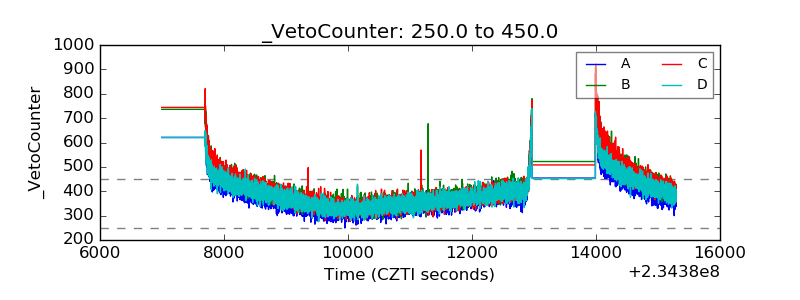 |