| Param | Original file | Final file |
|---|---|---|
| Filename | modeM0/AS1G07_028T01_9000001272_09131cztM0_level2.evt | modeM0/AS1G07_028T01_9000001272_09131cztM0_level2_quad_clean.evt |
| Size (bytes) | 131,181,120 | 39,072,960 |
| Size | 125.1 MB | 37.3 MB |
| Events in quadrant A | 1,071,880 | 262,396 |
| Events in quadrant B | 915,617 | 270,647 |
| Events in quadrant C | 889,208 | 260,304 |
| Events in quadrant D | 967,028 | 253,752 |
| Mode M9 | |||
|---|---|---|---|
| Quadrant | BADHDUFLAG | Total packets | Discarded packets |
| A | 0 | 5 | 0 |
| B | 0 | 5 | 0 |
| C | 0 | 5 | 0 |
| D | 0 | 6 | 0 |
| Mode M0 | |||
|---|---|---|---|
| Quadrant | BADHDUFLAG | Total packets | Discarded packets |
| A | 0 | 4375 | 7 |
| B | 0 | 3954 | 1 |
| C | 0 | 3893 | 1 |
| D | 0 | 4196 | 1 |
| Mode SS | |||
|---|---|---|---|
| Quadrant | BADHDUFLAG | Total packets | Discarded packets |
| A | 0 | 38 | 0 |
| B | 0 | 38 | 0 |
| C | 0 | 38 | 0 |
| D | 0 | 38 | 0 |
| Quadrant | Total seconds | Saturated seconds | Saturation percentage |
|---|---|---|---|
| A | 1856 | 8 | 0.431034% |
| B | 1858 | 6 | 0.322928% |
| C | 1858 | 2 | 0.107643% |
| D | 1858 | 24 | 1.291712% |
Noise dominated data is calculated using 1-second bins in cleaned event files. If a bin has >2000 counts, and if more than 50% of those come from <1% of pixels, then it is considered to be noise-dominated and hence unusable.
| Quadrant | # 1 sec bins | Bins with >0 counts | Bins with >2000 counts | High rate bins dominated by noise | Noise dominated (total time) | Noise dominated (detector-on time) | Marked lightcurve |
|---|---|---|---|---|---|---|---|
| A | 1858 | 1858 | 7 | 7 | 0.38% | 0.38% | 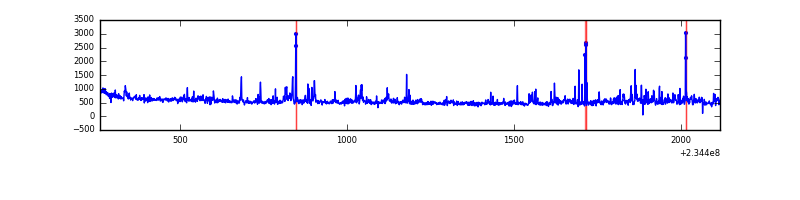 |
| B | 1858 | 1858 | 0 | 0 | 0.00% | 0.00% | 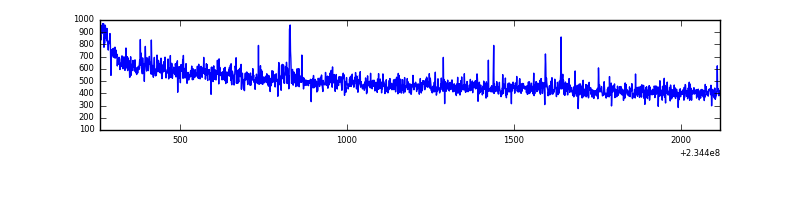 |
| C | 1858 | 1858 | 0 | 0 | 0.00% | 0.00% | 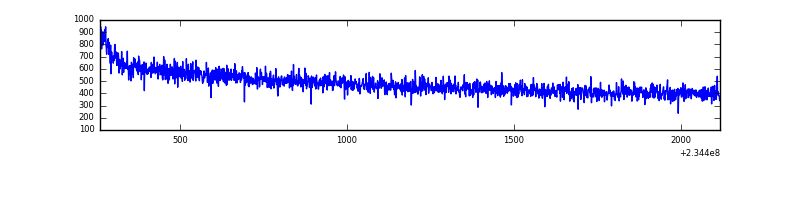 |
| D | 1858 | 1858 | 18 | 18 | 0.97% | 0.97% | 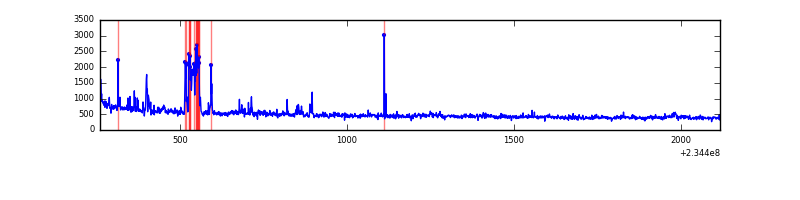 |
Top three noisy pixels from each quadrant. If the there are fewer than three noisy pixels in the level2.evt file, extra rows are filled as -1
| Pixel properties | Quadrant properties | ||||||
|---|---|---|---|---|---|---|---|
| Quadrant | DetID | PixID | Counts | Sigma | Mean | Median | Sigma |
| A | 8 | 5 | 141778 | 3002.45 | 228 | 224 | 47.1 |
| A | 1 | 162 | 21780 | 457.22 | 228 | 224 | 47.1 |
| A | 15 | 223 | 15915 | 332.82 | 228 | 224 | 47.1 |
| B | 0 | 214 | 9126 | 197.58 | 233 | 228 | 45.0 |
| B | 12 | 111 | 4793 | 101.36 | 233 | 228 | 45.0 |
| B | 11 | 111 | 3703 | 77.16 | 233 | 228 | 45.0 |
| C | 9 | 68 | 1856 | 30.16 | 227 | 228 | 54.0 |
| C | 13 | 61 | 1745 | 28.11 | 227 | 228 | 54.0 |
| C | 3 | 202 | 570 | 6.34 | 227 | 228 | 54.0 |
| D | 1 | 52 | 60701 | 1116.31 | 222 | 217 | 54.2 |
| D | 2 | 14 | 60254 | 1108.06 | 222 | 217 | 54.2 |
| D | 2 | 234 | 6216 | 110.72 | 222 | 217 | 54.2 |
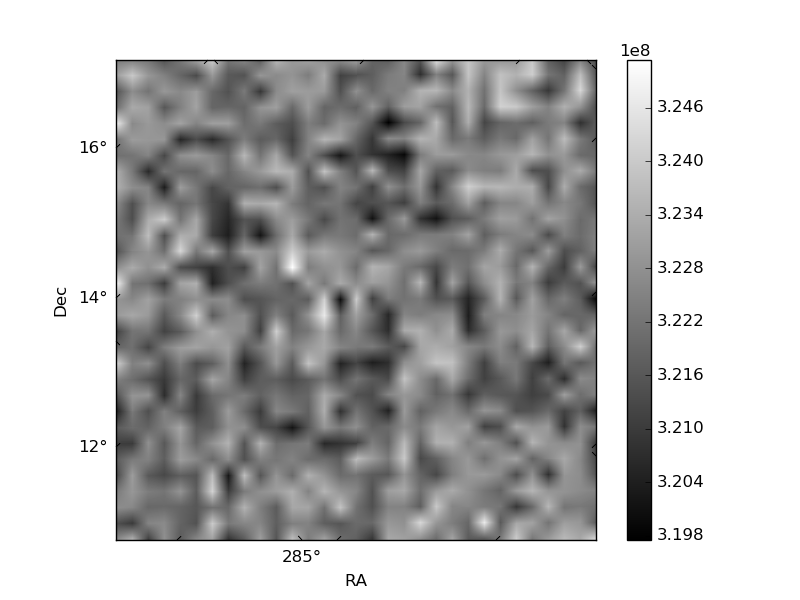
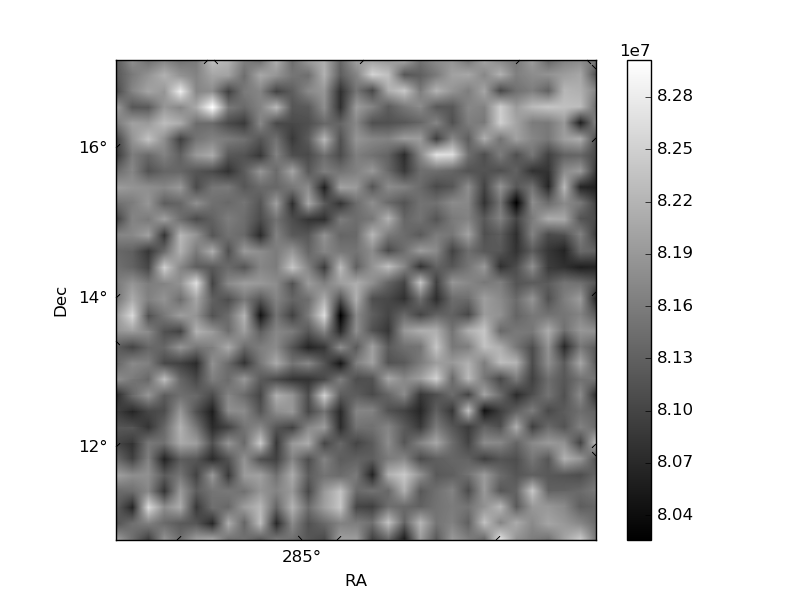
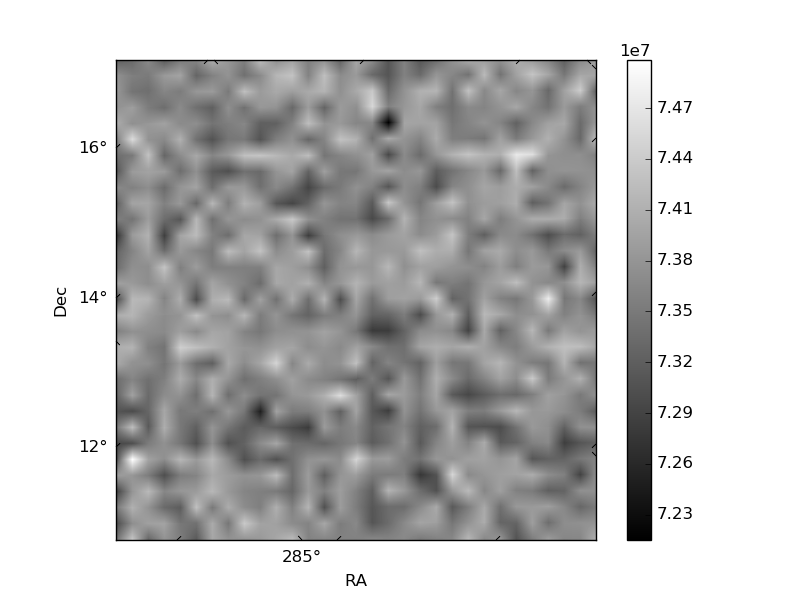
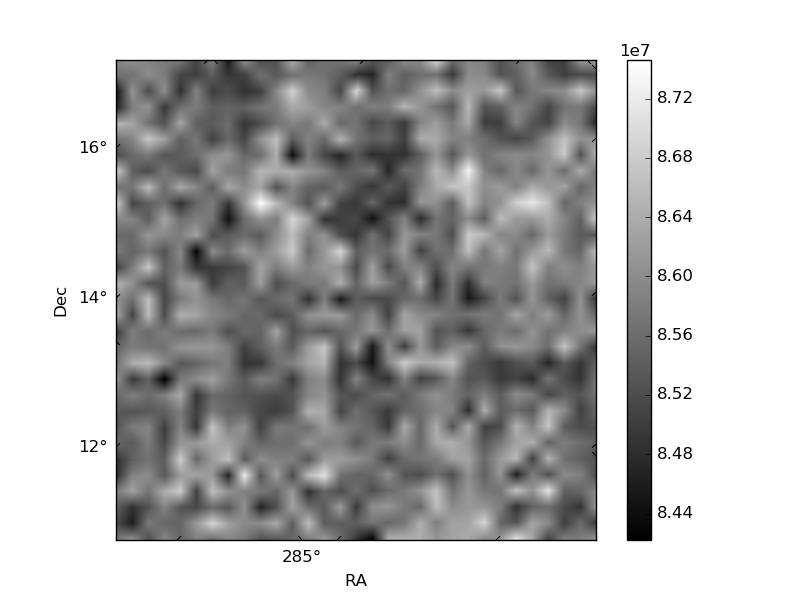
Histogram calculated using DETX and DETY for each event in the final _common_clean file
| Quadrant A | 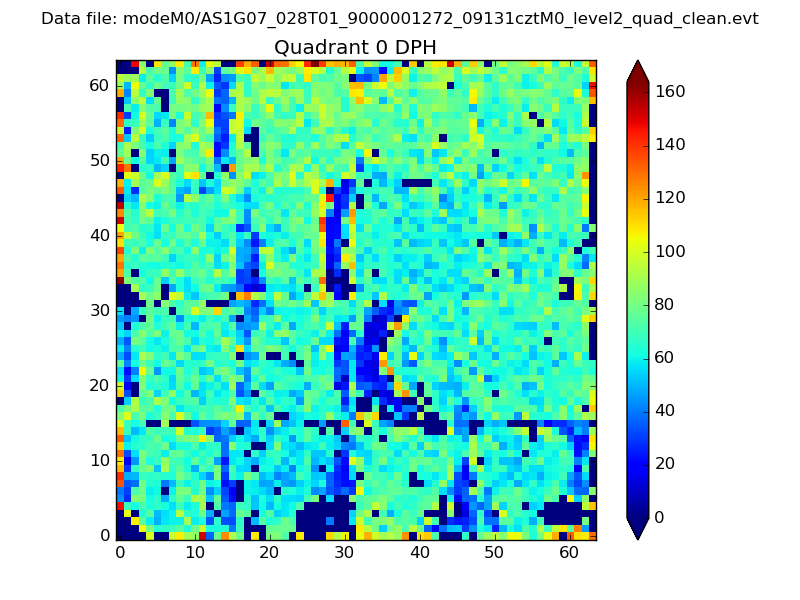 |
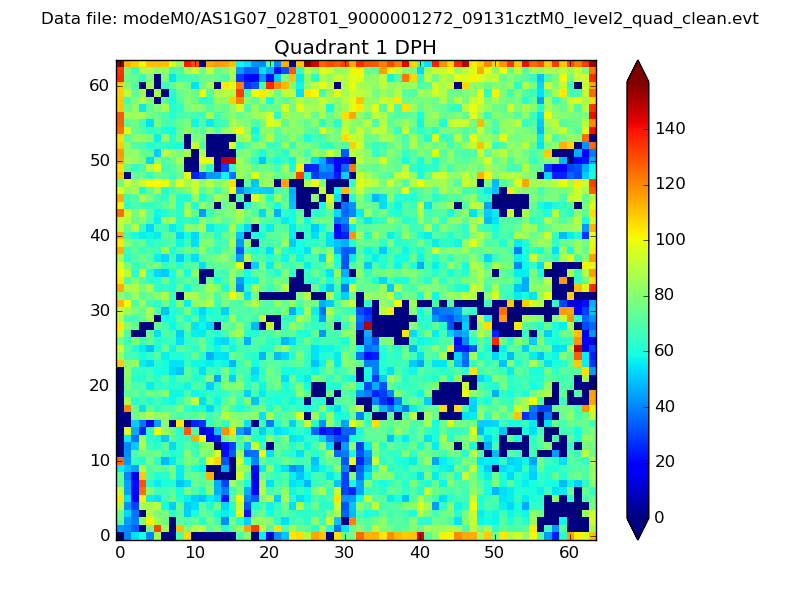 |
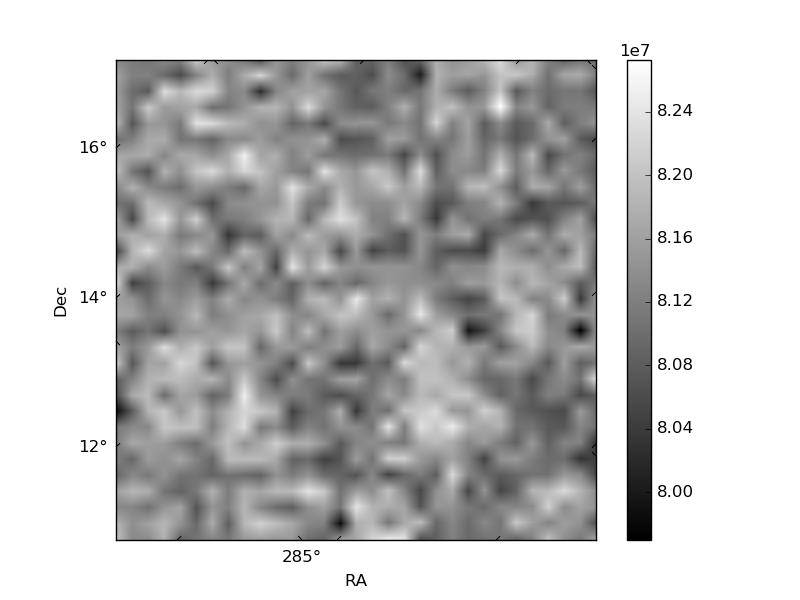
Quadrant B |
|---|---|---|---|
| Quadrant D | 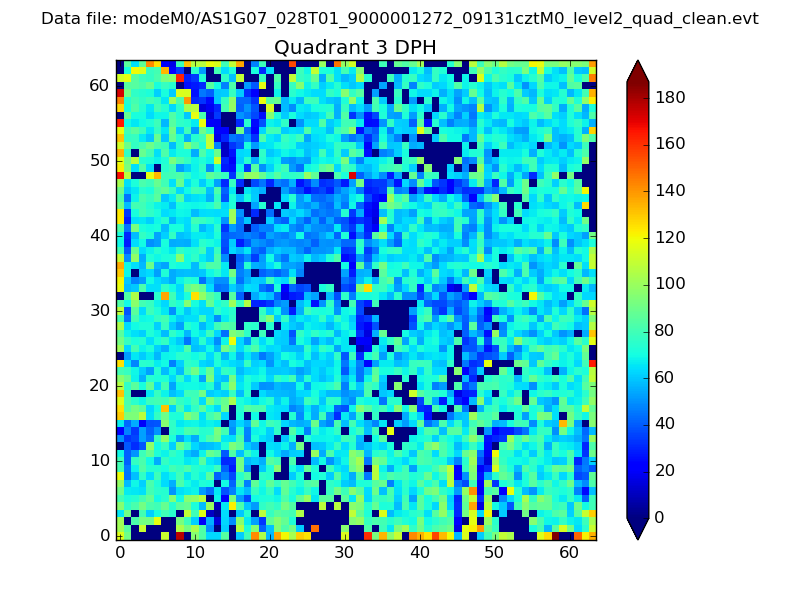 |
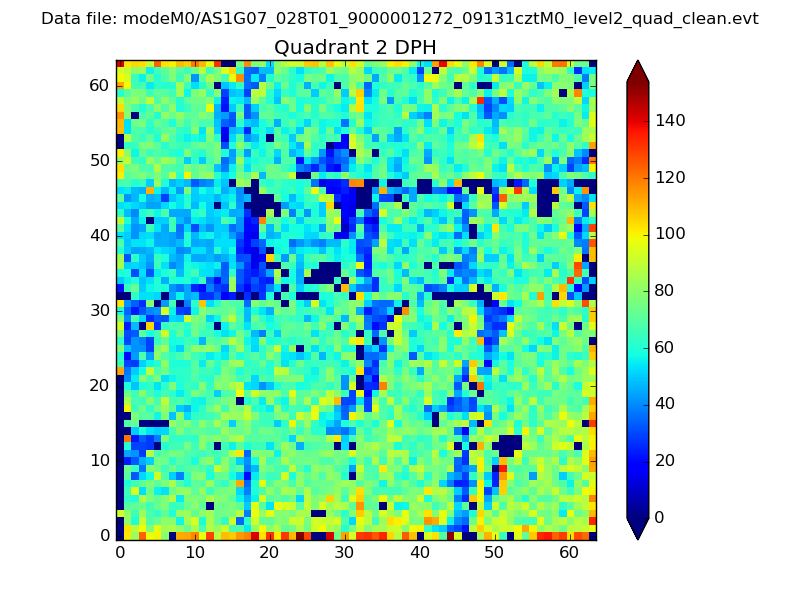 |
Quadrant C |
| Plot type | Count rate plots | Images |
|---|---|---|
| Comparison with Poisson distribution Blue bars denote a histogram of data divided into 1 sec bins. Red curve is a Poisson curve with rate = median count rate of data. |
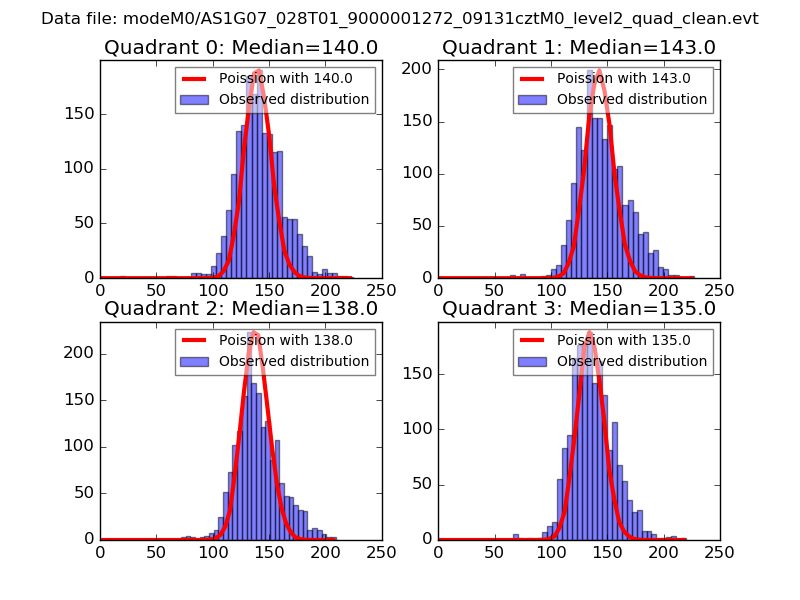 |
 |
| Quadrant-wise count rates Data is divided into 100 sec bins |
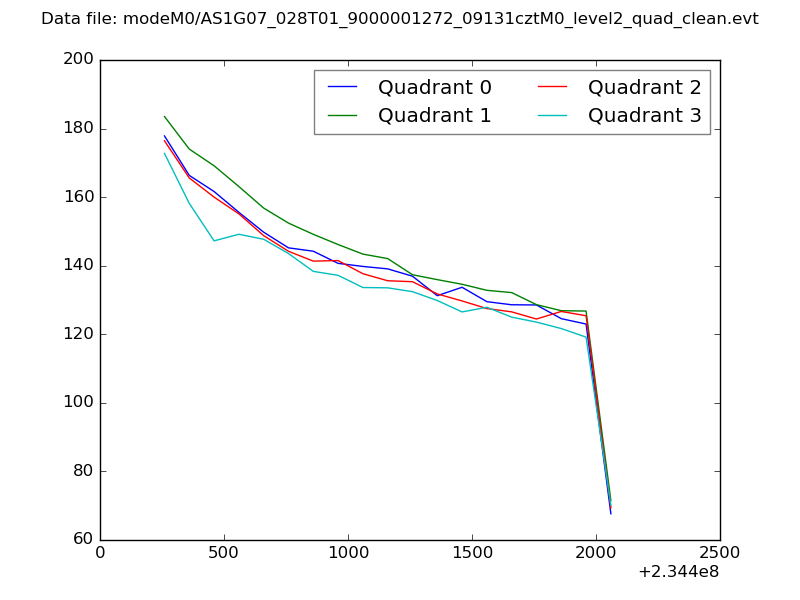 |
|
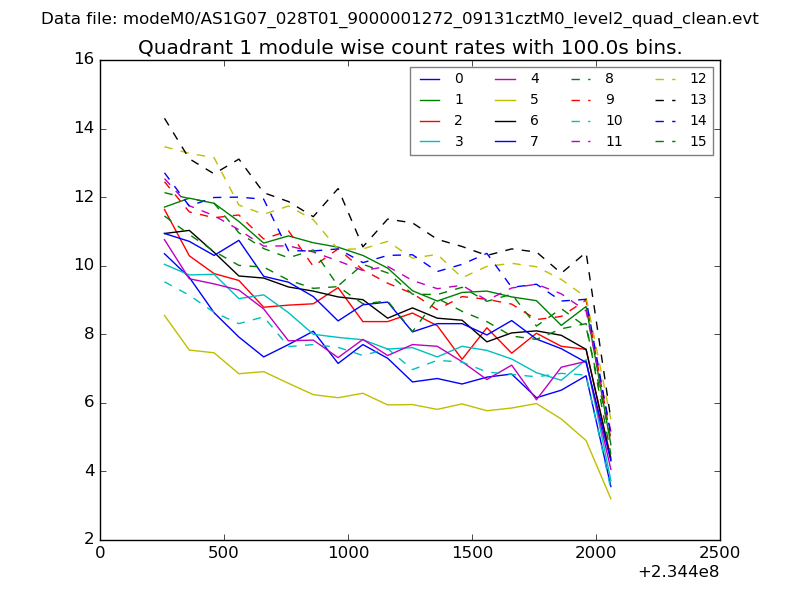
| Module-wise count rates for Quadrant A Data is divided into 100 sec bins |
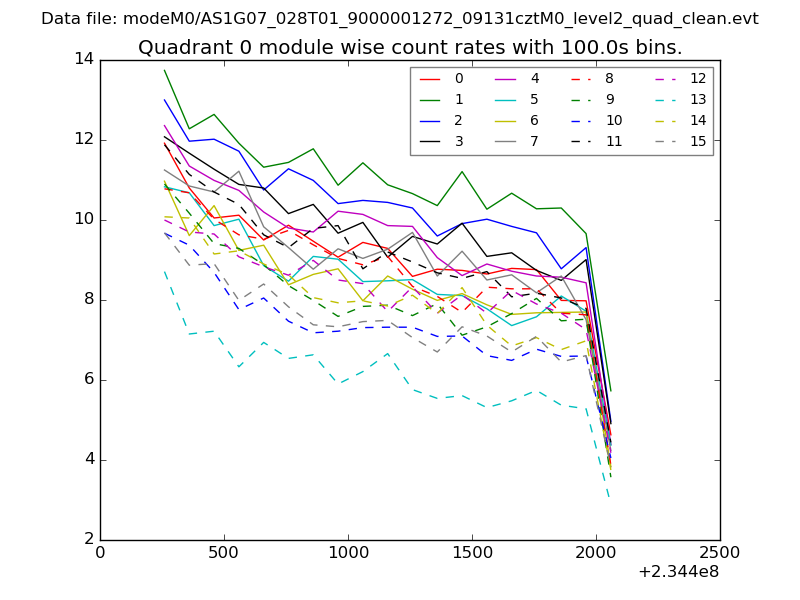 |
 |
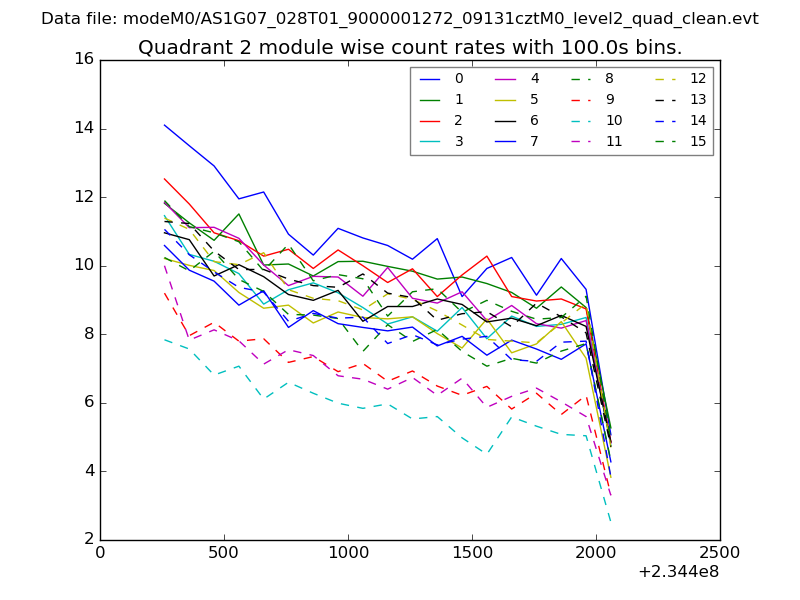
| Module-wise count rates for Quadrant B Data is divided into 100 sec bins |
 |
 |
| Module-wise count rates for Quadrant C Data is divided into 100 sec bins |
 |
 |
| Module-wise count rates for Quadrant D Data is divided into 100 sec bins |
 |
 |
| Parameter | Plot |
|---|---|
| CZT HV Monitor | 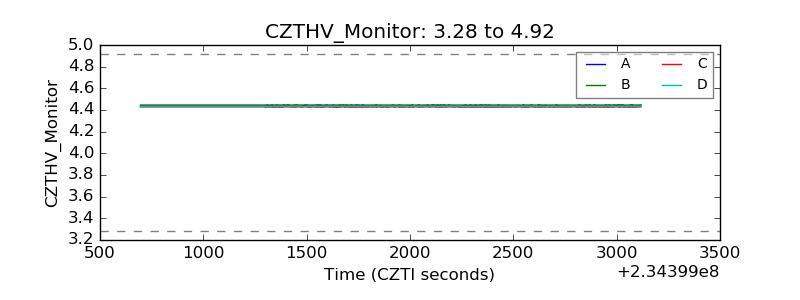 |
| D_VDD | 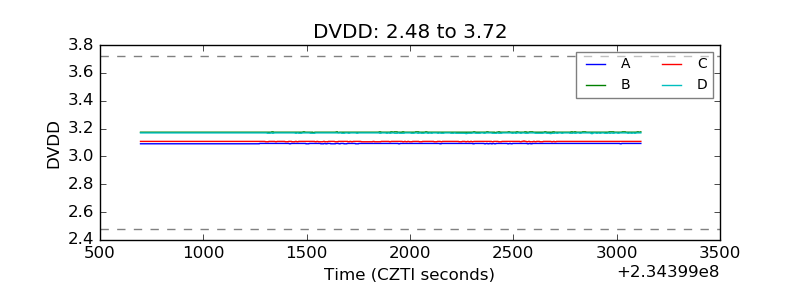 |
| Temperature 1 |  |
| Veto HV Monitor | 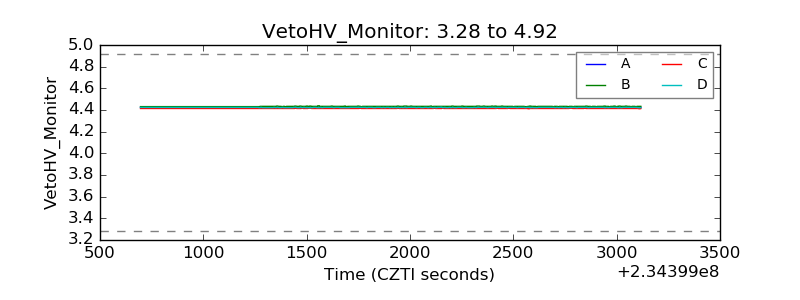 |
| Veto LLD | 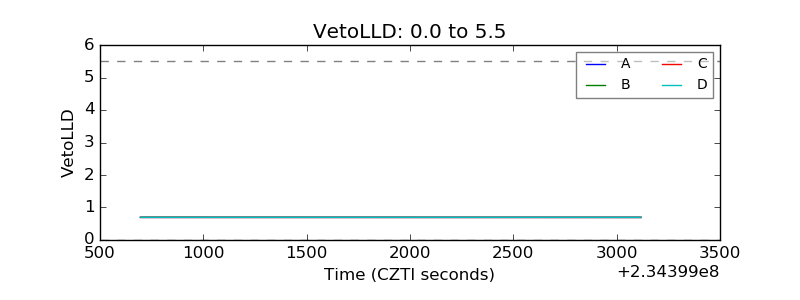 |
| Alpha Counter | 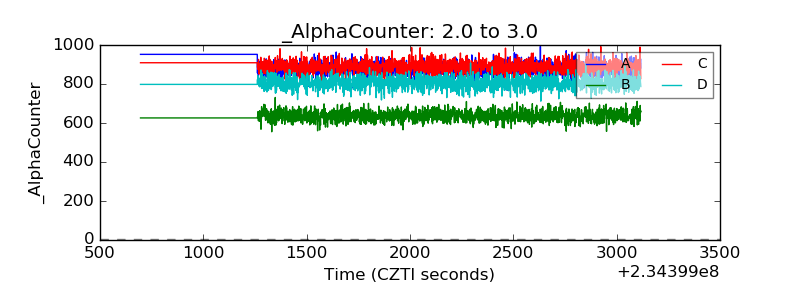 |
| _CPM_Rate | 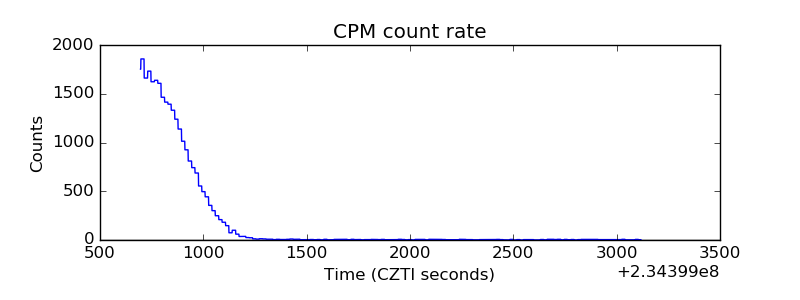 |
| CZT Counter | 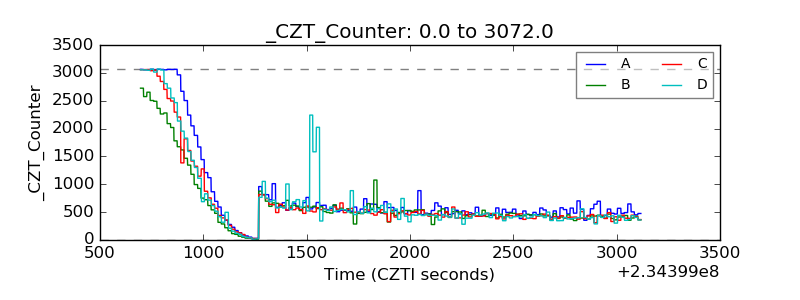 |
| +2.5 Volts monitor |  |
| +5 Volts monitor |  |
| _ROLL_ROT | 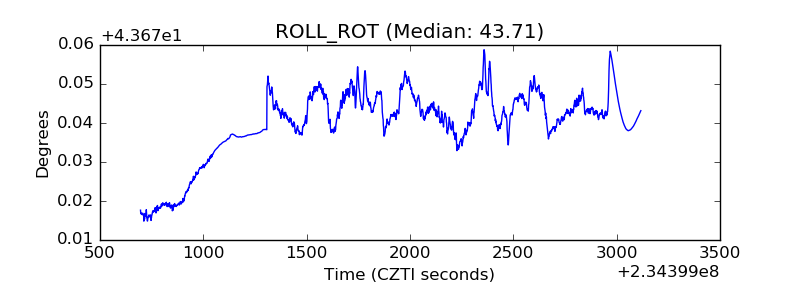 |
| _Roll_DEC | 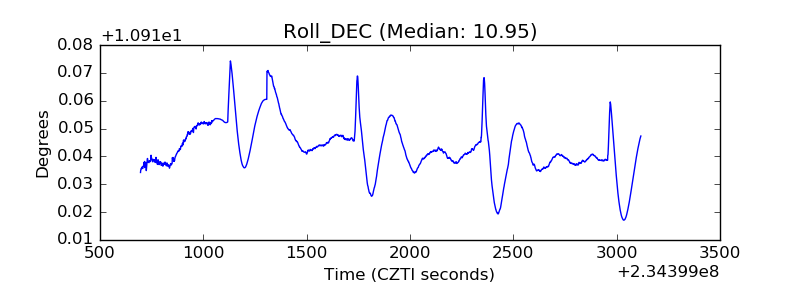 |
| _Roll_RA | 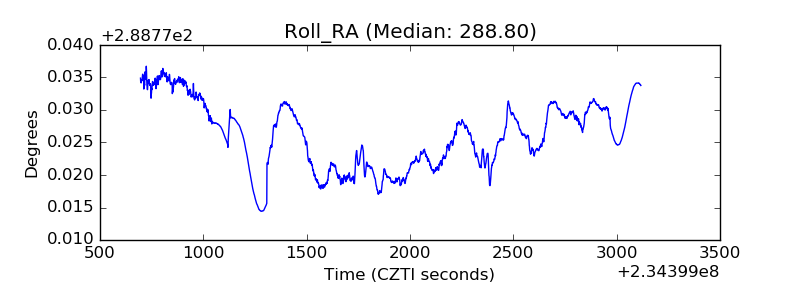 |
| Veto Counter | 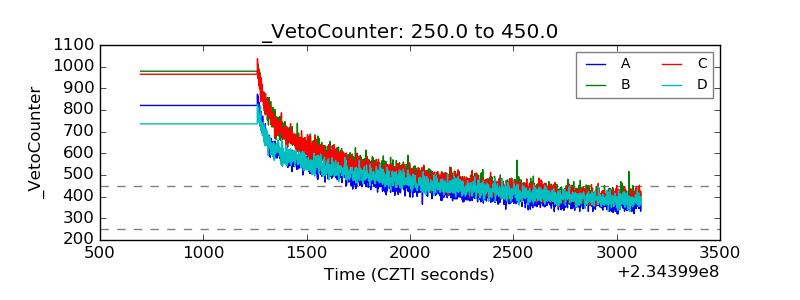 |