| Param | Original file | Final file |
|---|---|---|
| Filename | modeM0/AS1G07_046T01_9000001274cztM0_level2.fits | modeM0/AS1G07_046T01_9000001274cztM0_level2_quad_clean.evt |
| Size (bytes) | 463,106,880 | 359,366,400 |
| Size | 441.7 MB | 342.7 MB |
| Events in quadrant A | 2,795,126 | 1,964,885 |
| Events in quadrant B | 2,736,506 | 1,991,525 |
| Events in quadrant C | 2,757,378 | 1,861,202 |
| Events in quadrant D | 2,425,344 | 1,753,805 |
| Mode M9 | |||
|---|---|---|---|
| Quadrant | BADHDUFLAG | Total packets | Discarded packets |
| A | 0 | 74 | 0 |
| B | 0 | 74 | 0 |
| C | 0 | 74 | 0 |
| D | 0 | 74 | 0 |
| Mode SS | |||
|---|---|---|---|
| Quadrant | BADHDUFLAG | Total packets | Discarded packets |
| A | 0 | 982 | 0 |
| B | 0 | 986 | 0 |
| C | 0 | 986 | 0 |
| D | 0 | 982 | 0 |
| Mode M0 | |||
|---|---|---|---|
| Quadrant | BADHDUFLAG | Total packets | Discarded packets |
| A | 0 | 118181 | 0 |
| B | 0 | 100743 | 0 |
| C | 0 | 100499 | 0 |
| D | 0 | 103544 | 0 |
| Quadrant | Total seconds | Saturated seconds | Saturation percentage |
|---|---|---|---|
| A | 48116 | 1249 | 2.595810% |
| B | 48271 | 933 | 1.932838% |
| C | 48274 | 589 | 1.220118% |
| D | 48270 | 761 | 1.576549% |
Noise dominated data is calculated using 1-second bins in cleaned event files. If a bin has >2000 counts, and if more than 50% of those come from <1% of pixels, then it is considered to be noise-dominated and hence unusable.
| Quadrant | # 1 sec bins | Bins with >0 counts | Bins with >2000 counts | High rate bins dominated by noise | Noise dominated (total time) | Noise dominated (detector-on time) | Marked lightcurve |
|---|---|---|---|---|---|---|---|
| A | 56153 | 48526 | 0 | 0 | 0.00% | 0.00% |  |
| B | 56153 | 48621 | 0 | 0 | 0.00% | 0.00% |  |
| C | 56153 | 48622 | 0 | 0 | 0.00% | 0.00% |  |
| D | 56153 | 48600 | 0 | 0 | 0.00% | 0.00% |  |
Top three noisy pixels from each quadrant. If the there are fewer than three noisy pixels in the level2.evt file, extra rows are filled as -1
| Pixel properties | Quadrant properties | ||||||
|---|---|---|---|---|---|---|---|
| Quadrant | DetID | PixID | Counts | Sigma | Mean | Median | Sigma |
| A | 0 | 29 | 2759 | 11.45 | 727 | 680 | 181.6 |
| A | 7 | 110 | 2391 | 9.42 | 727 | 680 | 181.6 |
| A | 0 | 30 | 2236 | 8.57 | 727 | 680 | 181.6 |
| B | 2 | 9 | 2229 | 10.71 | 720 | 683 | 144.3 |
| B | 3 | 17 | 1860 | 8.16 | 720 | 683 | 144.3 |
| B | 5 | 232 | 1806 | 7.78 | 720 | 683 | 144.3 |
| C | 1 | 80 | 2025 | 7.1 | 727 | 672 | 190.5 |
| C | 1 | 81 | 1963 | 6.78 | 727 | 672 | 190.5 |
| C | 12 | 241 | 1935 | 6.63 | 727 | 672 | 190.5 |
| D | 6 | 231 | 1831 | 6.43 | 691 | 626 | 187.5 |
| D | 1 | 3 | 1747 | 5.98 | 691 | 626 | 187.5 |
| D | 7 | 5 | 1705 | 5.75 | 691 | 626 | 187.5 |
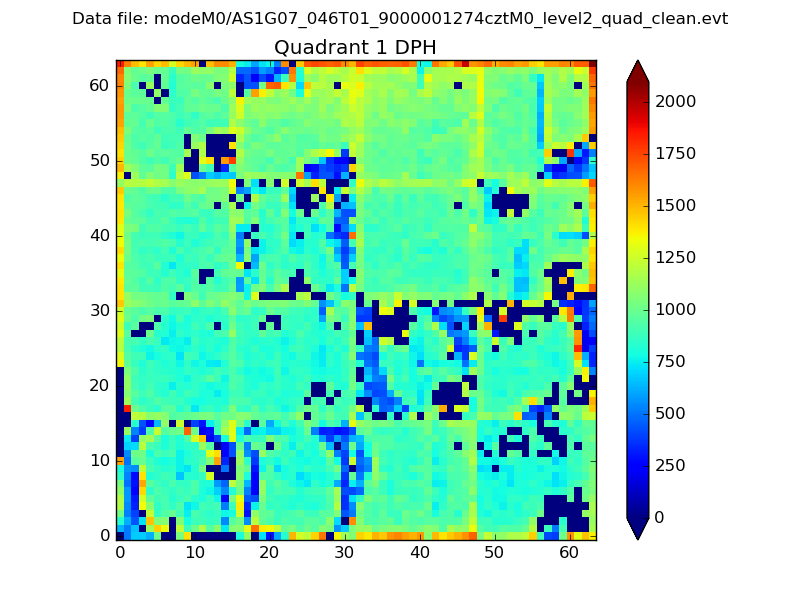
Histogram calculated using DETX and DETY for each event in the final _common_clean file
| Quadrant A |  |
 |
Quadrant B |
|---|---|---|---|
| Quadrant D | 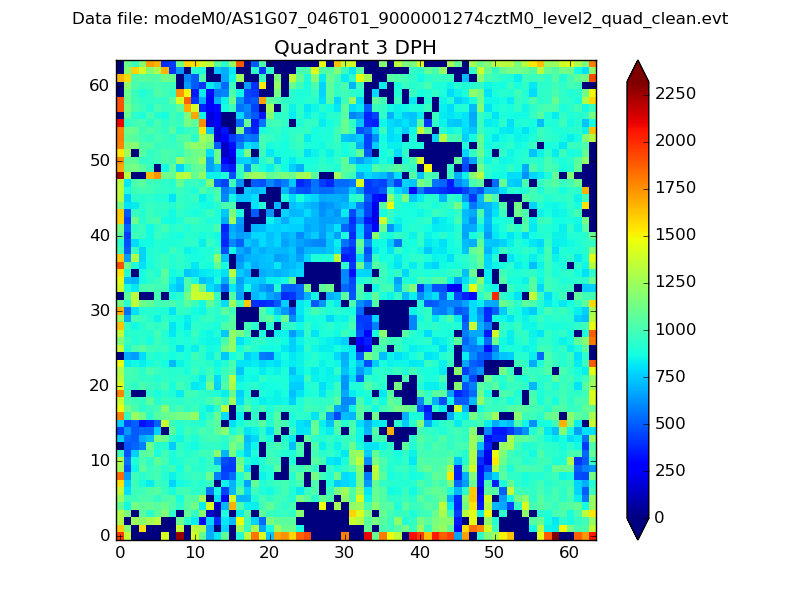 |
 |
Quadrant C |
| Plot type | Count rate plots | Images |
|---|---|---|
| Comparison with Poisson distribution Blue bars denote a histogram of data divided into 1 sec bins. Red curve is a Poisson curve with rate = median count rate of data. |
 |
 |
| Quadrant-wise count rates Data is divided into 100 sec bins |
 |
|
| Module-wise count rates for Quadrant A Data is divided into 100 sec bins |
 |
 |
| Module-wise count rates for Quadrant B Data is divided into 100 sec bins |
 |
 |
| Module-wise count rates for Quadrant C Data is divided into 100 sec bins |
 |
 |
| Module-wise count rates for Quadrant D Data is divided into 100 sec bins |
 |
 |
| Parameter | Plot |
|---|---|
| CZT HV Monitor |  |
| D_VDD |  |
| Temperature 1 |  |
| Veto HV Monitor |  |
| Veto LLD | 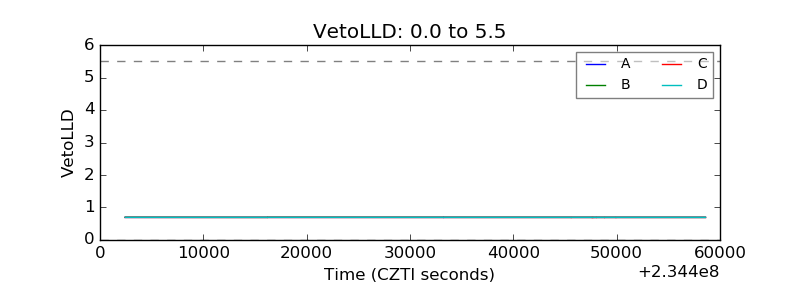 |
| Alpha Counter |  |
| _CPM_Rate |  |
| CZT Counter |  |
| +2.5 Volts monitor |  |
| +5 Volts monitor |  |
| _ROLL_ROT |  |
| _Roll_DEC |  |
| _Roll_RA |  |
| Veto Counter |  |