| Param | Original file | Final file |
|---|---|---|
| Filename | modeM0/AS1G07_046T01_9000001274_09135cztM0_level2.evt | modeM0/AS1G07_046T01_9000001274_09135cztM0_level2_quad_clean.evt |
| Size (bytes) | 421,309,440 | 67,743,360 |
| Size | 401.8 MB | 64.6 MB |
| Events in quadrant A | 3,547,682 | 407,437 |
| Events in quadrant B | 3,027,640 | 415,506 |
| Events in quadrant C | 2,809,768 | 403,419 |
| Events in quadrant D | 2,956,921 | 396,189 |
| Mode M9 | |||
|---|---|---|---|
| Quadrant | BADHDUFLAG | Total packets | Discarded packets |
| A | 0 | 10 | 0 |
| B | 0 | 10 | 0 |
| C | 0 | 10 | 0 |
| D | 0 | 10 | 0 |
| Mode SS | |||
|---|---|---|---|
| Quadrant | BADHDUFLAG | Total packets | Discarded packets |
| A | 0 | 124 | 0 |
| B | 0 | 124 | 0 |
| C | 0 | 124 | 0 |
| D | 0 | 124 | 0 |
| Mode M0 | |||
|---|---|---|---|
| Quadrant | BADHDUFLAG | Total packets | Discarded packets |
| A | 0 | 14251 | 2 |
| B | 0 | 12711 | 1 |
| C | 0 | 12542 | 1 |
| D | 0 | 12908 | 1 |
| Quadrant | Total seconds | Saturated seconds | Saturation percentage |
|---|---|---|---|
| A | 6141 | 108 | 1.758671% |
| B | 6141 | 88 | 1.432991% |
| C | 6141 | 42 | 0.683928% |
| D | 6141 | 54 | 0.879336% |
Noise dominated data is calculated using 1-second bins in cleaned event files. If a bin has >2000 counts, and if more than 50% of those come from <1% of pixels, then it is considered to be noise-dominated and hence unusable.
| Quadrant | # 1 sec bins | Bins with >0 counts | Bins with >2000 counts | High rate bins dominated by noise | Noise dominated (total time) | Noise dominated (detector-on time) | Marked lightcurve |
|---|---|---|---|---|---|---|---|
| A | 7121 | 6141 | 34 | 34 | 0.48% | 0.55% | 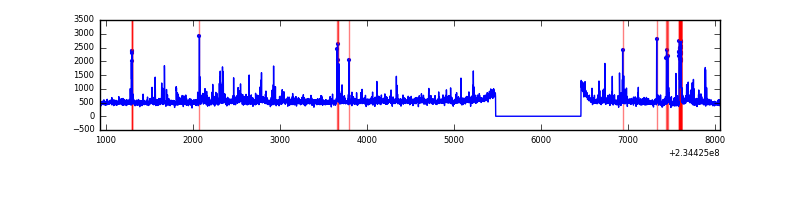 |
| B | 7121 | 6141 | 0 | 0 | 0.00% | 0.00% | 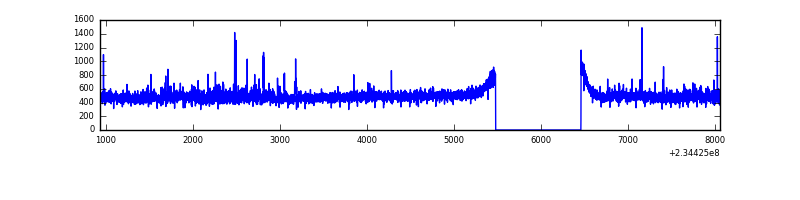 |
| C | 7121 | 6142 | 1 | 1 | 0.01% | 0.02% | 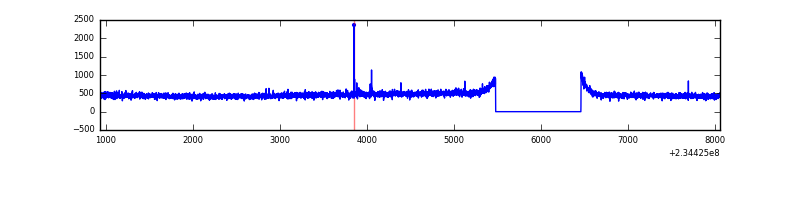 |
| D | 7121 | 6141 | 7 | 7 | 0.10% | 0.11% | 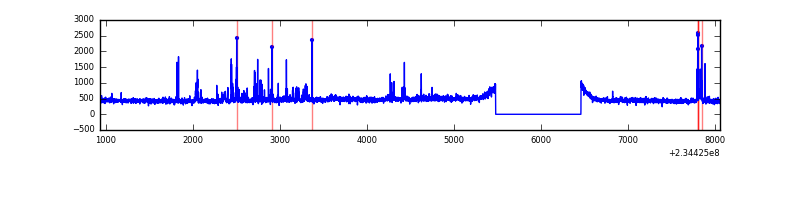 |
Top three noisy pixels from each quadrant. If the there are fewer than three noisy pixels in the level2.evt file, extra rows are filled as -1
| Pixel properties | Quadrant properties | ||||||
|---|---|---|---|---|---|---|---|
| Quadrant | DetID | PixID | Counts | Sigma | Mean | Median | Sigma |
| A | 8 | 5 | 387363 | 2528.7 | 750 | 736 | 152.9 |
| A | 15 | 223 | 101227 | 657.25 | 750 | 736 | 152.9 |
| A | 1 | 162 | 71158 | 460.59 | 750 | 736 | 152.9 |
| B | 0 | 214 | 115081 | 789.12 | 749 | 731 | 144.9 |
| B | 12 | 111 | 16334 | 107.68 | 749 | 731 | 144.9 |
| B | 11 | 111 | 13223 | 86.21 | 749 | 731 | 144.9 |
| C | 14 | 234 | 7521 | 40.74 | 717 | 721 | 166.9 |
| C | 13 | 61 | 5468 | 28.44 | 717 | 721 | 166.9 |
| C | 14 | 67 | 4243 | 21.1 | 717 | 721 | 166.9 |
| D | 1 | 52 | 81043 | 449.92 | 723 | 703 | 178.6 |
| D | 2 | 14 | 43264 | 238.35 | 723 | 703 | 178.6 |
| D | 8 | 195 | 42087 | 231.76 | 723 | 703 | 178.6 |
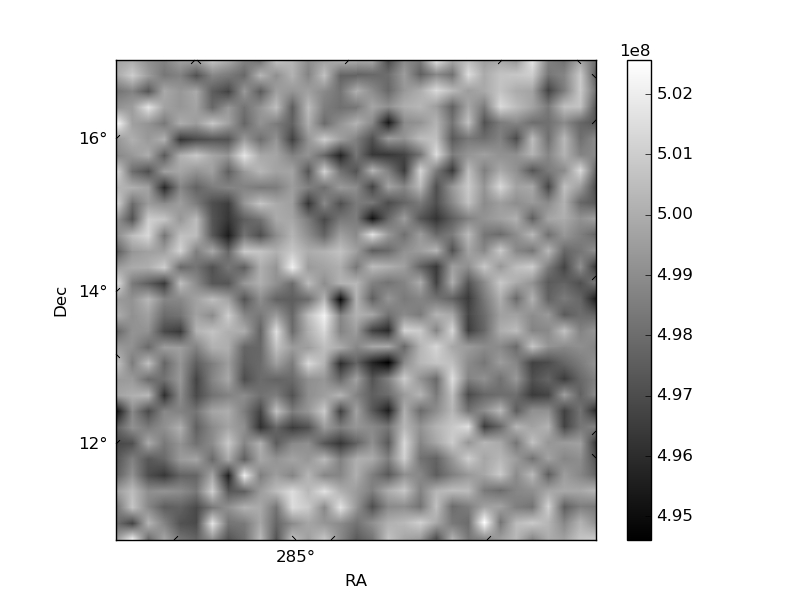
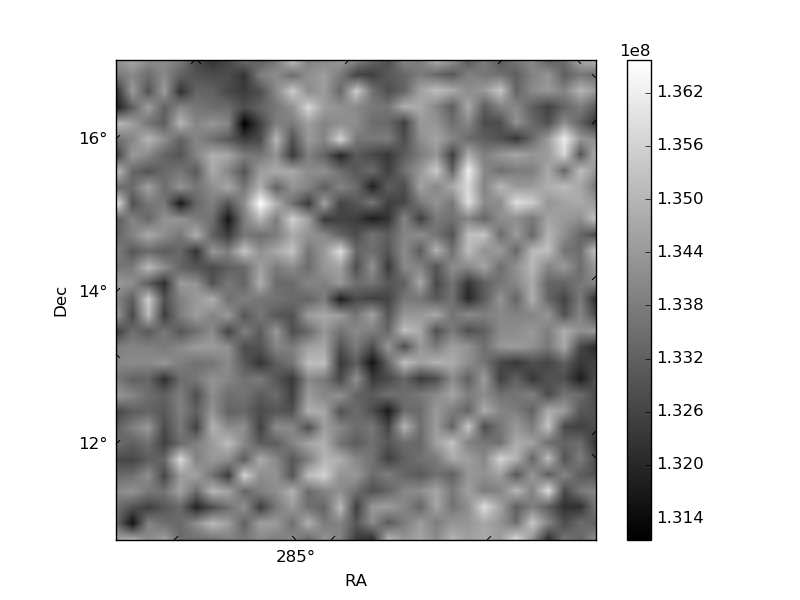
Histogram calculated using DETX and DETY for each event in the final _common_clean file
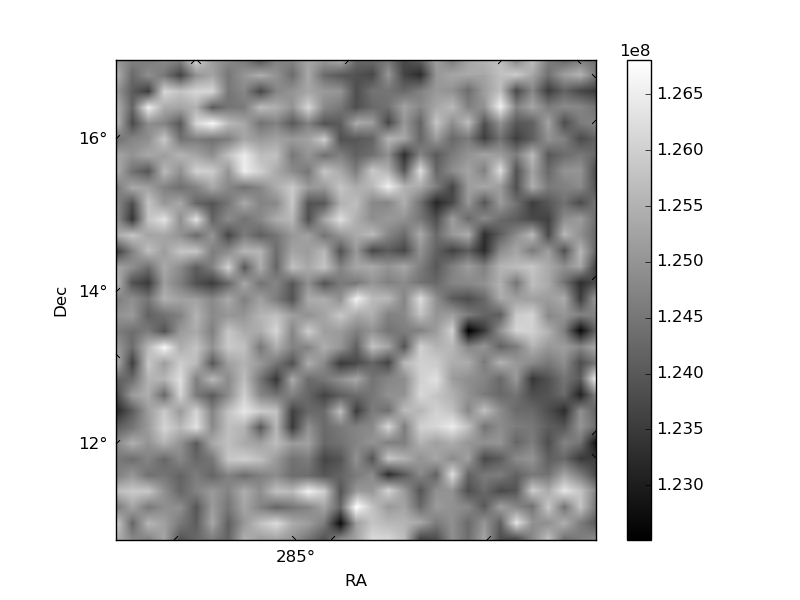
| Quadrant A | 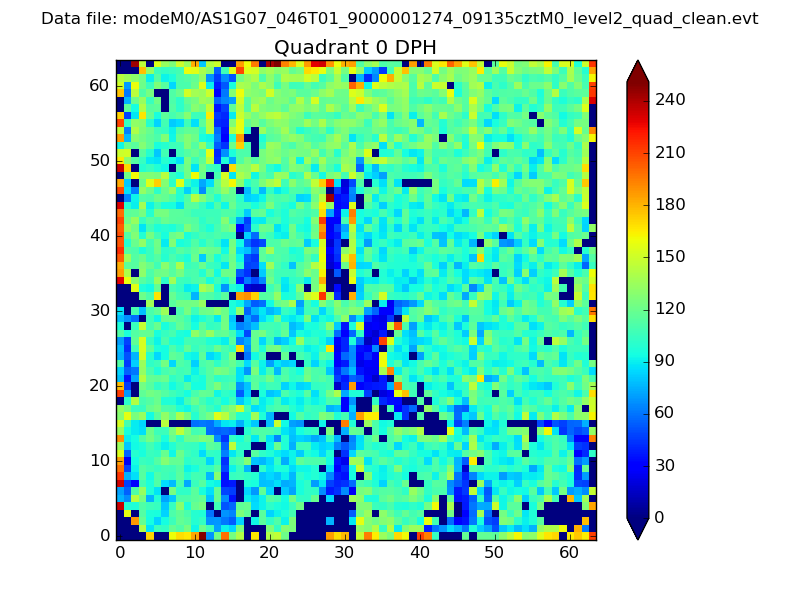 |
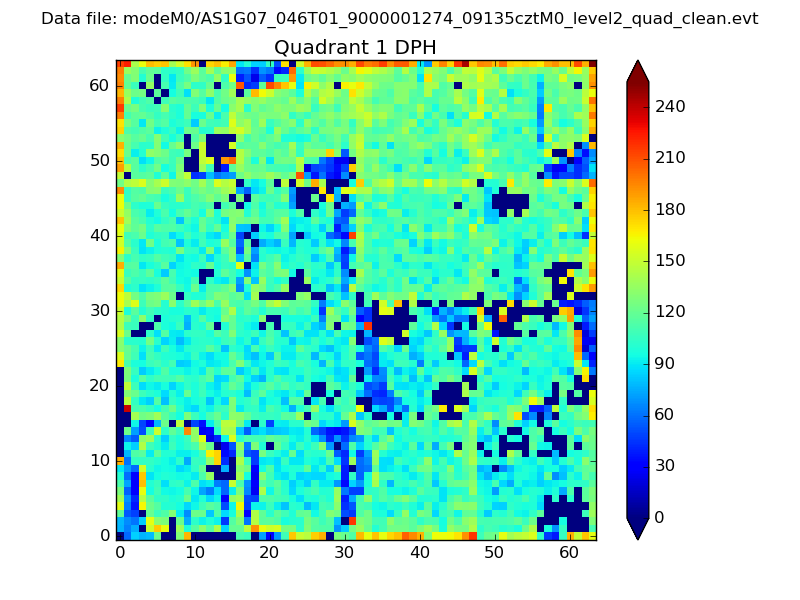 |
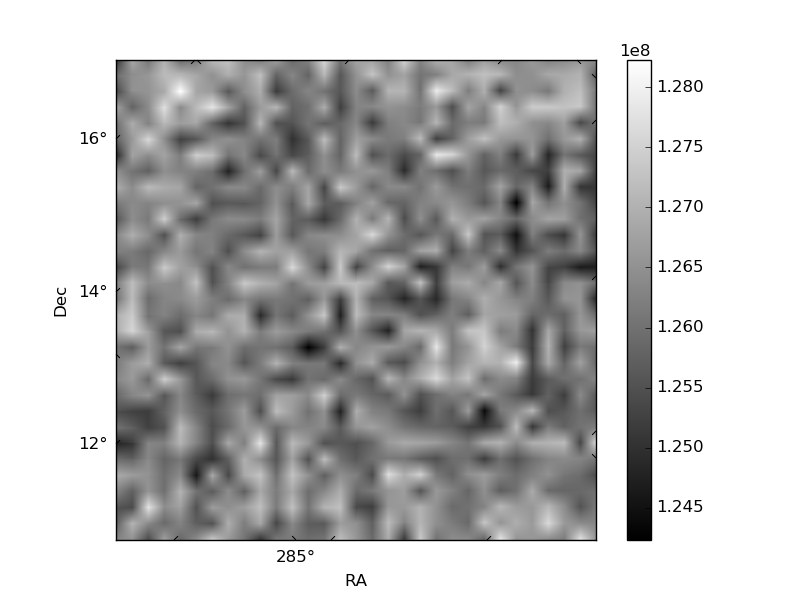
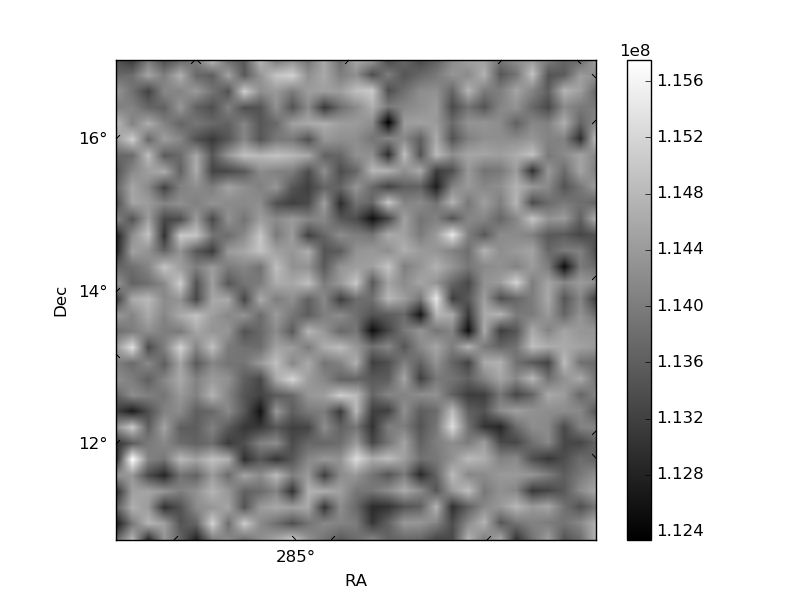
Quadrant B |
|---|---|---|---|
| Quadrant D | 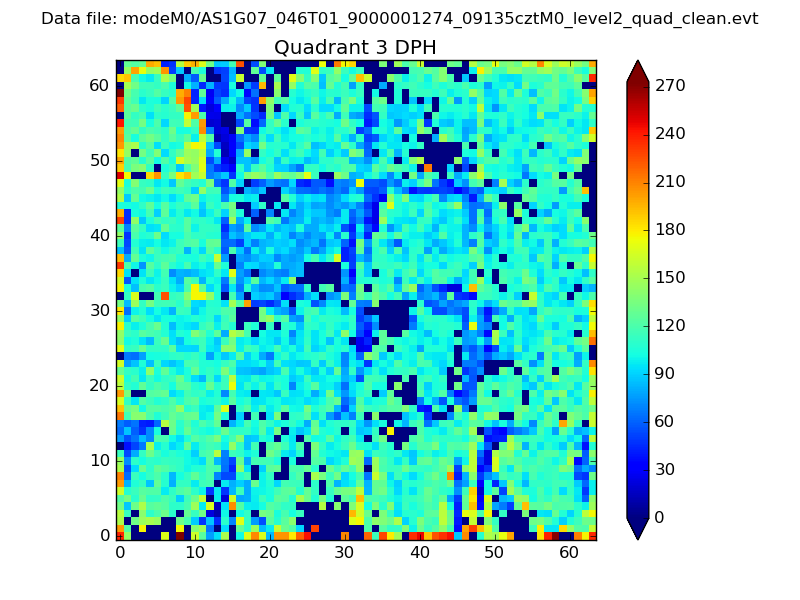 |
 |
Quadrant C |
| Plot type | Count rate plots | Images |
|---|---|---|
| Comparison with Poisson distribution Blue bars denote a histogram of data divided into 1 sec bins. Red curve is a Poisson curve with rate = median count rate of data. |
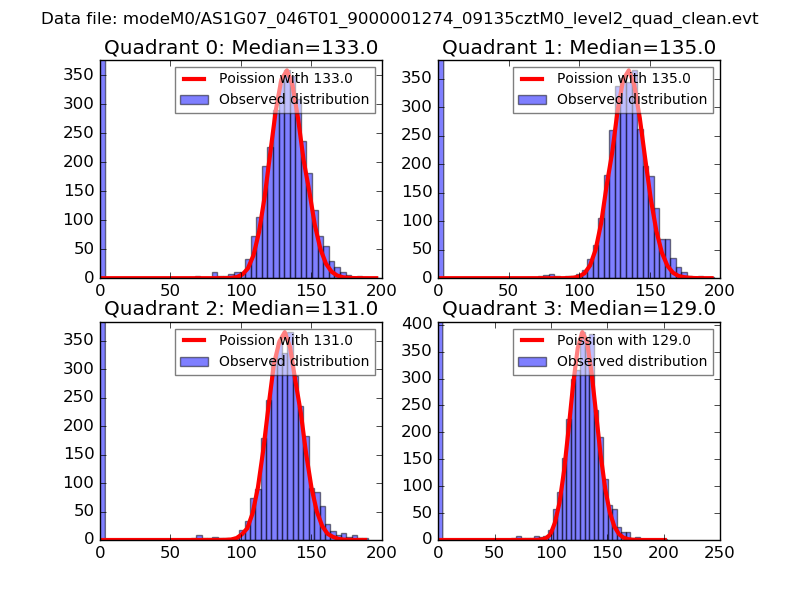 |
 |
| Quadrant-wise count rates Data is divided into 100 sec bins |
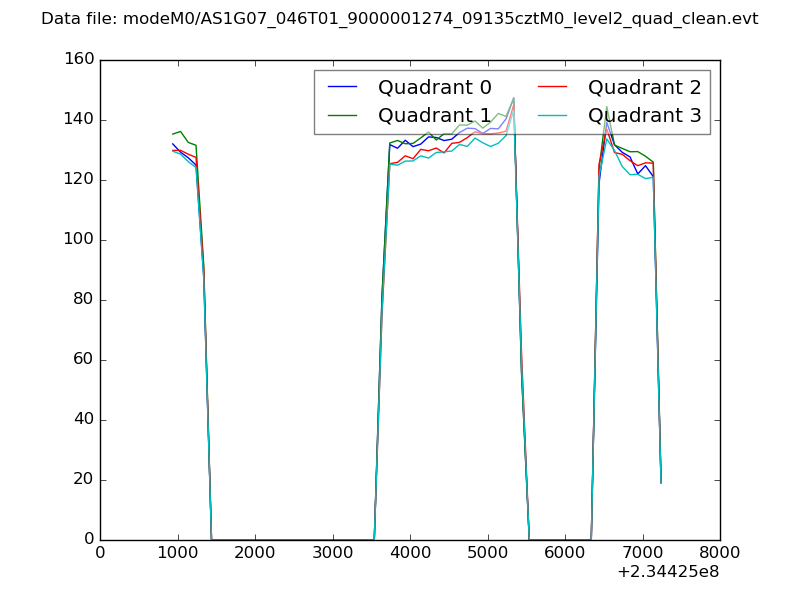 |
|
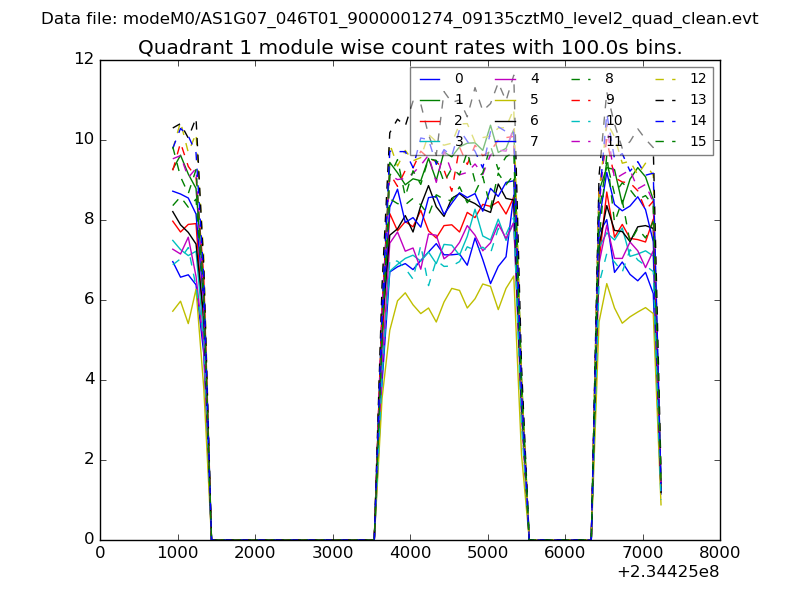
| Module-wise count rates for Quadrant A Data is divided into 100 sec bins |
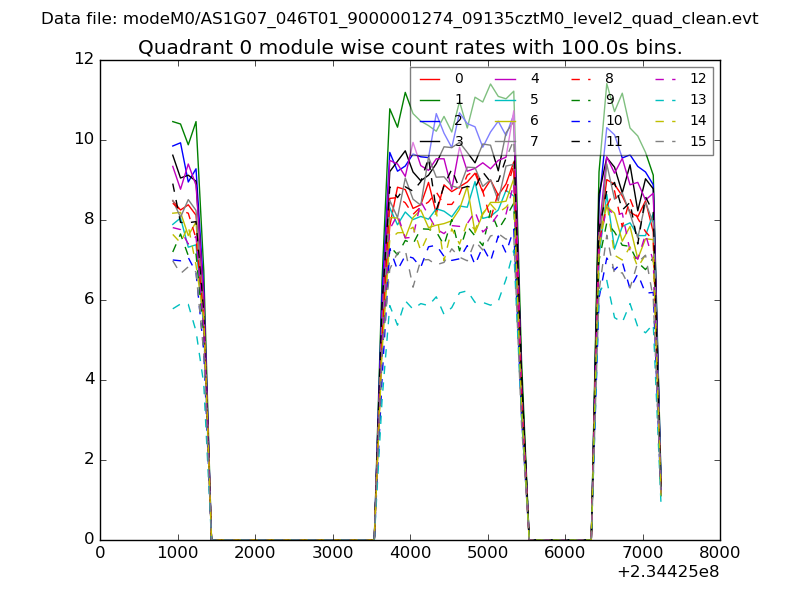 |
 |
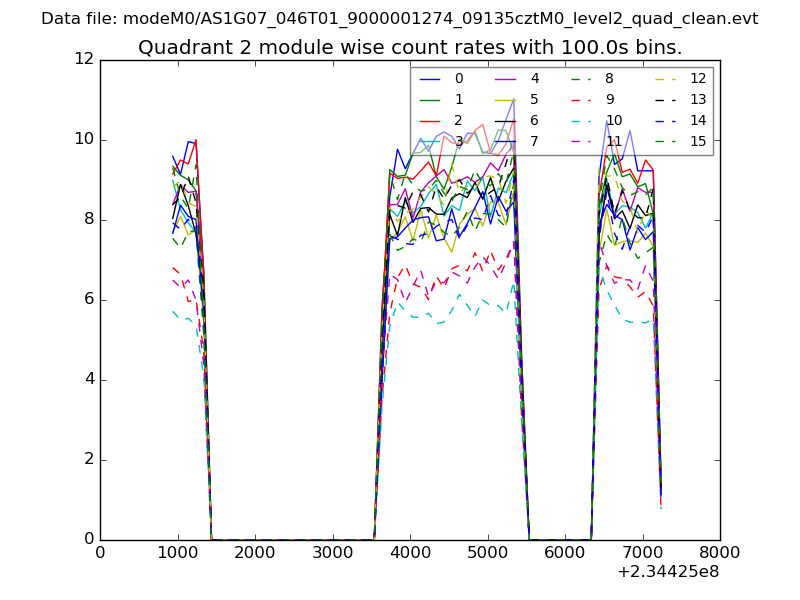
| Module-wise count rates for Quadrant B Data is divided into 100 sec bins |
 |
 |
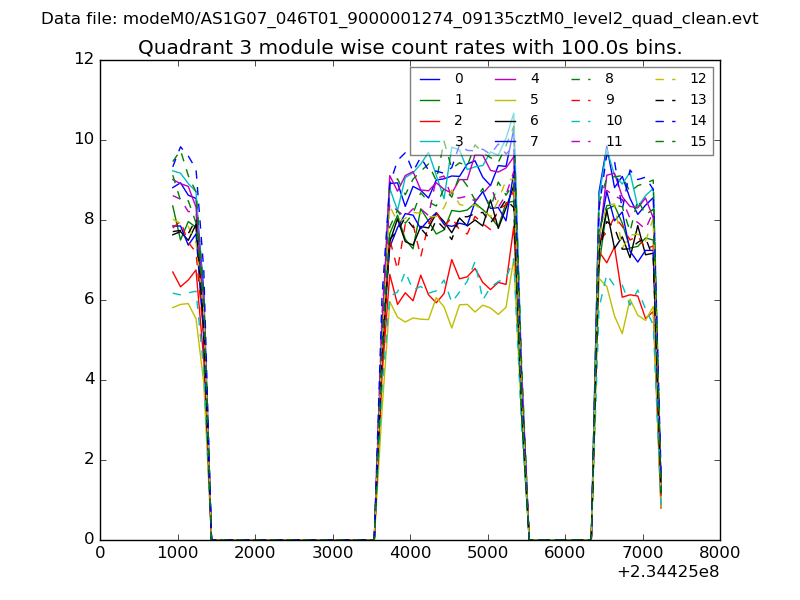
| Module-wise count rates for Quadrant C Data is divided into 100 sec bins |
 |
 |
| Module-wise count rates for Quadrant D Data is divided into 100 sec bins |
 |
 |
| Parameter | Plot |
|---|---|
| CZT HV Monitor | 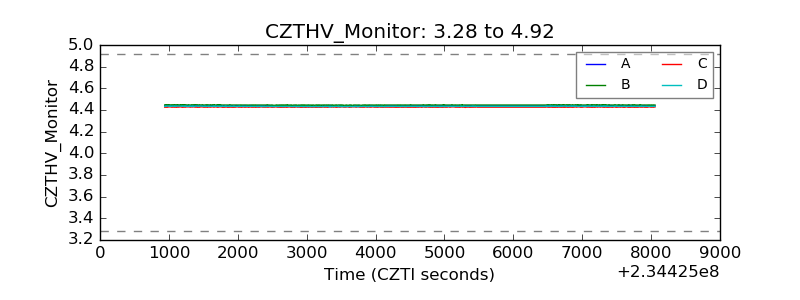 |
| D_VDD | 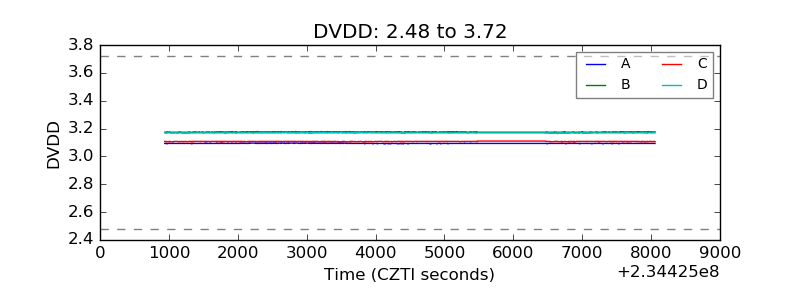 |
| Temperature 1 | 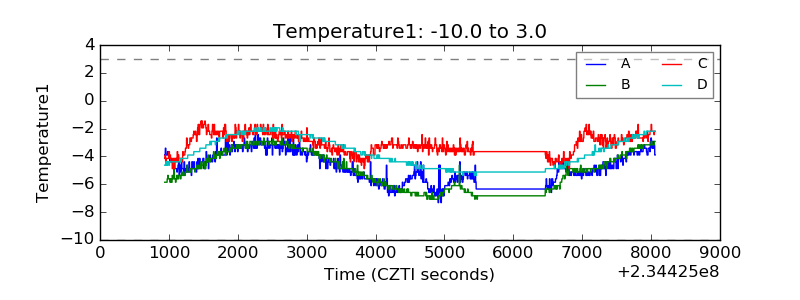 |
| Veto HV Monitor | 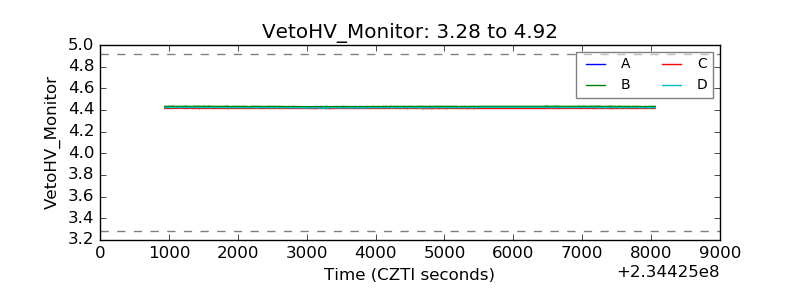 |
| Veto LLD | 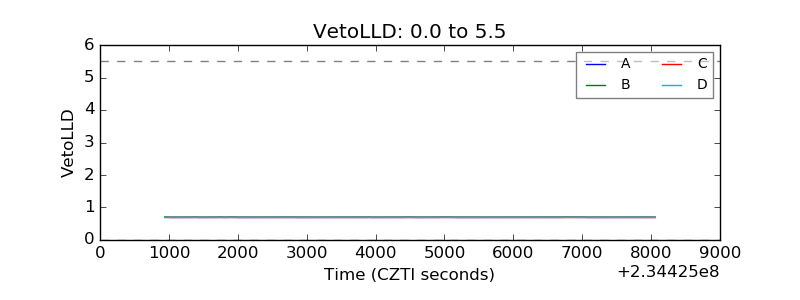 |
| Alpha Counter | 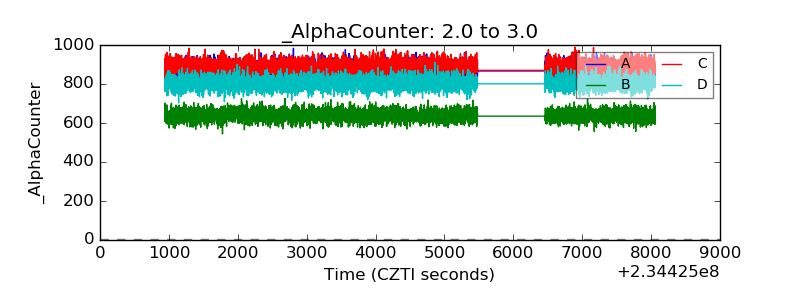 |
| _CPM_Rate | 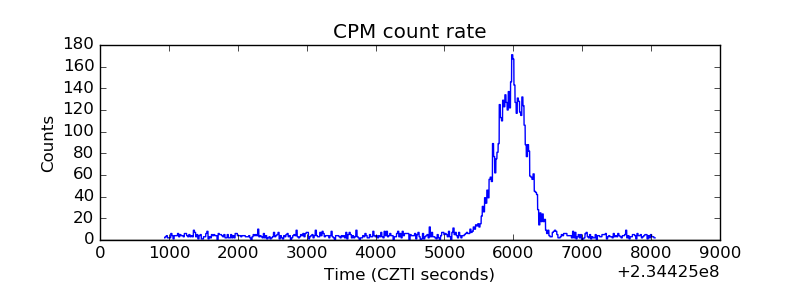 |
| CZT Counter | 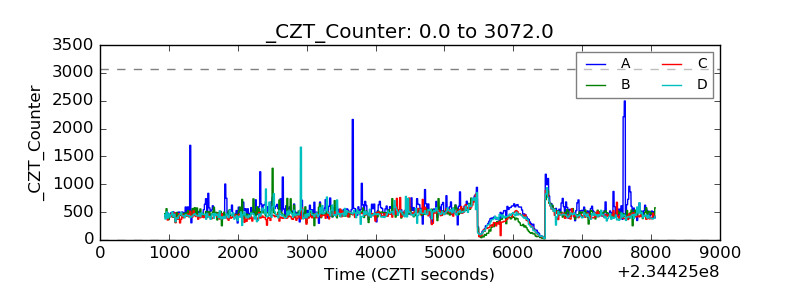 |
| +2.5 Volts monitor |  |
| +5 Volts monitor |  |
| _ROLL_ROT | 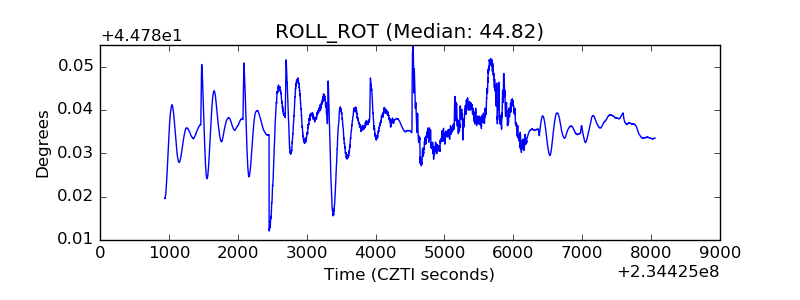 |
| _Roll_DEC | 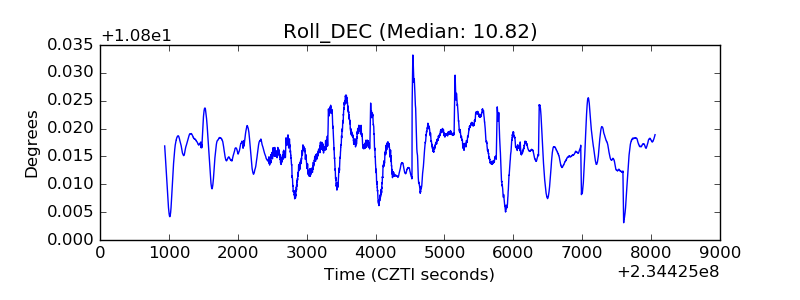 |
| _Roll_RA | 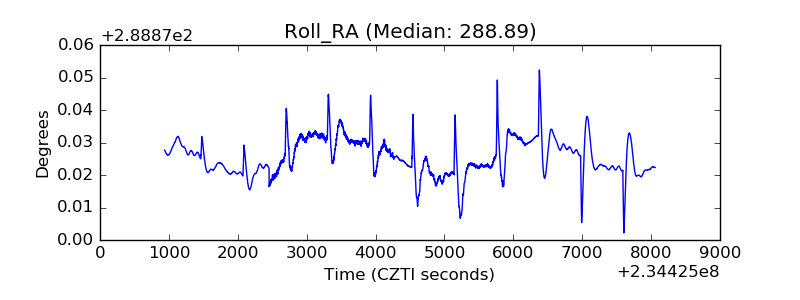 |
| Veto Counter | 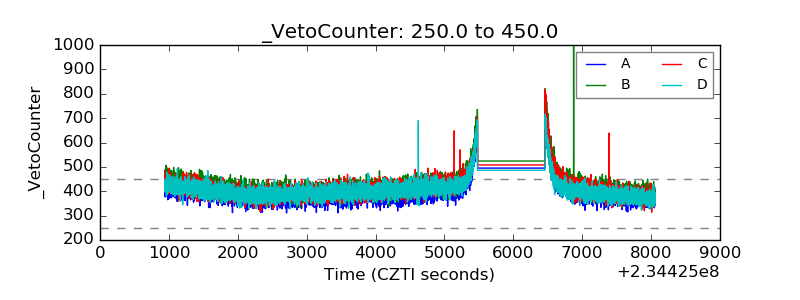 |