| Param | Original file | Final file |
|---|---|---|
| Filename | modeM0/AS1G07_046T01_9000001274_09136cztM0_level2.evt | modeM0/AS1G07_046T01_9000001274_09136cztM0_level2_quad_clean.evt |
| Size (bytes) | 501,071,040 | 82,065,600 |
| Size | 477.9 MB | 78.3 MB |
| Events in quadrant A | 4,430,328 | 494,635 |
| Events in quadrant B | 3,530,184 | 507,660 |
| Events in quadrant C | 3,317,757 | 496,438 |
| Events in quadrant D | 3,408,713 | 486,162 |
| Mode M9 | |||
|---|---|---|---|
| Quadrant | BADHDUFLAG | Total packets | Discarded packets |
| A | 0 | 6 | 0 |
| B | 0 | 6 | 0 |
| C | 0 | 6 | 0 |
| D | 0 | 7 | 0 |
| Mode SS | |||
|---|---|---|---|
| Quadrant | BADHDUFLAG | Total packets | Discarded packets |
| A | 0 | 146 | 0 |
| B | 0 | 146 | 0 |
| C | 0 | 146 | 0 |
| D | 0 | 146 | 0 |
| Mode M0 | |||
|---|---|---|---|
| Quadrant | BADHDUFLAG | Total packets | Discarded packets |
| A | 0 | 17524 | 3 |
| B | 0 | 14979 | 2 |
| C | 0 | 14881 | 2 |
| D | 0 | 15232 | 2 |
| Quadrant | Total seconds | Saturated seconds | Saturation percentage |
|---|---|---|---|
| A | 7177 | 296 | 4.124286% |
| B | 7177 | 185 | 2.577679% |
| C | 7177 | 128 | 1.783475% |
| D | 7177 | 152 | 2.117877% |
Noise dominated data is calculated using 1-second bins in cleaned event files. If a bin has >2000 counts, and if more than 50% of those come from <1% of pixels, then it is considered to be noise-dominated and hence unusable.
| Quadrant | # 1 sec bins | Bins with >0 counts | Bins with >2000 counts | High rate bins dominated by noise | Noise dominated (total time) | Noise dominated (detector-on time) | Marked lightcurve |
|---|---|---|---|---|---|---|---|
| A | 7682 | 7177 | 92 | 92 | 1.20% | 1.28% | 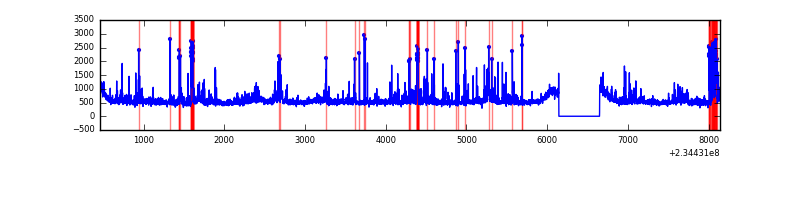 |
| B | 7682 | 7177 | 1 | 1 | 0.01% | 0.01% | 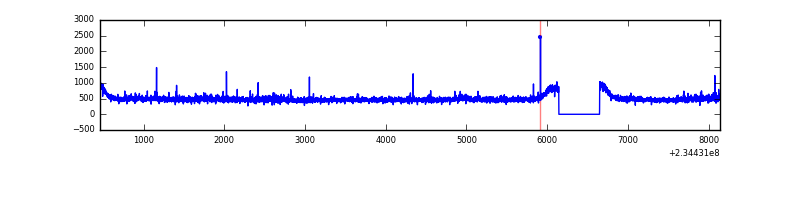 |
| C | 7682 | 7177 | 0 | 0 | 0.00% | 0.00% | 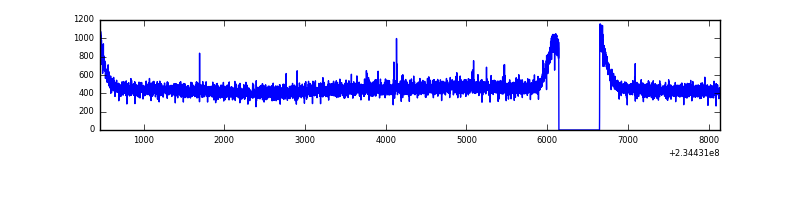 |
| D | 7682 | 7177 | 9 | 9 | 0.12% | 0.13% | 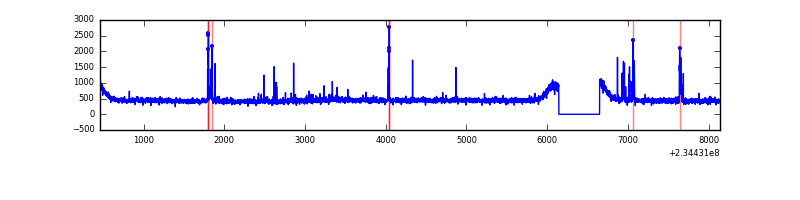 |
Top three noisy pixels from each quadrant. If the there are fewer than three noisy pixels in the level2.evt file, extra rows are filled as -1
| Pixel properties | Quadrant properties | ||||||
|---|---|---|---|---|---|---|---|
| Quadrant | DetID | PixID | Counts | Sigma | Mean | Median | Sigma |
| A | 8 | 5 | 487134 | 2713.53 | 876 | 855 | 179.2 |
| A | 15 | 223 | 250400 | 1392.51 | 876 | 855 | 179.2 |
| A | 15 | 236 | 96676 | 534.7 | 876 | 855 | 179.2 |
| B | 0 | 214 | 102322 | 587.1 | 880 | 860 | 172.8 |
| B | 12 | 111 | 19772 | 109.43 | 880 | 860 | 172.8 |
| B | 11 | 111 | 15977 | 87.47 | 880 | 860 | 172.8 |
| C | 13 | 61 | 6408 | 27.88 | 848 | 850 | 199.4 |
| C | 14 | 234 | 6331 | 27.49 | 848 | 850 | 199.4 |
| C | 8 | 222 | 2629 | 8.92 | 848 | 850 | 199.4 |
| D | 2 | 14 | 78132 | 370.63 | 855 | 832 | 208.6 |
| D | 1 | 52 | 55379 | 261.53 | 855 | 832 | 208.6 |
| D | 2 | 234 | 26456 | 122.86 | 855 | 832 | 208.6 |
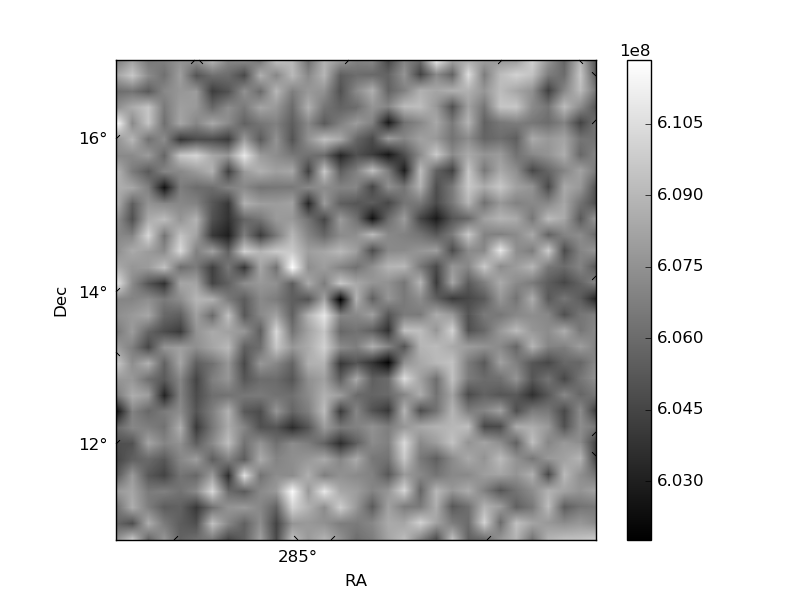
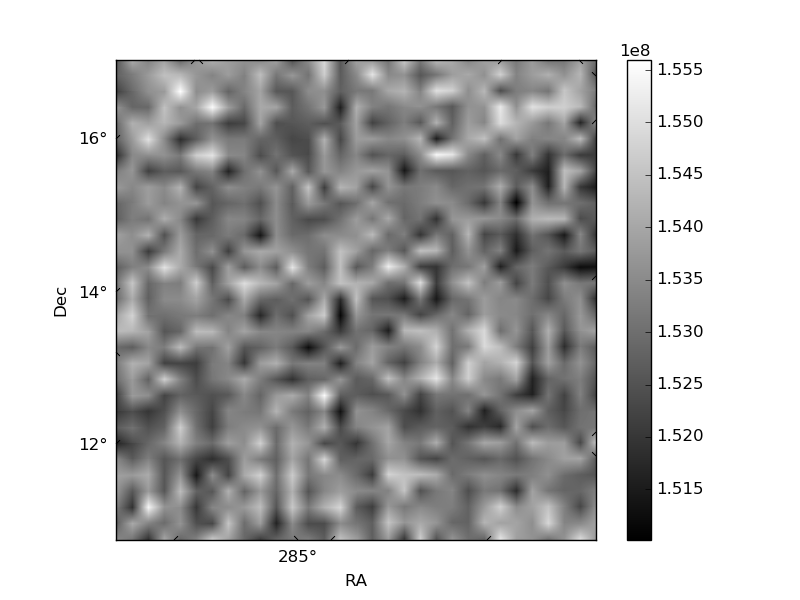
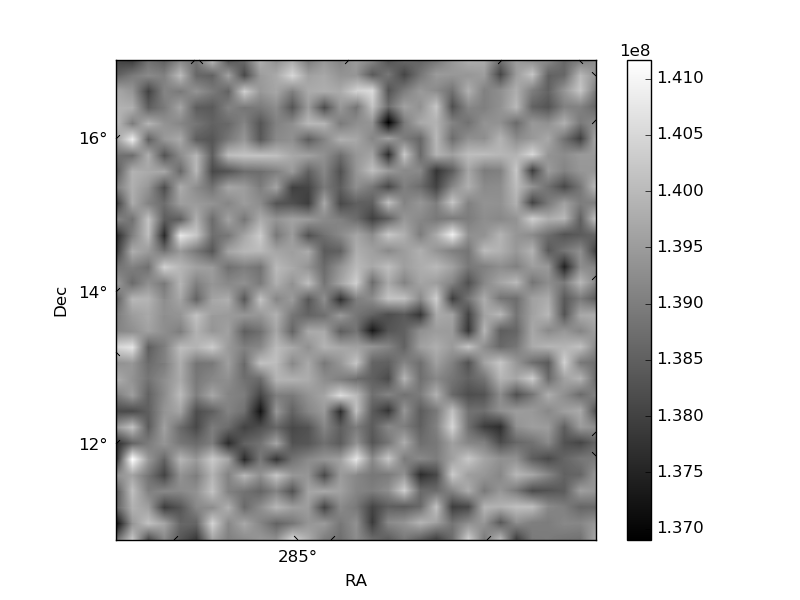
Histogram calculated using DETX and DETY for each event in the final _common_clean file
| Quadrant A | 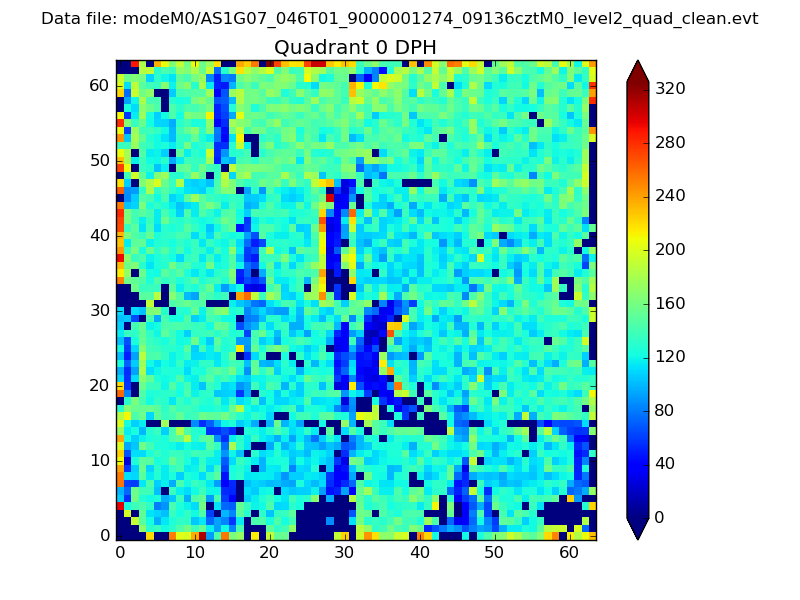 |
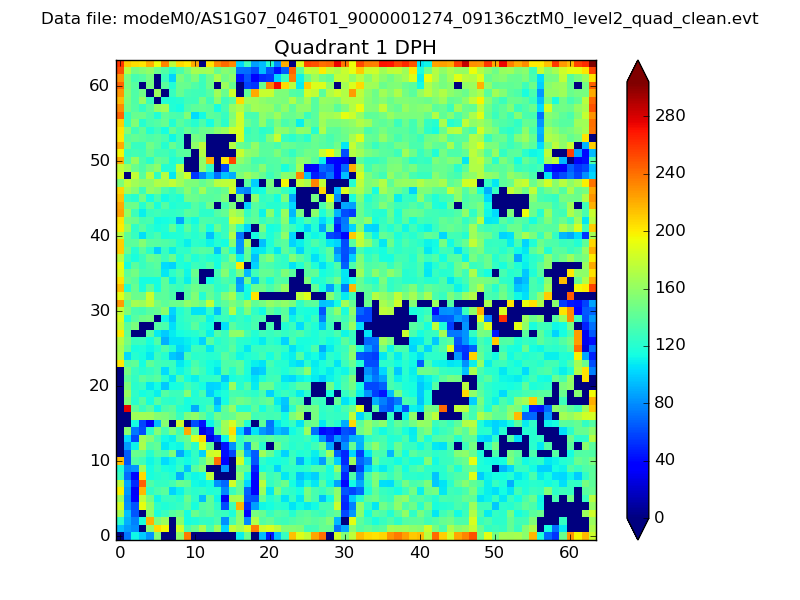 |
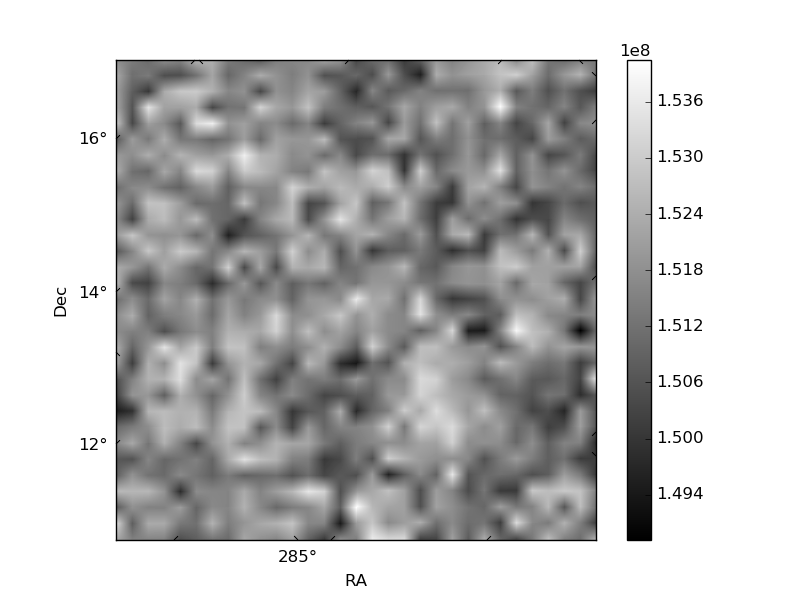
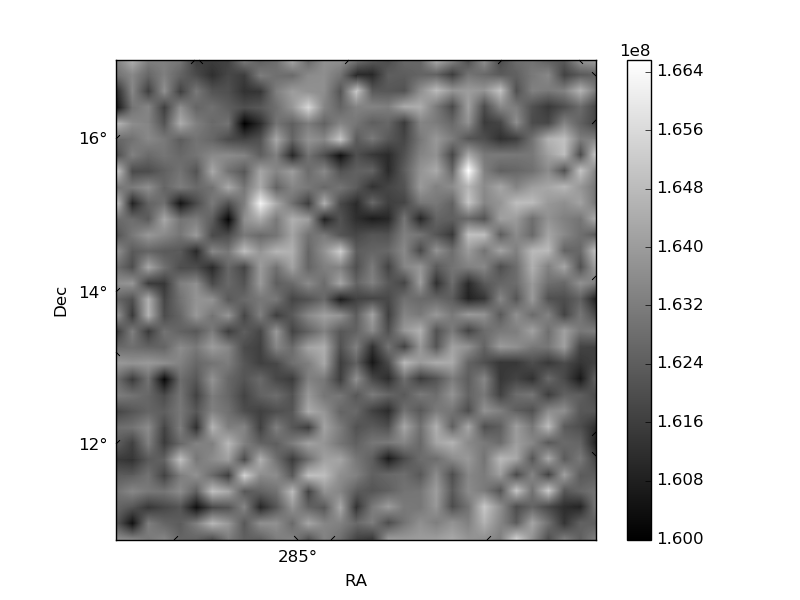
Quadrant B |
|---|---|---|---|
| Quadrant D | 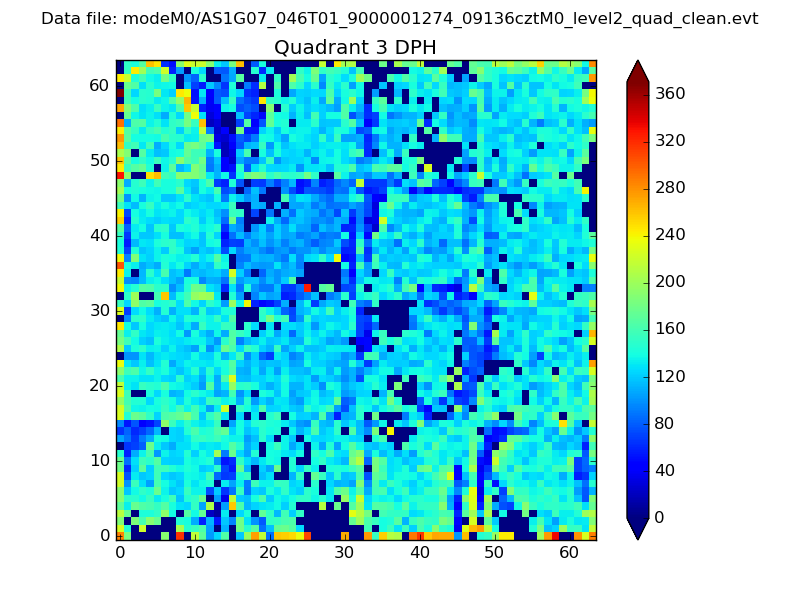 |
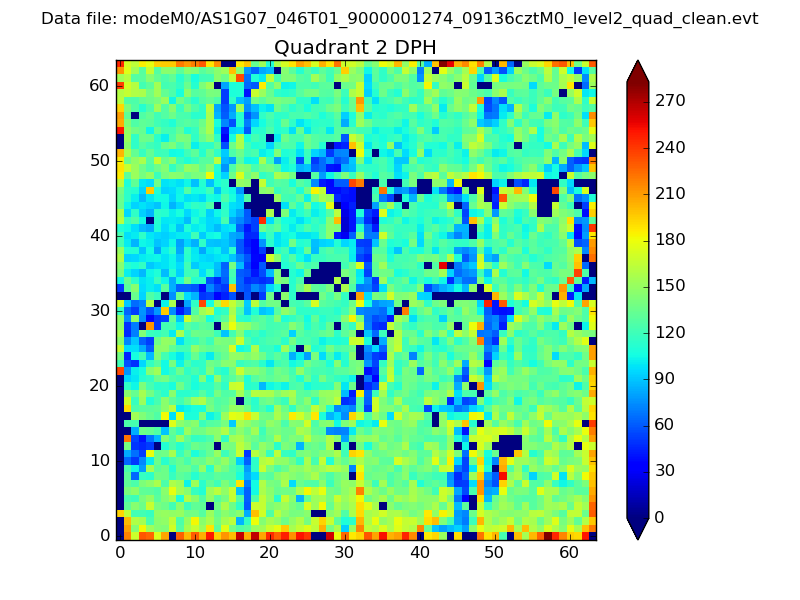 |
Quadrant C |
| Plot type | Count rate plots | Images |
|---|---|---|
| Comparison with Poisson distribution Blue bars denote a histogram of data divided into 1 sec bins. Red curve is a Poisson curve with rate = median count rate of data. |
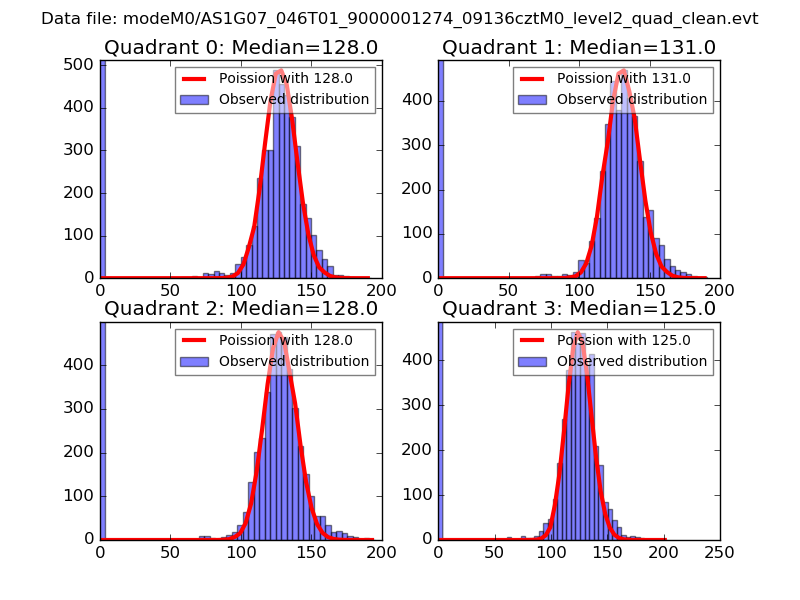 |
 |
| Quadrant-wise count rates Data is divided into 100 sec bins |
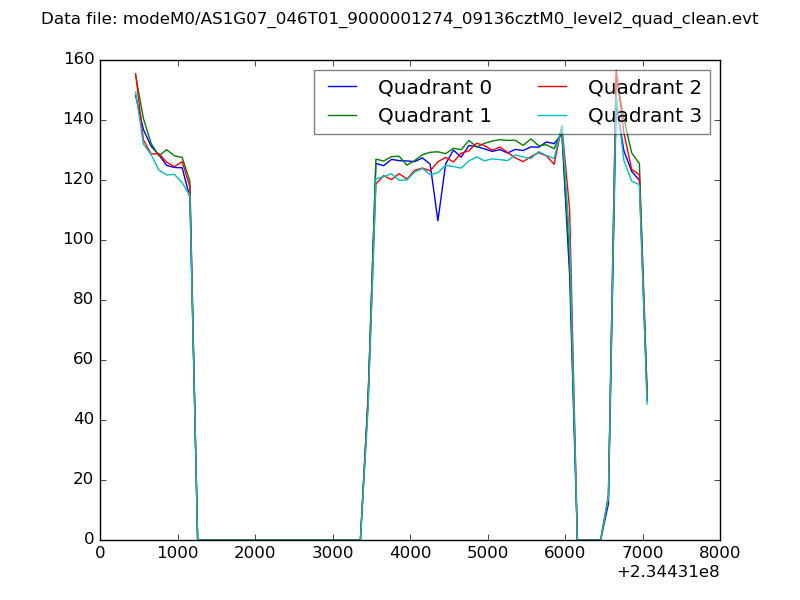 |
|
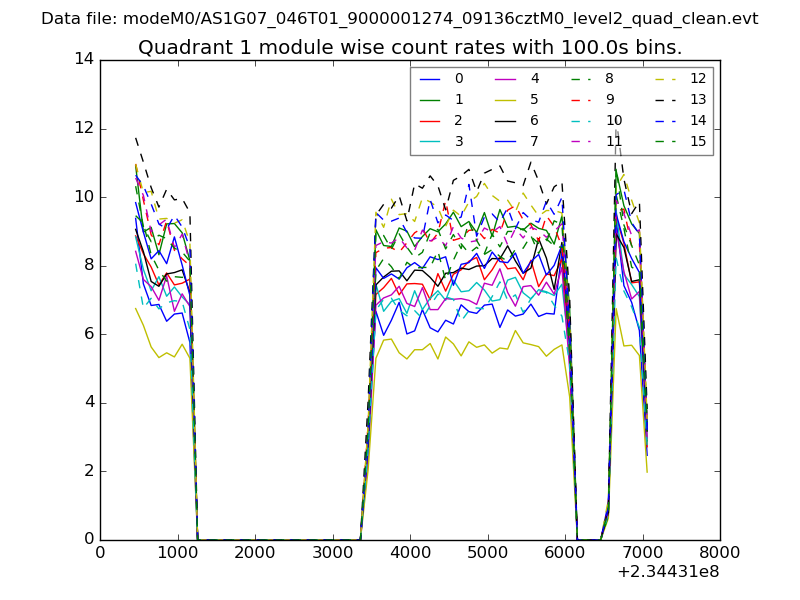
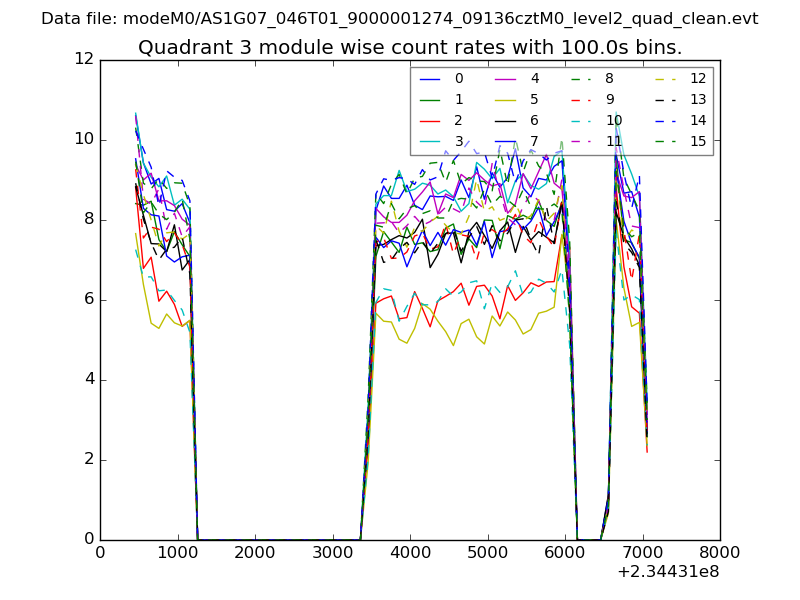
| Module-wise count rates for Quadrant A Data is divided into 100 sec bins |
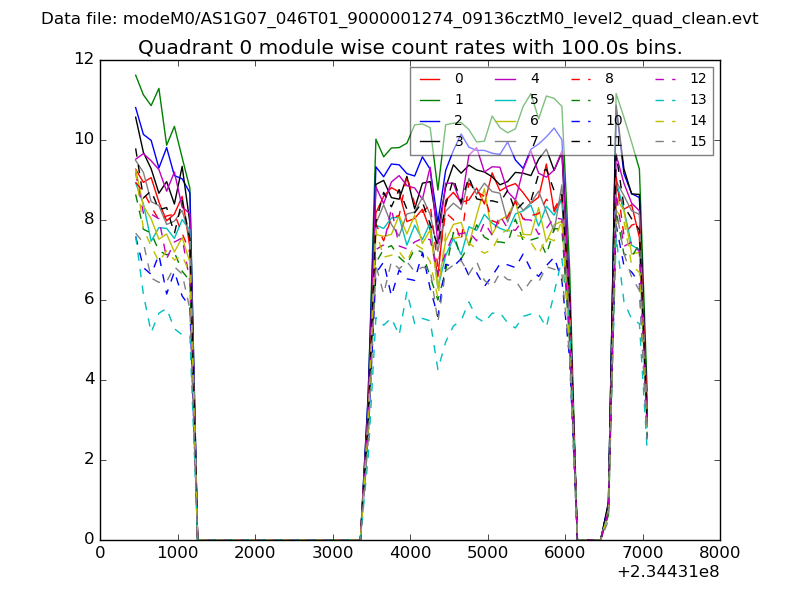 |
 |
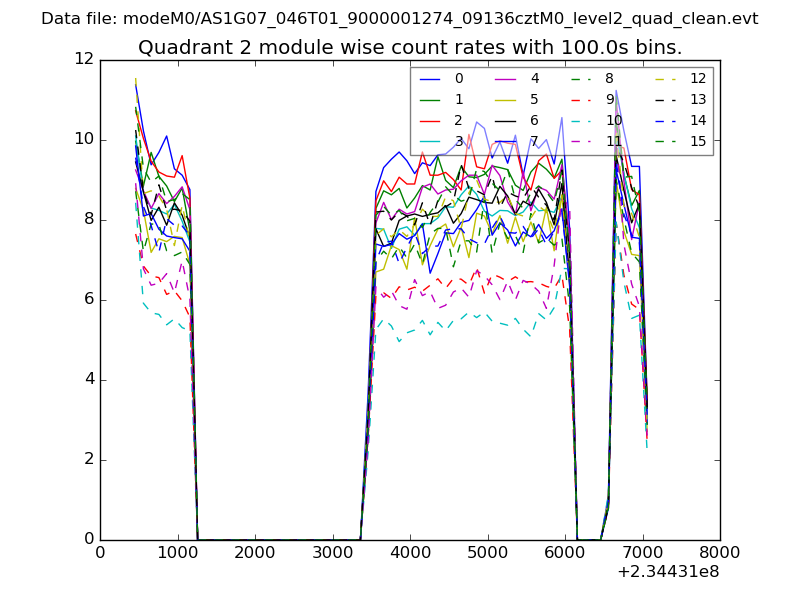
| Module-wise count rates for Quadrant B Data is divided into 100 sec bins |
 |
 |
| Module-wise count rates for Quadrant C Data is divided into 100 sec bins |
 |
 |
| Module-wise count rates for Quadrant D Data is divided into 100 sec bins |
 |
 |
| Parameter | Plot |
|---|---|
| CZT HV Monitor | 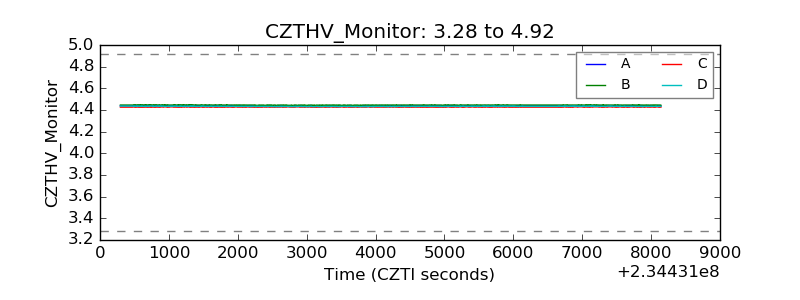 |
| D_VDD | 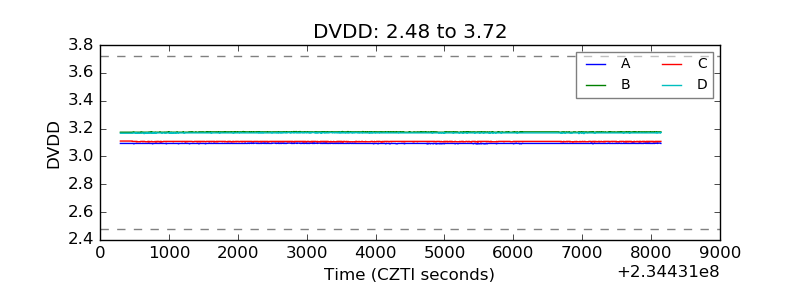 |
| Temperature 1 |  |
| Veto HV Monitor | 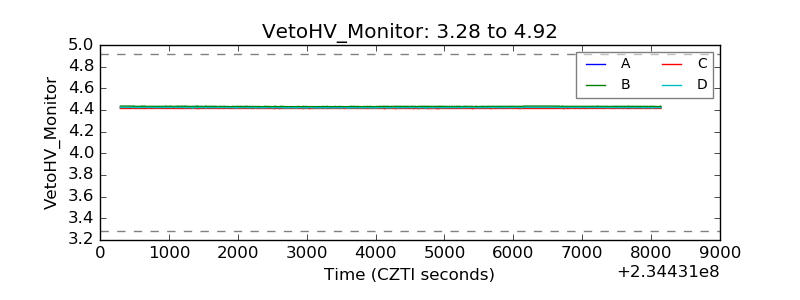 |
| Veto LLD | 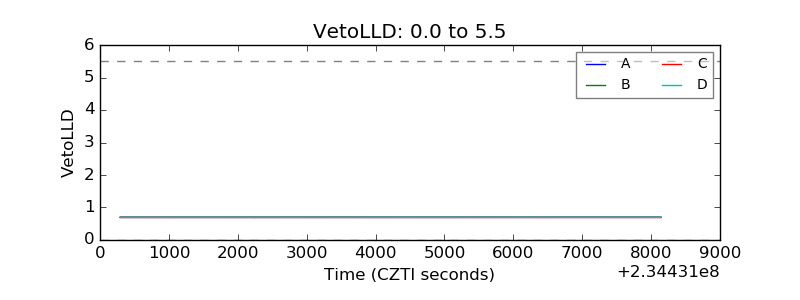 |
| Alpha Counter | 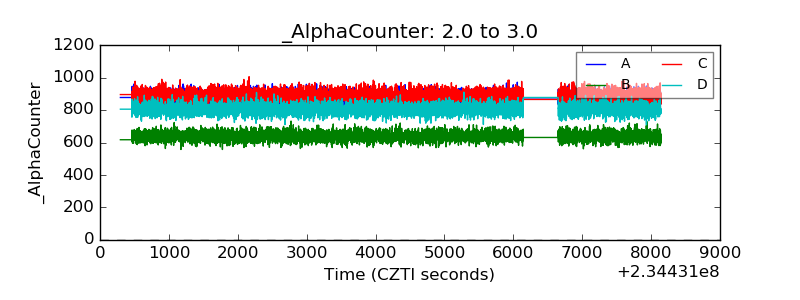 |
| _CPM_Rate | 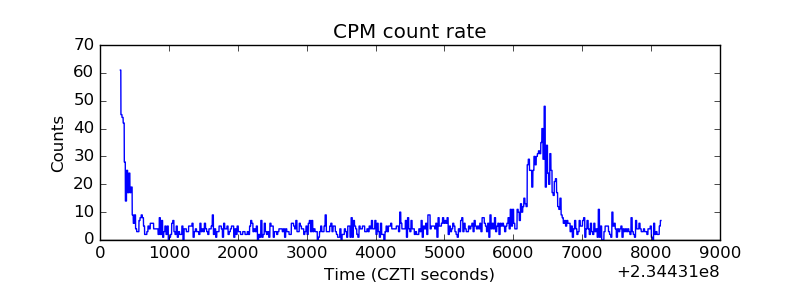 |
| CZT Counter | 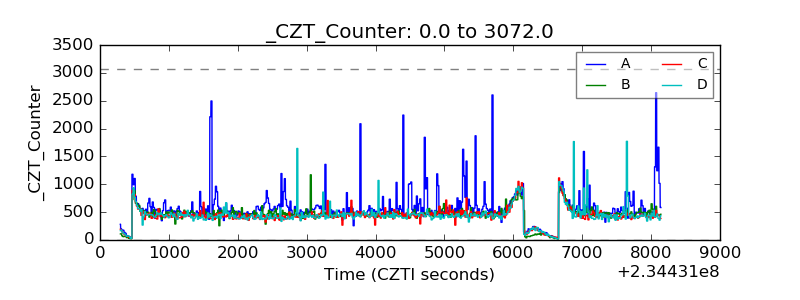 |
| +2.5 Volts monitor |  |
| +5 Volts monitor |  |
| _ROLL_ROT | 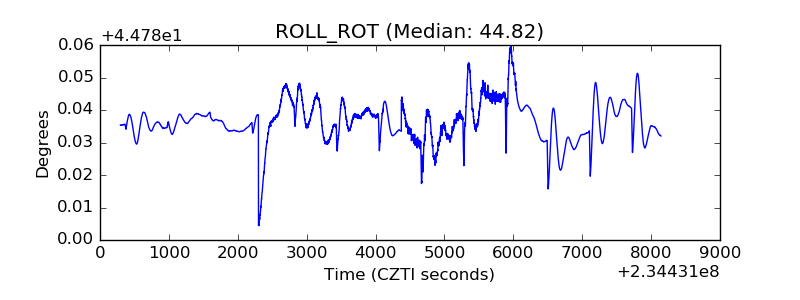 |
| _Roll_DEC | 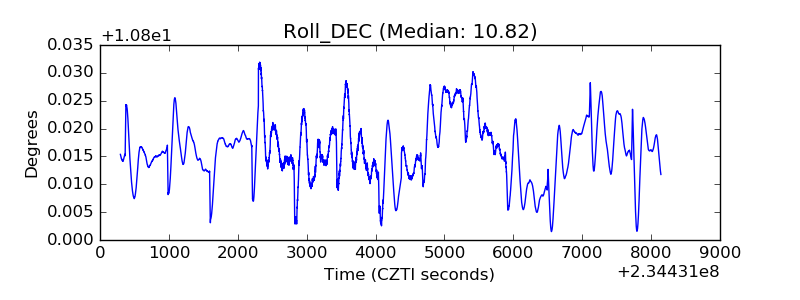 |
| _Roll_RA | 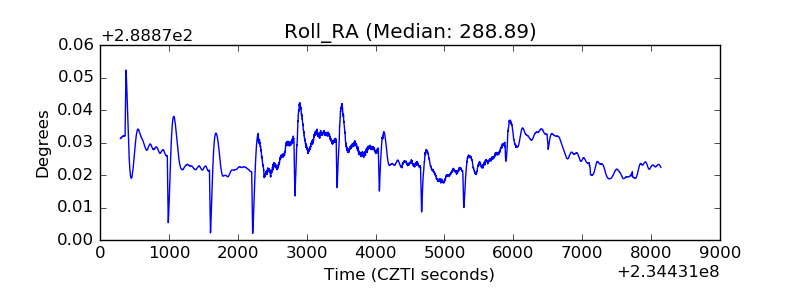 |
| Veto Counter | 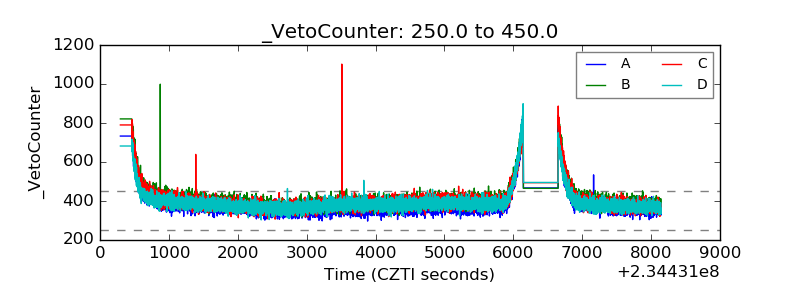 |