| Param | Original file | Final file |
|---|---|---|
| Filename | modeM0/AS1G07_046T01_9000001274_09137cztM0_level2.evt | modeM0/AS1G07_046T01_9000001274_09137cztM0_level2_quad_clean.evt |
| Size (bytes) | 536,679,360 | 81,884,160 |
| Size | 511.8 MB | 78.1 MB |
| Events in quadrant A | 4,698,262 | 490,221 |
| Events in quadrant B | 3,776,057 | 498,800 |
| Events in quadrant C | 3,527,791 | 486,587 |
| Events in quadrant D | 3,740,382 | 480,512 |
| Mode M9 | |||
|---|---|---|---|
| Quadrant | BADHDUFLAG | Total packets | Discarded packets |
| A | 0 | 3 | 0 |
| B | 0 | 3 | 0 |
| C | 0 | 3 | 0 |
| D | 0 | 4 | 0 |
| Mode SS | |||
|---|---|---|---|
| Quadrant | BADHDUFLAG | Total packets | Discarded packets |
| A | 0 | 154 | 2 |
| B | 0 | 154 | 2 |
| C | 0 | 154 | 4 |
| D | 0 | 154 | 2 |
| Mode M0 | |||
|---|---|---|---|
| Quadrant | BADHDUFLAG | Total packets | Discarded packets |
| A | 0 | 18927 | 405 |
| B | 0 | 16300 | 225 |
| C | 0 | 16065 | 227 |
| D | 0 | 16641 | 189 |
| Quadrant | Total seconds | Saturated seconds | Saturation percentage |
|---|---|---|---|
| A | 7490 | 419 | 5.594126% |
| B | 7525 | 273 | 3.627907% |
| C | 7524 | 185 | 2.458799% |
| D | 7541 | 239 | 3.169341% |
Noise dominated data is calculated using 1-second bins in cleaned event files. If a bin has >2000 counts, and if more than 50% of those come from <1% of pixels, then it is considered to be noise-dominated and hence unusable.
| Quadrant | # 1 sec bins | Bins with >0 counts | Bins with >2000 counts | High rate bins dominated by noise | Noise dominated (total time) | Noise dominated (detector-on time) | Marked lightcurve |
|---|---|---|---|---|---|---|---|
| A | 7721 | 7604 | 134 | 134 | 1.74% | 1.76% | 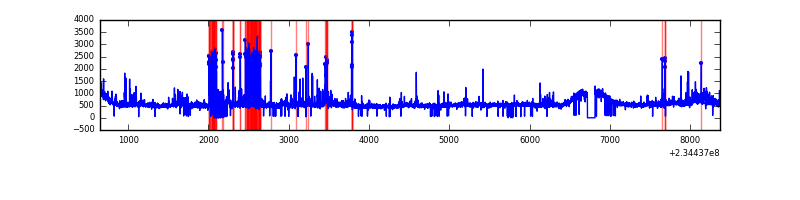 |
| B | 7721 | 7609 | 6 | 6 | 0.08% | 0.08% | 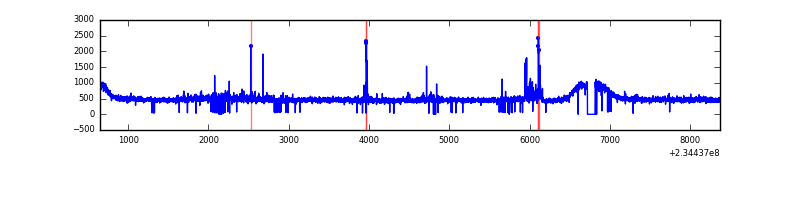 |
| C | 7721 | 7614 | 0 | 0 | 0.00% | 0.00% | 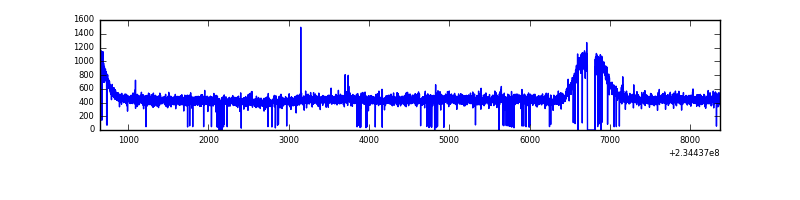 |
| D | 7721 | 7619 | 25 | 25 | 0.32% | 0.33% | 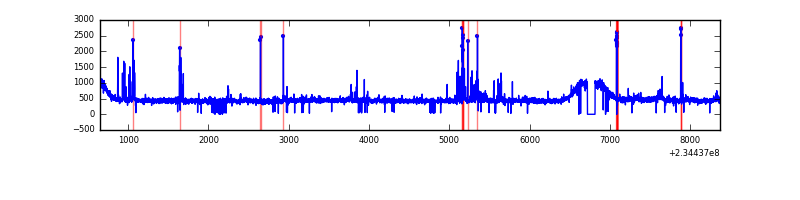 |
Top three noisy pixels from each quadrant. If the there are fewer than three noisy pixels in the level2.evt file, extra rows are filled as -1
| Pixel properties | Quadrant properties | ||||||
|---|---|---|---|---|---|---|---|
| Quadrant | DetID | PixID | Counts | Sigma | Mean | Median | Sigma |
| A | 8 | 5 | 394283 | 2077.54 | 922 | 902 | 189.3 |
| A | 15 | 223 | 263098 | 1384.72 | 922 | 902 | 189.3 |
| A | 15 | 236 | 161928 | 850.42 | 922 | 902 | 189.3 |
| B | 0 | 214 | 132450 | 713.82 | 932 | 907 | 184.3 |
| B | 12 | 111 | 21259 | 110.44 | 932 | 907 | 184.3 |
| B | 4 | 80 | 20901 | 108.5 | 932 | 907 | 184.3 |
| C | 13 | 61 | 6744 | 27.42 | 900 | 905 | 212.9 |
| C | 14 | 234 | 6691 | 27.18 | 900 | 905 | 212.9 |
| C | 8 | 128 | 4918 | 18.85 | 900 | 905 | 212.9 |
| D | 1 | 52 | 165907 | 735.39 | 912 | 891 | 224.4 |
| D | 2 | 14 | 68658 | 302.0 | 912 | 891 | 224.4 |
| D | 7 | 71 | 27438 | 118.31 | 912 | 891 | 224.4 |
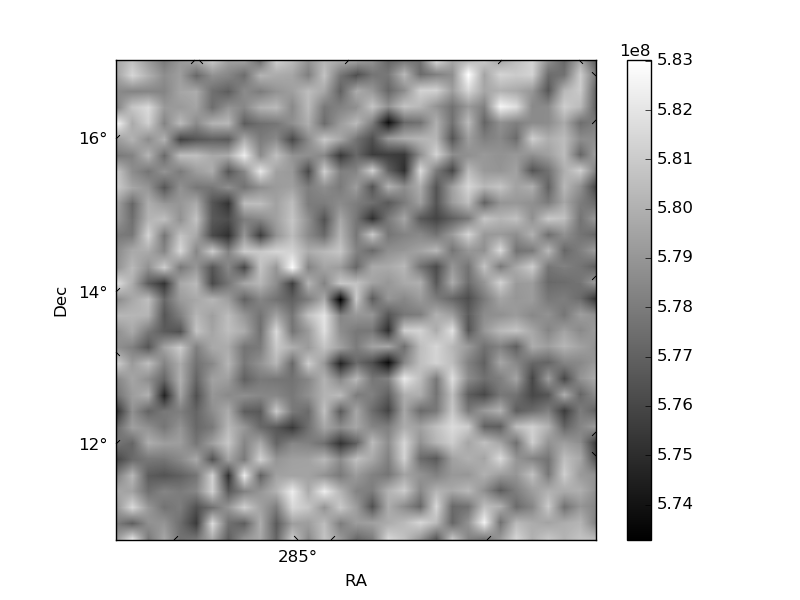
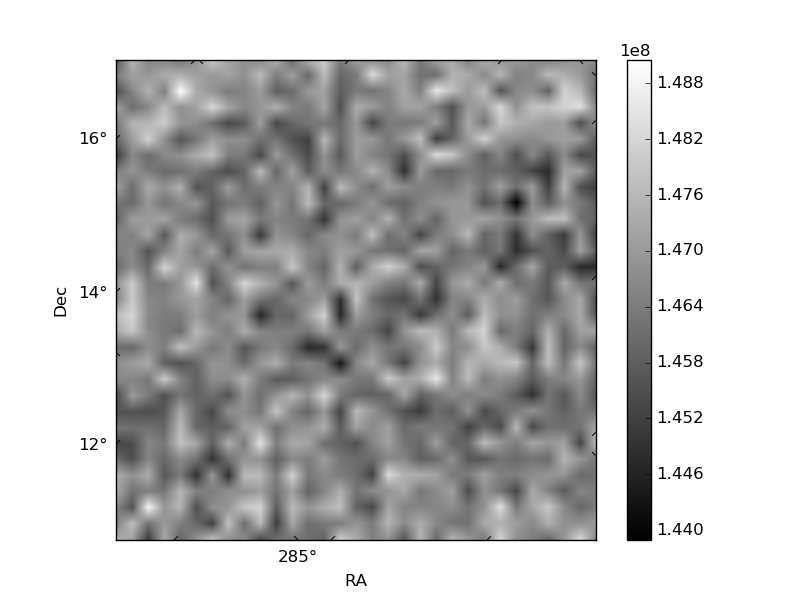
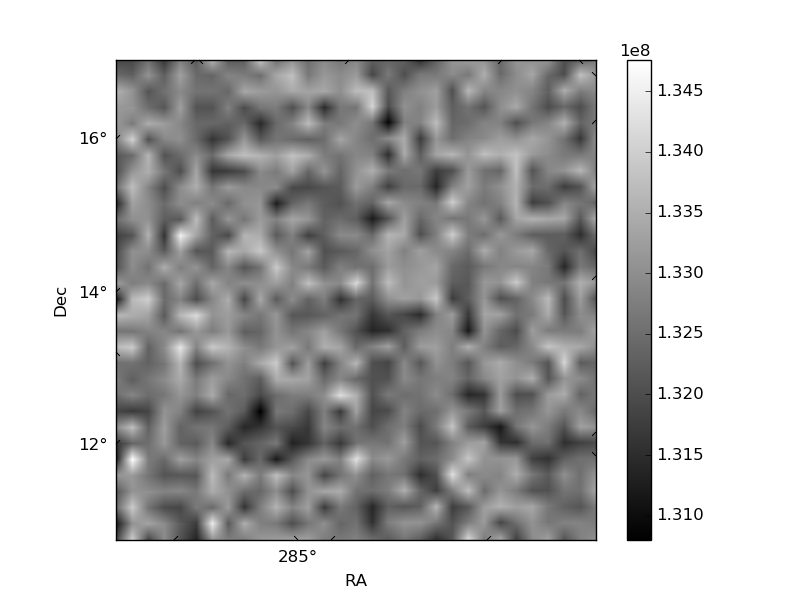
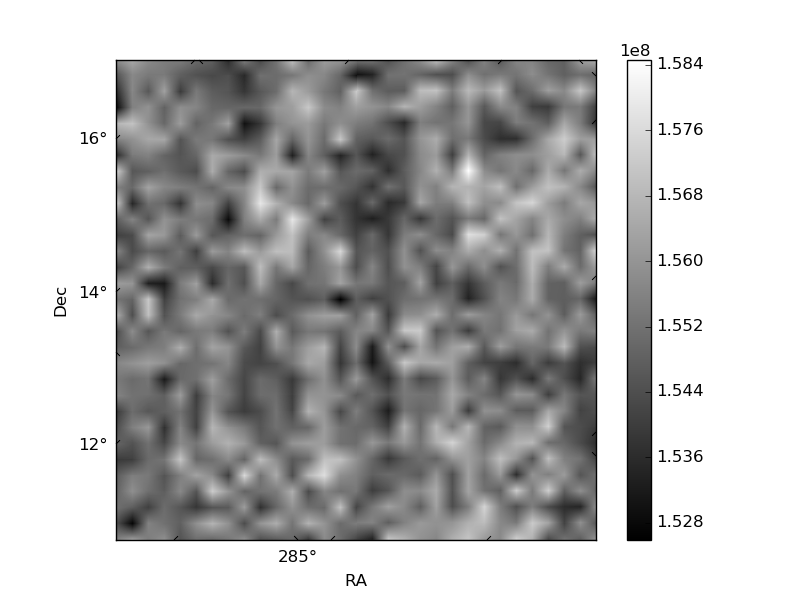
Histogram calculated using DETX and DETY for each event in the final _common_clean file
| Quadrant A | 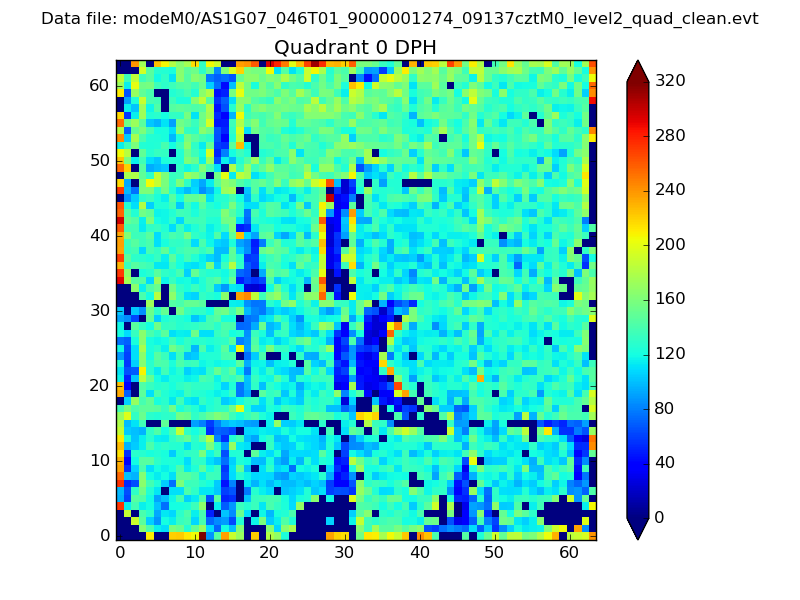 |
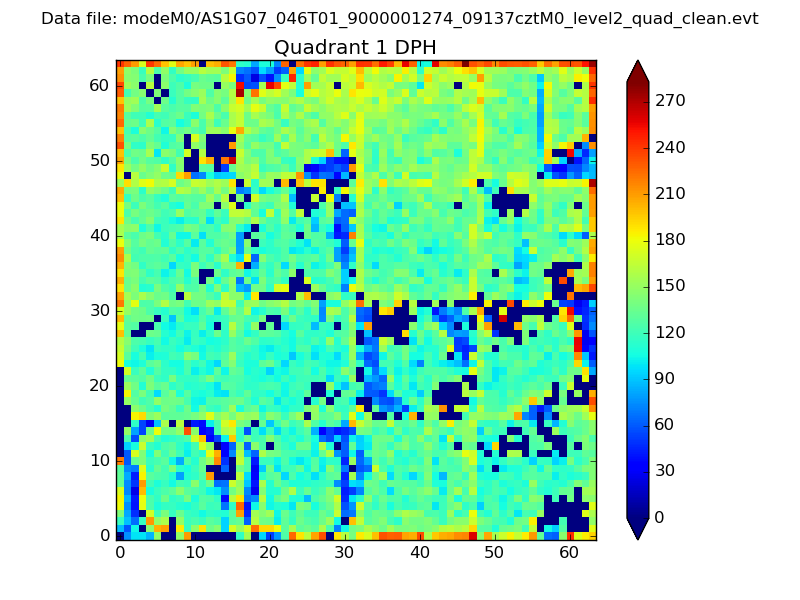 |
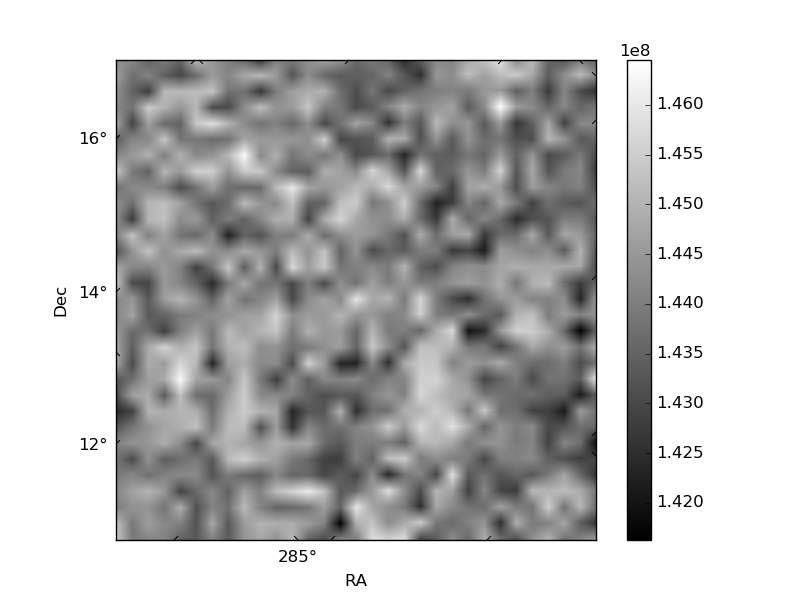
Quadrant B |
|---|---|---|---|
| Quadrant D | 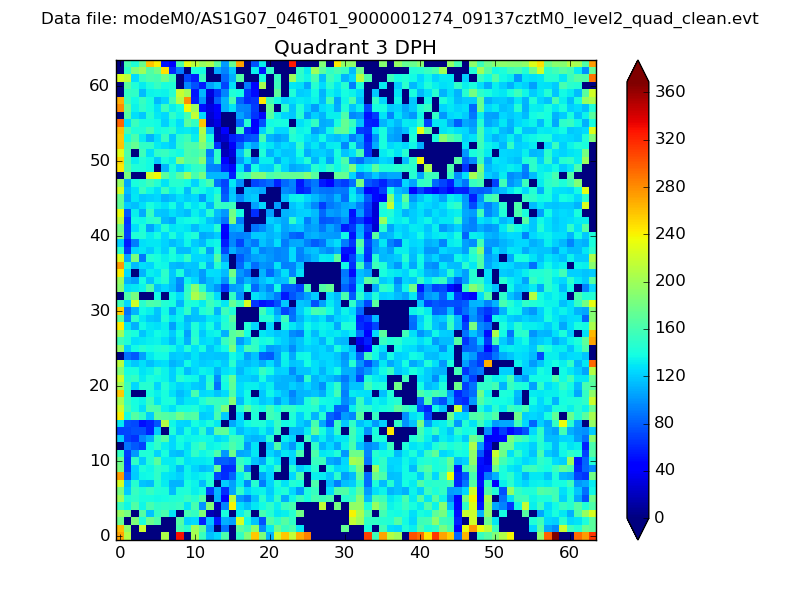 |
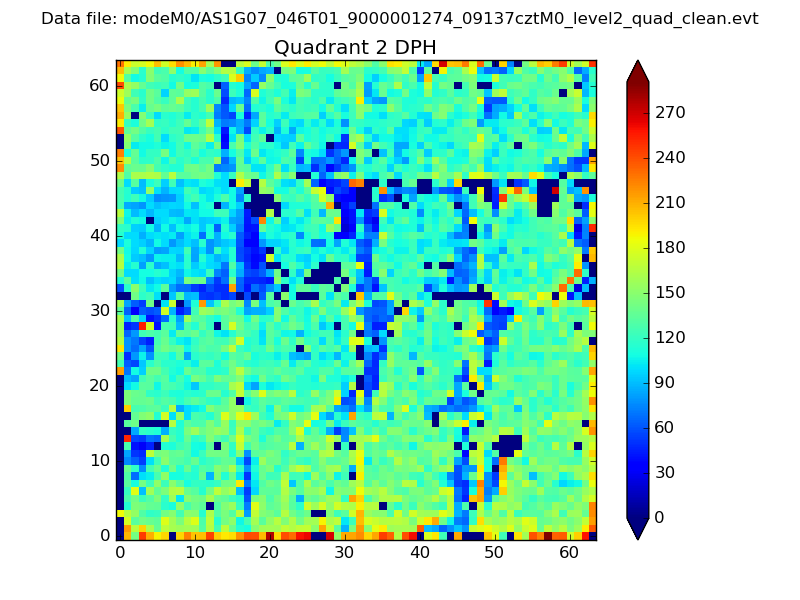 |
Quadrant C |
| Plot type | Count rate plots | Images |
|---|---|---|
| Comparison with Poisson distribution Blue bars denote a histogram of data divided into 1 sec bins. Red curve is a Poisson curve with rate = median count rate of data. |
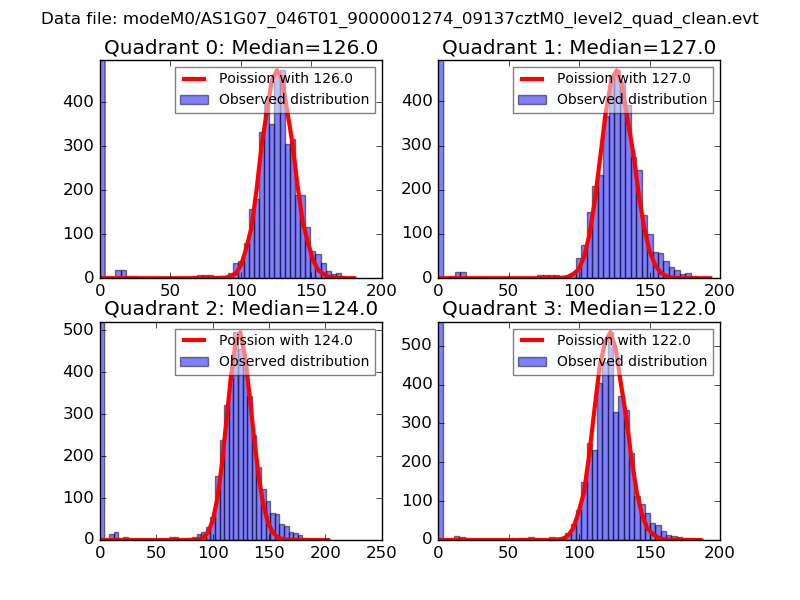 |
 |
| Quadrant-wise count rates Data is divided into 100 sec bins |
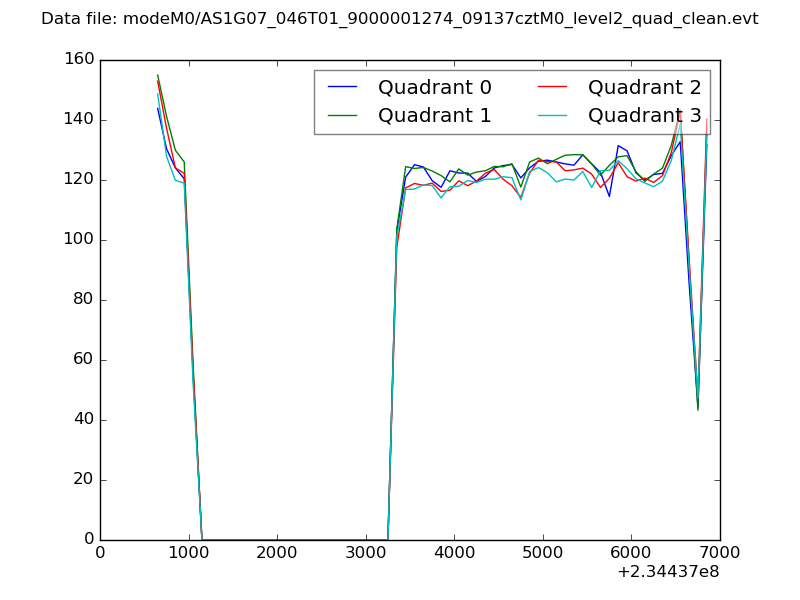 |
|
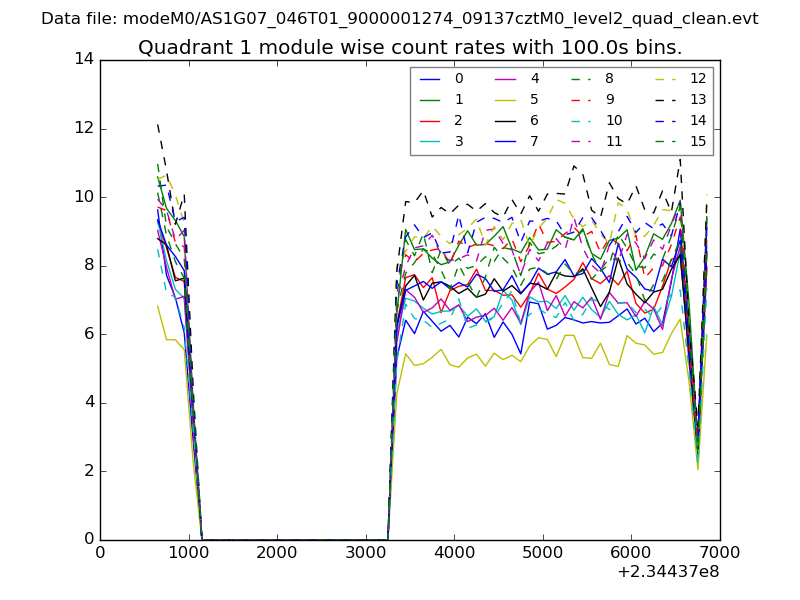
| Module-wise count rates for Quadrant A Data is divided into 100 sec bins |
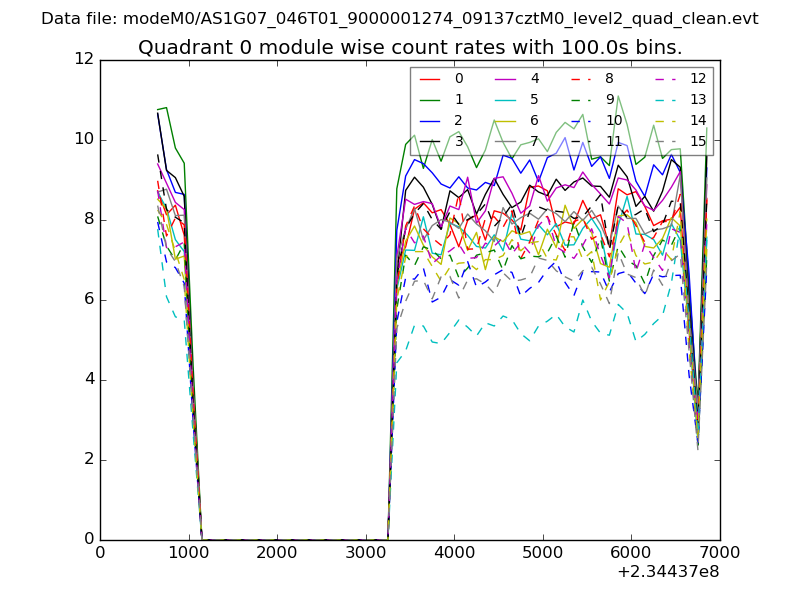 |
 |
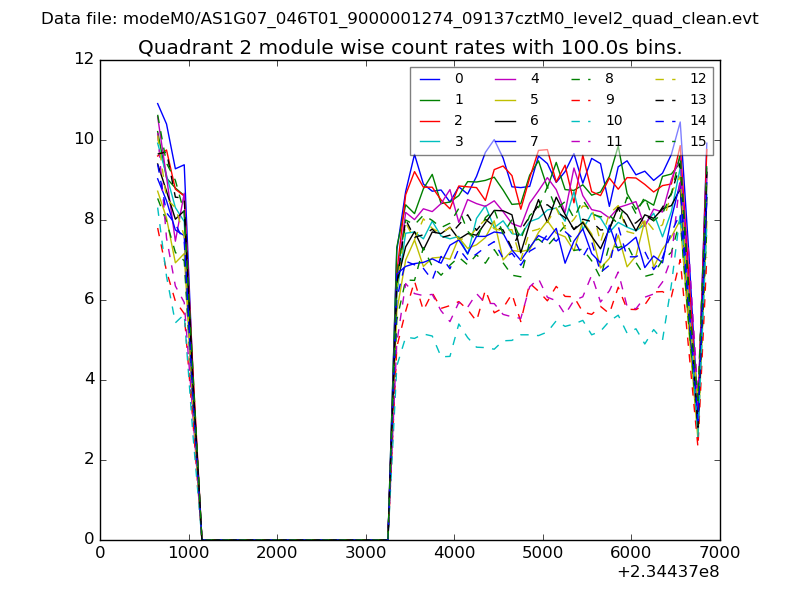
| Module-wise count rates for Quadrant B Data is divided into 100 sec bins |
 |
 |
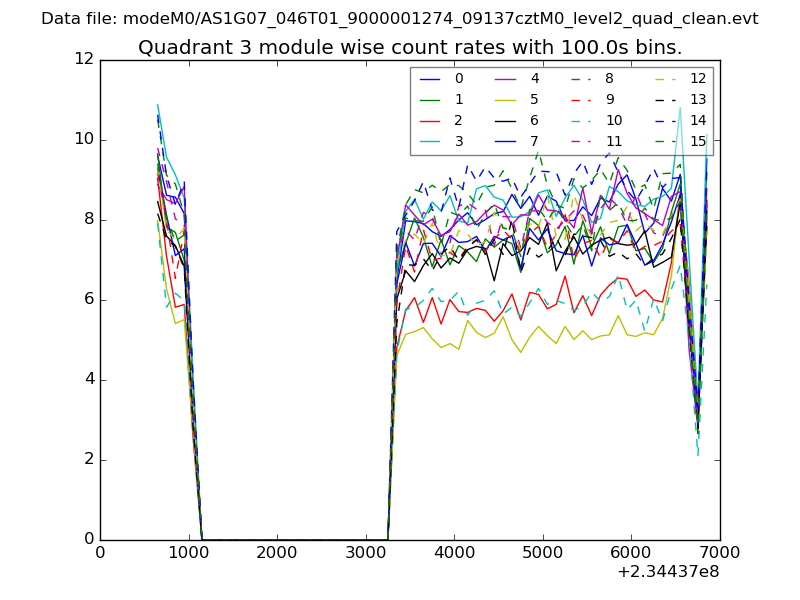
| Module-wise count rates for Quadrant C Data is divided into 100 sec bins |
 |
 |
| Module-wise count rates for Quadrant D Data is divided into 100 sec bins |
 |
 |
| Parameter | Plot |
|---|---|
| CZT HV Monitor | 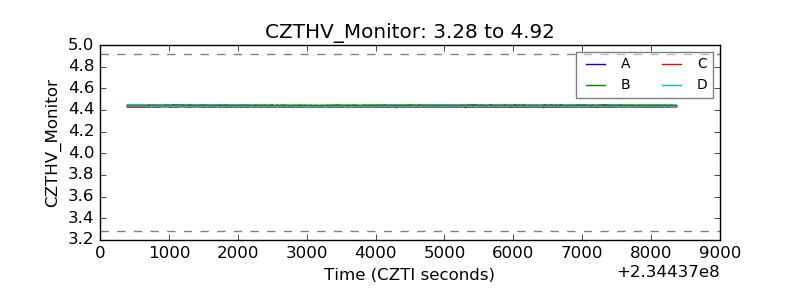 |
| D_VDD | 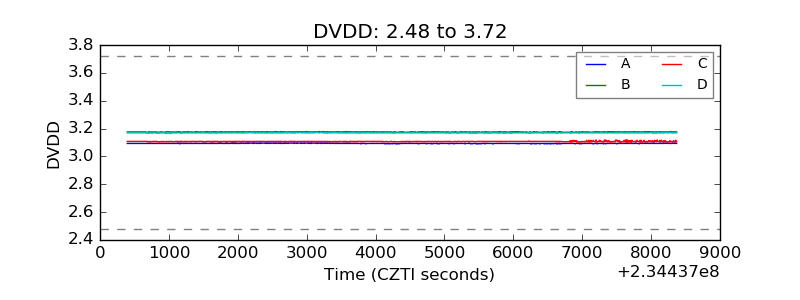 |
| Temperature 1 | 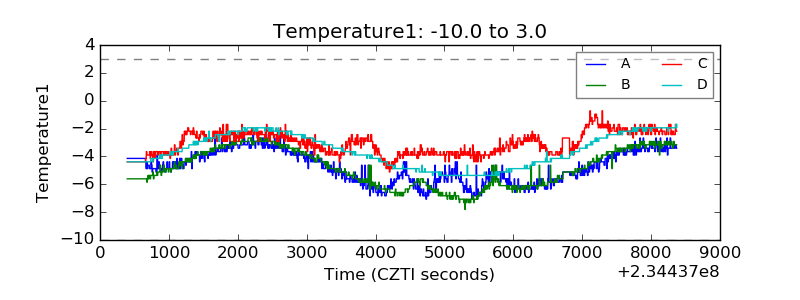 |
| Veto HV Monitor |  |
| Veto LLD | 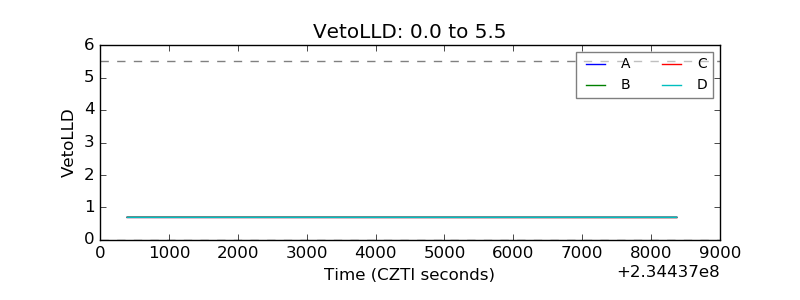 |
| Alpha Counter |  |
| _CPM_Rate |  |
| CZT Counter | 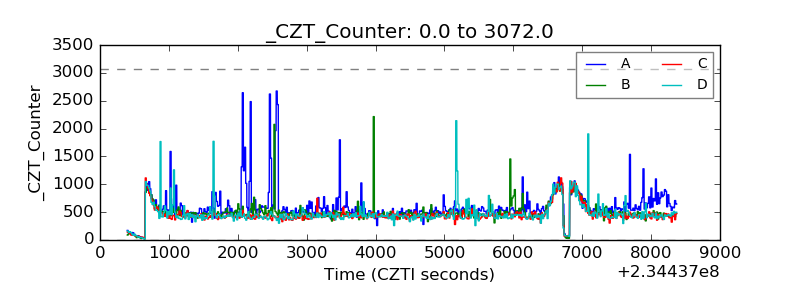 |
| +2.5 Volts monitor |  |
| +5 Volts monitor |  |
| _ROLL_ROT | 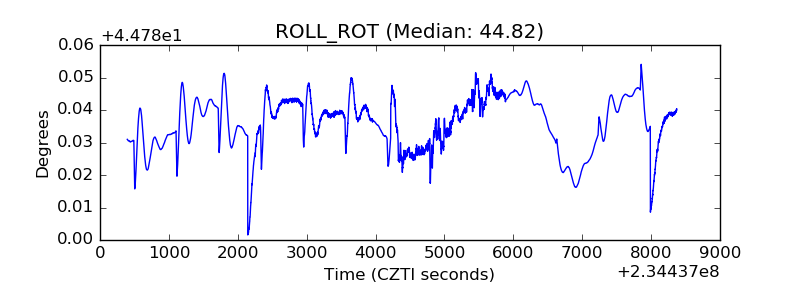 |
| _Roll_DEC | 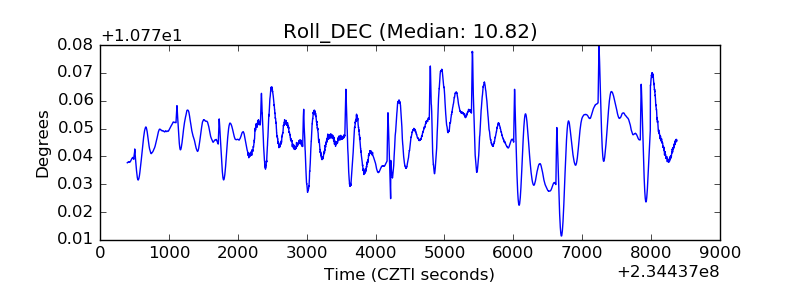 |
| _Roll_RA | 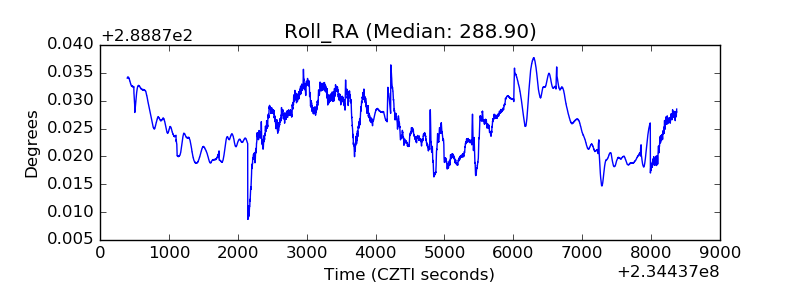 |
| Veto Counter | 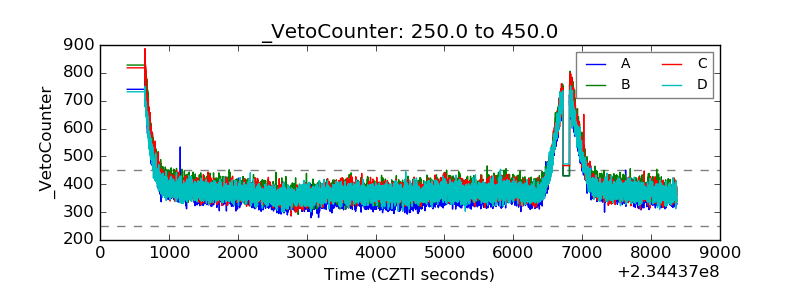 |