| Param | Original file | Final file |
|---|---|---|
| Filename | modeM0/AS1G07_046T01_9000001274_09139cztM0_level2.evt | modeM0/AS1G07_046T01_9000001274_09139cztM0_level2_quad_clean.evt |
| Size (bytes) | 520,456,320 | 73,468,800 |
| Size | 496.3 MB | 70.1 MB |
| Events in quadrant A | 5,089,260 | 422,789 |
| Events in quadrant B | 3,475,411 | 444,675 |
| Events in quadrant C | 3,371,178 | 431,116 |
| Events in quadrant D | 3,335,443 | 423,485 |
| Mode M9 | |||
|---|---|---|---|
| Quadrant | BADHDUFLAG | Total packets | Discarded packets |
| A | 0 | 6 | 0 |
| B | 0 | 6 | 0 |
| C | 0 | 6 | 0 |
| D | 0 | 6 | 0 |
| Mode SS | |||
|---|---|---|---|
| Quadrant | BADHDUFLAG | Total packets | Discarded packets |
| A | 0 | 164 | 10 |
| B | 0 | 164 | 10 |
| C | 0 | 164 | 12 |
| D | 0 | 164 | 16 |
| Mode M0 | |||
|---|---|---|---|
| Quadrant | BADHDUFLAG | Total packets | Discarded packets |
| A | 0 | 22682 | 2589 |
| B | 0 | 16337 | 1277 |
| C | 0 | 16312 | 1241 |
| D | 0 | 16335 | 1287 |
| Quadrant | Total seconds | Saturated seconds | Saturation percentage |
|---|---|---|---|
| A | 7065 | 282 | 3.991507% |
| B | 7247 | 217 | 2.994342% |
| C | 7261 | 152 | 2.093376% |
| D | 7246 | 146 | 2.014905% |
Noise dominated data is calculated using 1-second bins in cleaned event files. If a bin has >2000 counts, and if more than 50% of those come from <1% of pixels, then it is considered to be noise-dominated and hence unusable.
| Quadrant | # 1 sec bins | Bins with >0 counts | Bins with >2000 counts | High rate bins dominated by noise | Noise dominated (total time) | Noise dominated (detector-on time) | Marked lightcurve |
|---|---|---|---|---|---|---|---|
| A | 8473 | 7525 | 39 | 39 | 0.46% | 0.52% | 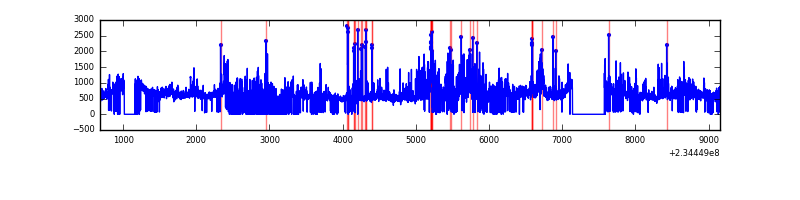 |
| B | 8473 | 7626 | 0 | 0 | 0.00% | 0.00% | 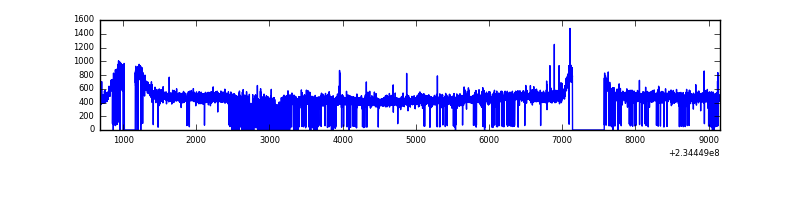 |
| C | 8473 | 7636 | 0 | 0 | 0.00% | 0.00% | 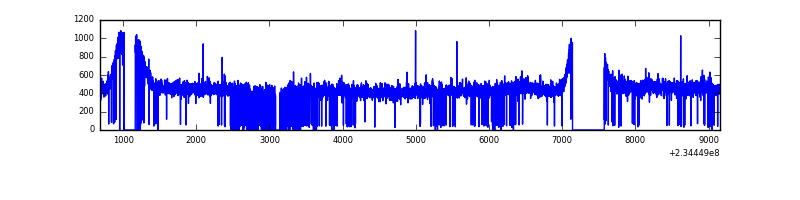 |
| D | 8473 | 7632 | 1 | 1 | 0.01% | 0.01% | 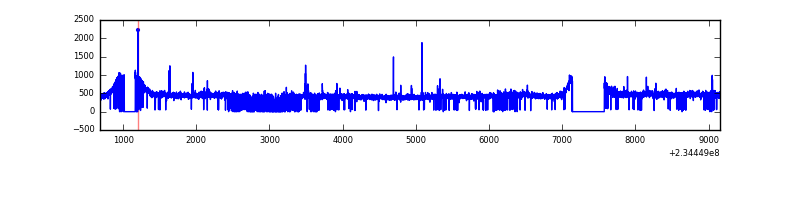 |
Top three noisy pixels from each quadrant. If the there are fewer than three noisy pixels in the level2.evt file, extra rows are filled as -1
| Pixel properties | Quadrant properties | ||||||
|---|---|---|---|---|---|---|---|
| Quadrant | DetID | PixID | Counts | Sigma | Mean | Median | Sigma |
| A | 8 | 5 | 1369447 | 7715.27 | 860 | 839 | 177.4 |
| A | 15 | 236 | 205062 | 1151.27 | 860 | 839 | 177.4 |
| A | 4 | 2 | 67834 | 377.67 | 860 | 839 | 177.4 |
| B | 0 | 214 | 26099 | 146.12 | 885 | 862 | 172.7 |
| B | 12 | 111 | 19846 | 109.92 | 885 | 862 | 172.7 |
| B | 11 | 111 | 16164 | 88.6 | 885 | 862 | 172.7 |
| C | 9 | 68 | 14542 | 67.31 | 858 | 862 | 203.2 |
| C | 13 | 61 | 6548 | 27.98 | 858 | 862 | 203.2 |
| C | 12 | 4 | 5045 | 20.58 | 858 | 862 | 203.2 |
| D | 2 | 234 | 27028 | 122.13 | 859 | 837 | 214.4 |
| D | 1 | 52 | 24430 | 110.02 | 859 | 837 | 214.4 |
| D | 2 | 14 | 17512 | 77.76 | 859 | 837 | 214.4 |
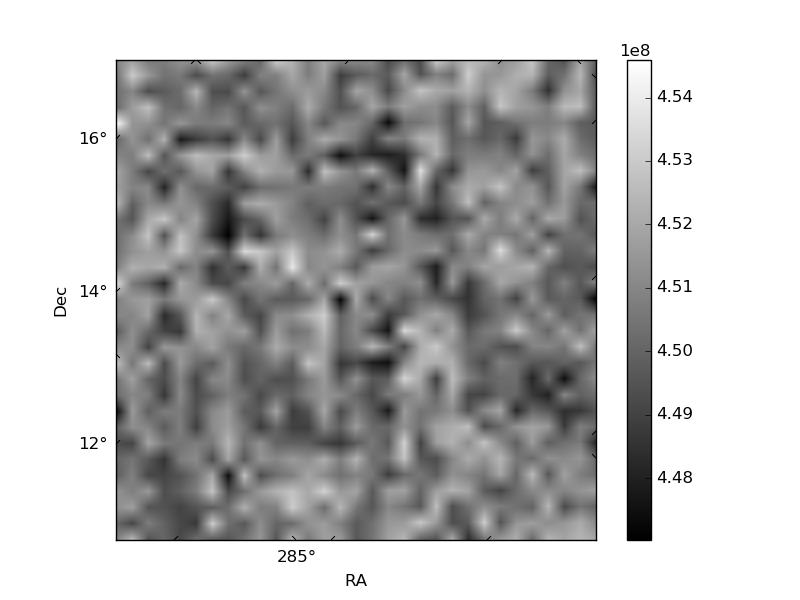
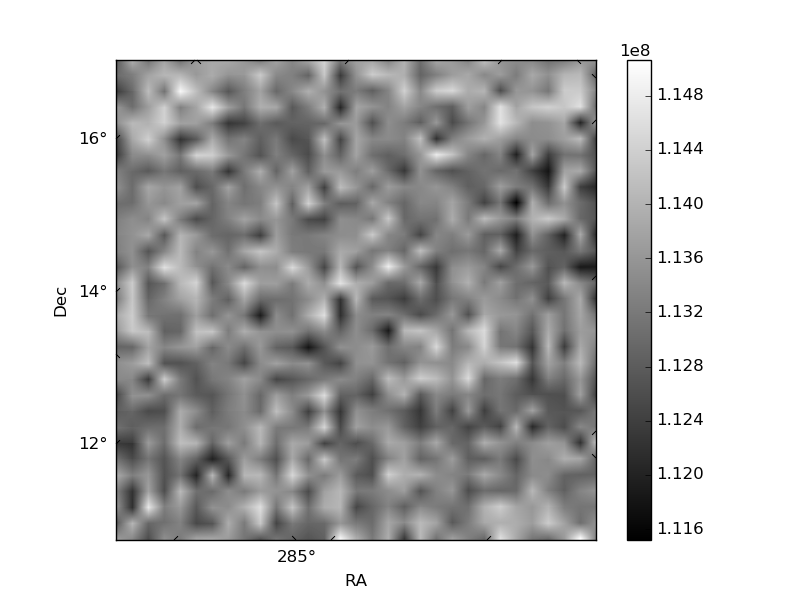
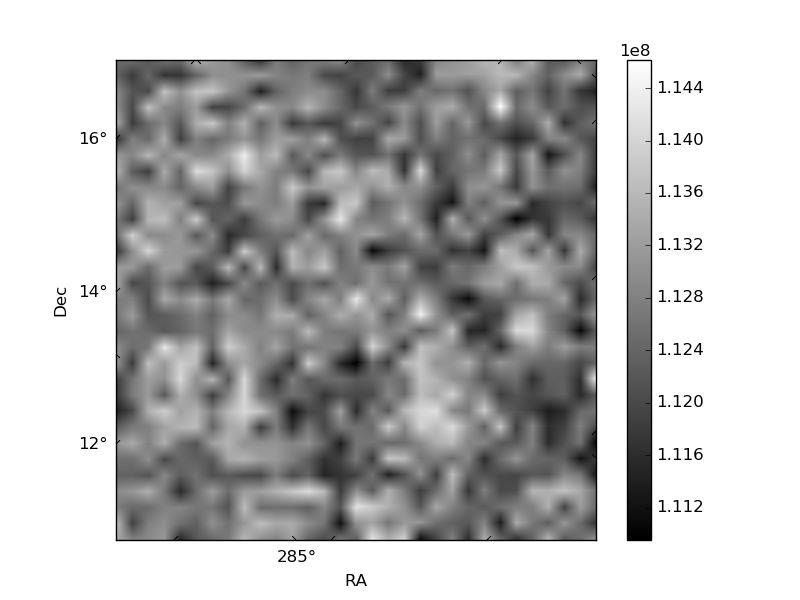
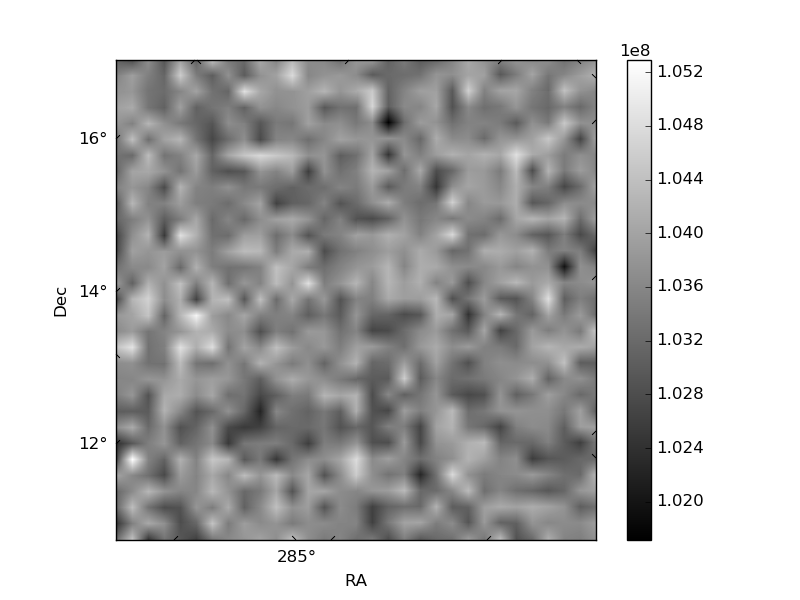
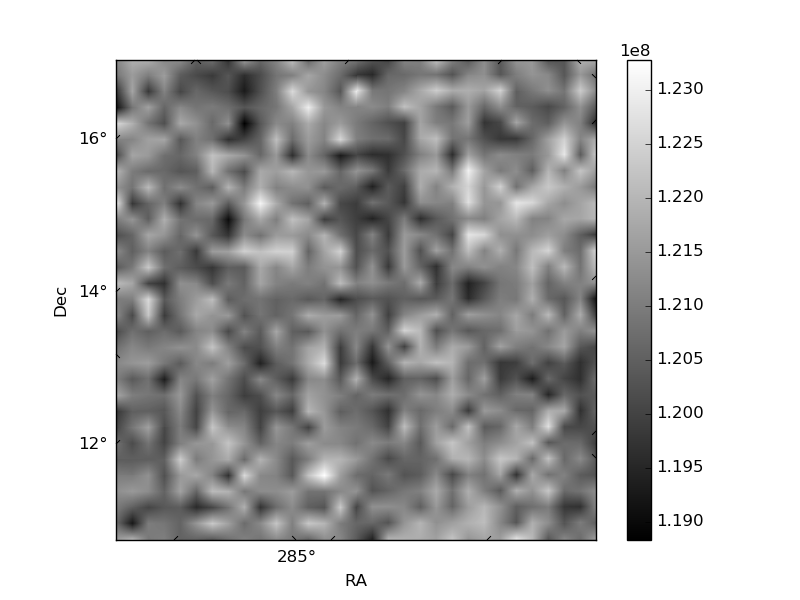
Histogram calculated using DETX and DETY for each event in the final _common_clean file
| Quadrant A | 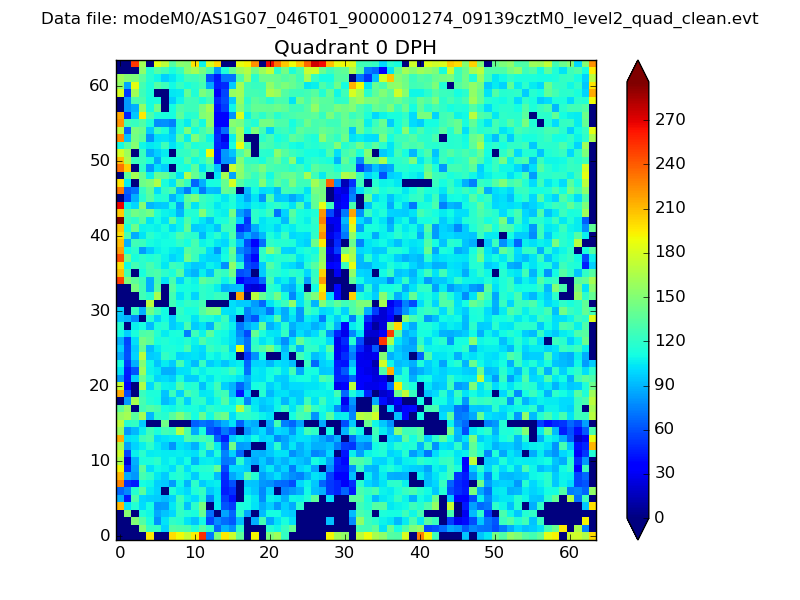 |
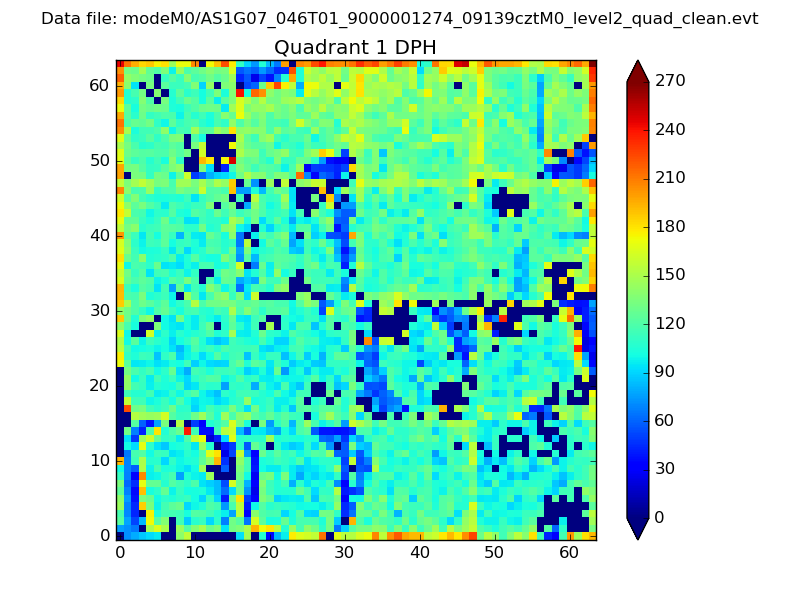 |
Quadrant B |
|---|---|---|---|
| Quadrant D |  |
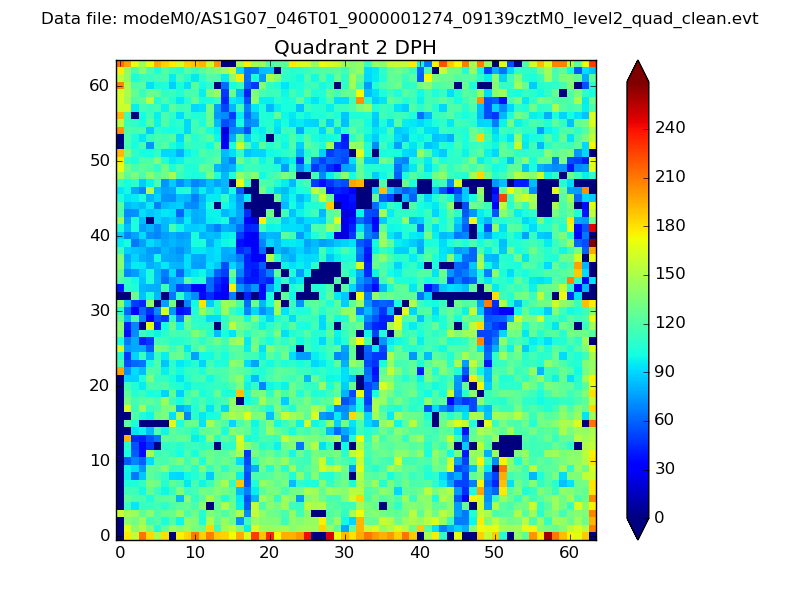 |
Quadrant C |
| Plot type | Count rate plots | Images |
|---|---|---|
| Comparison with Poisson distribution Blue bars denote a histogram of data divided into 1 sec bins. Red curve is a Poisson curve with rate = median count rate of data. |
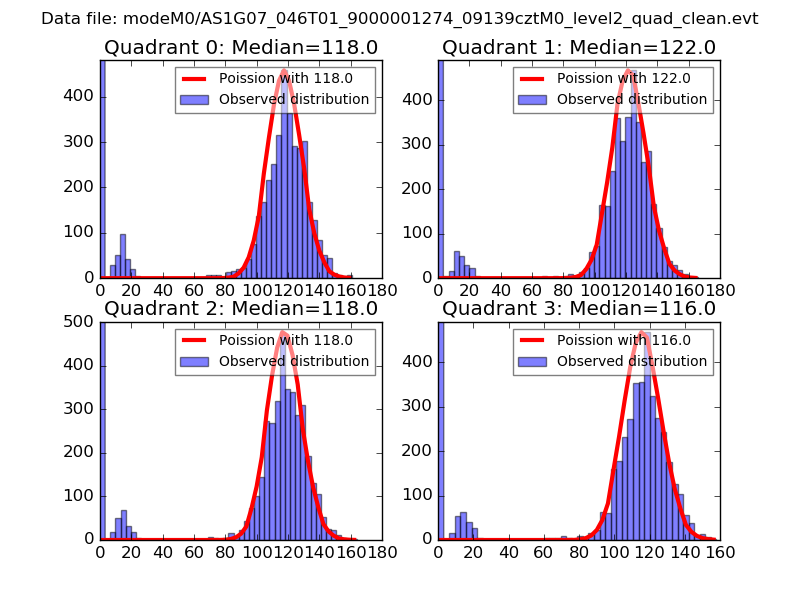 |
 |
| Quadrant-wise count rates Data is divided into 100 sec bins |
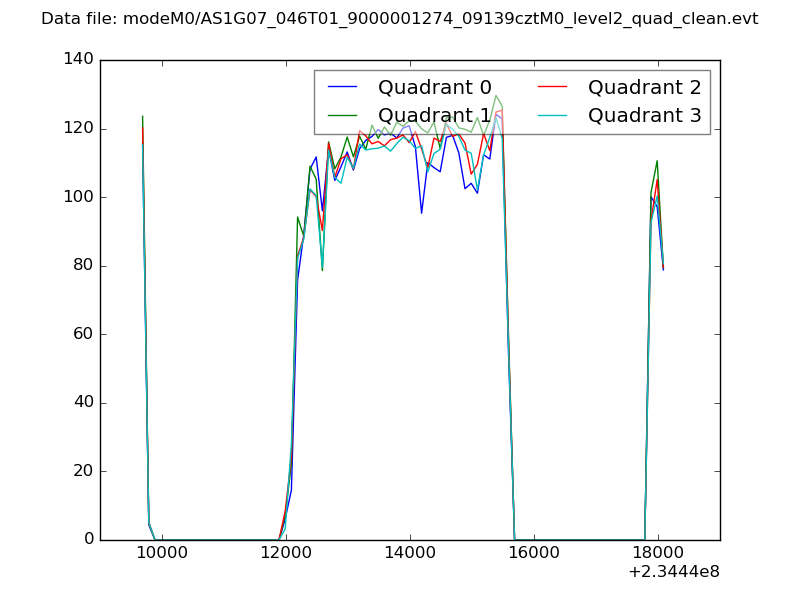 |
|
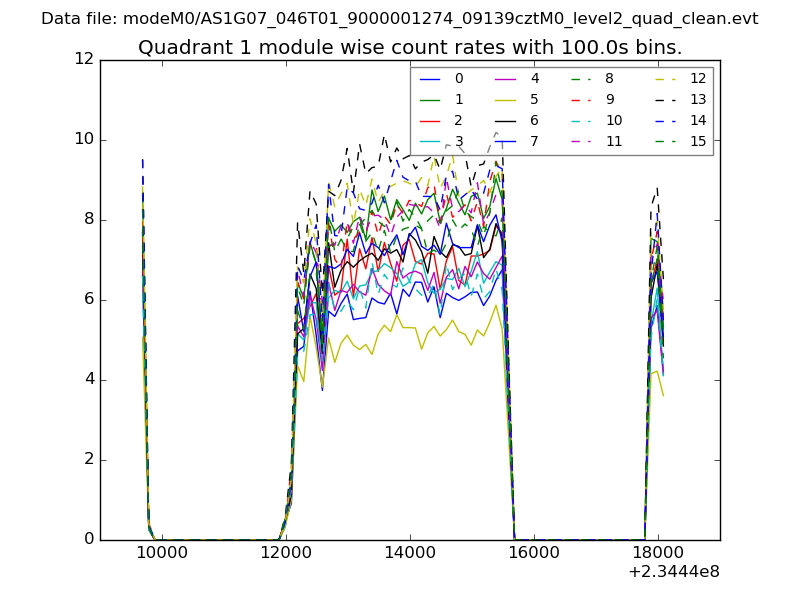
| Module-wise count rates for Quadrant A Data is divided into 100 sec bins |
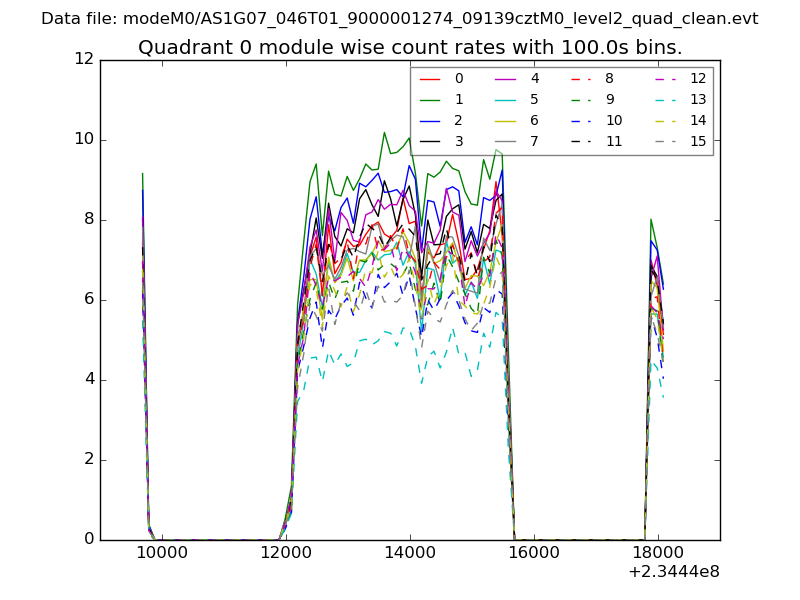 |
 |
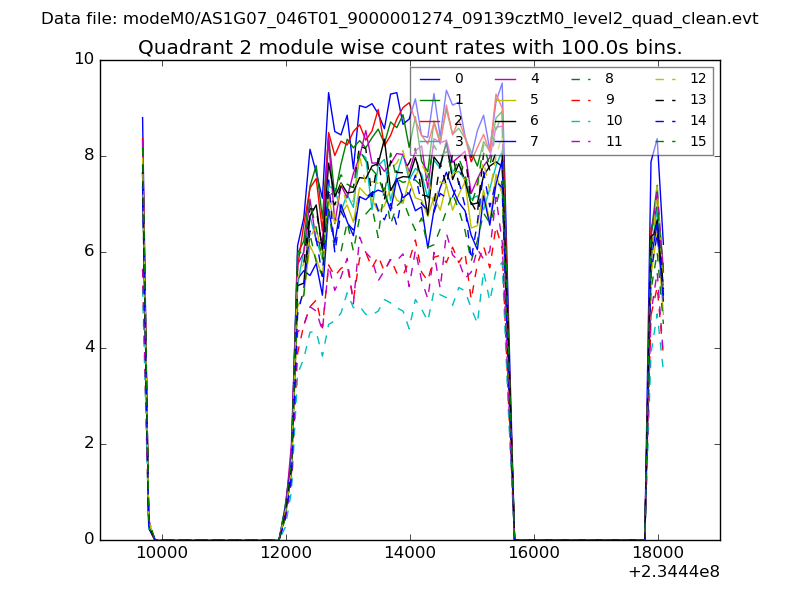
| Module-wise count rates for Quadrant B Data is divided into 100 sec bins |
 |
 |
| Module-wise count rates for Quadrant C Data is divided into 100 sec bins |
 |
 |
| Module-wise count rates for Quadrant D Data is divided into 100 sec bins |
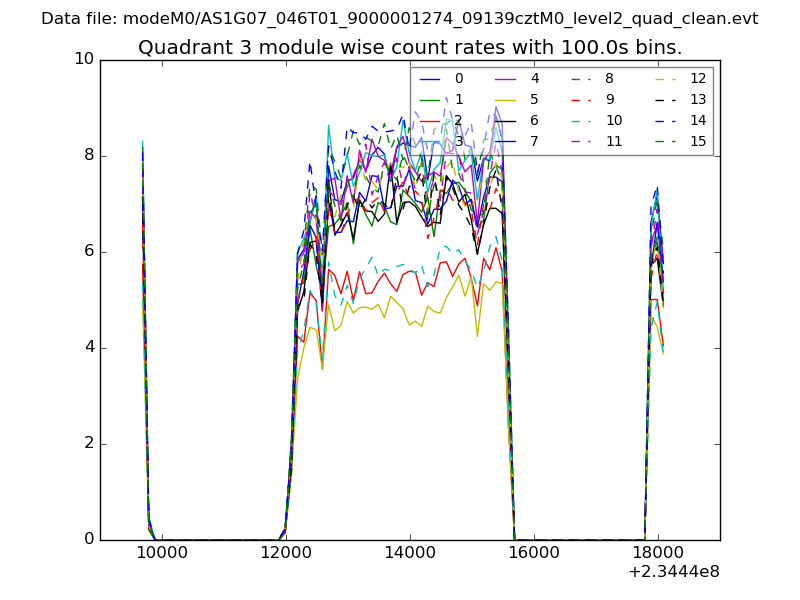 |
 |
| Parameter | Plot |
|---|---|
| CZT HV Monitor | 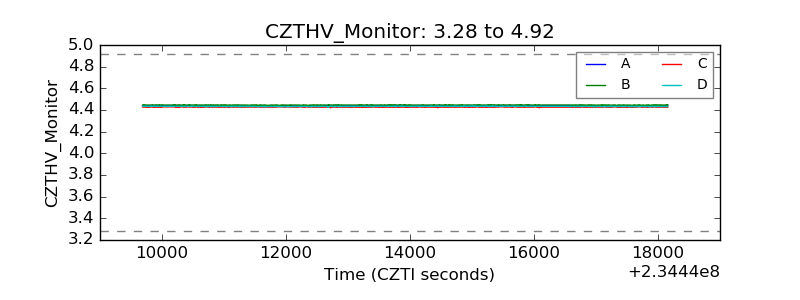 |
| D_VDD | 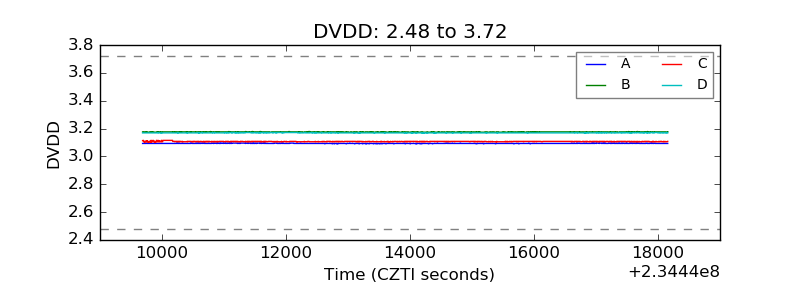 |
| Temperature 1 | 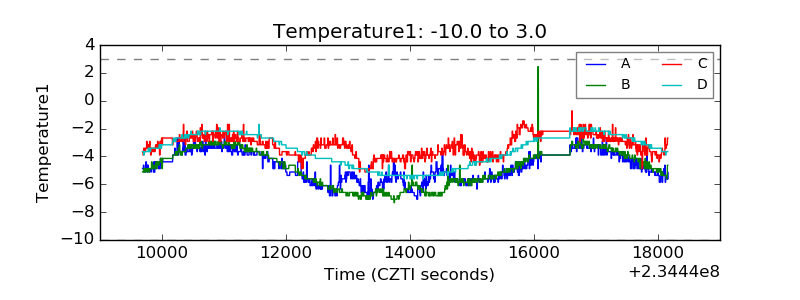 |
| Veto HV Monitor | 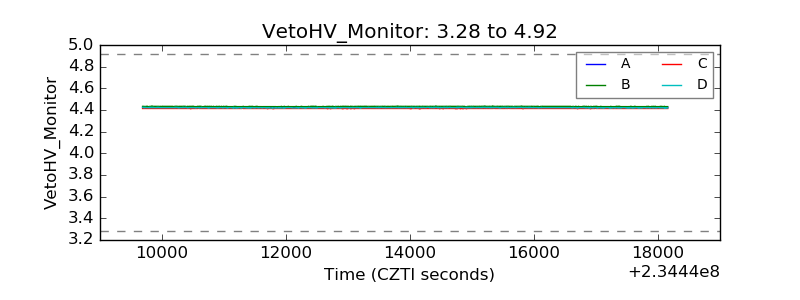 |
| Veto LLD | 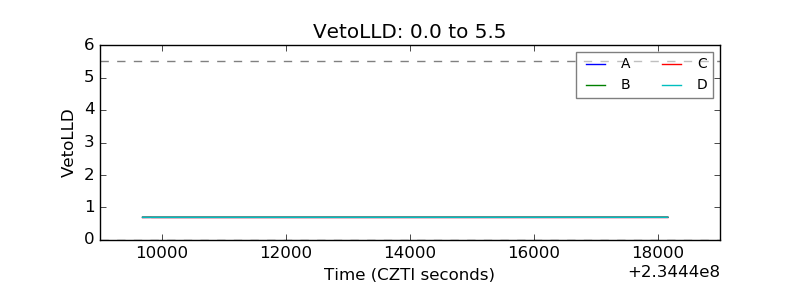 |
| Alpha Counter | 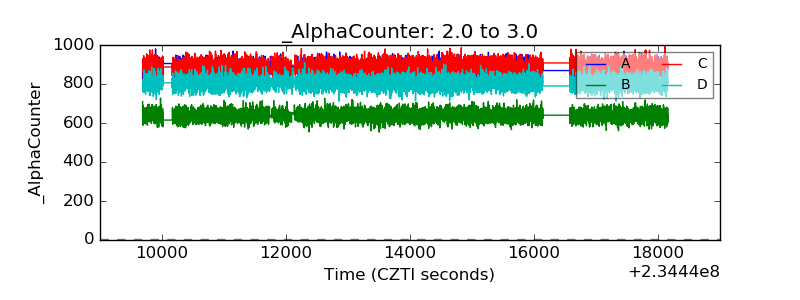 |
| _CPM_Rate | 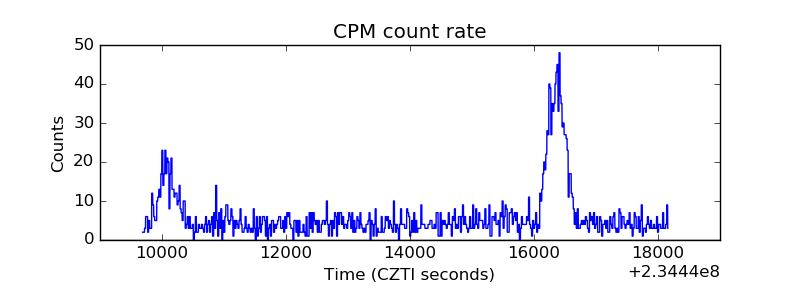 |
| CZT Counter |  |
| +2.5 Volts monitor |  |
| +5 Volts monitor |  |
| _ROLL_ROT | 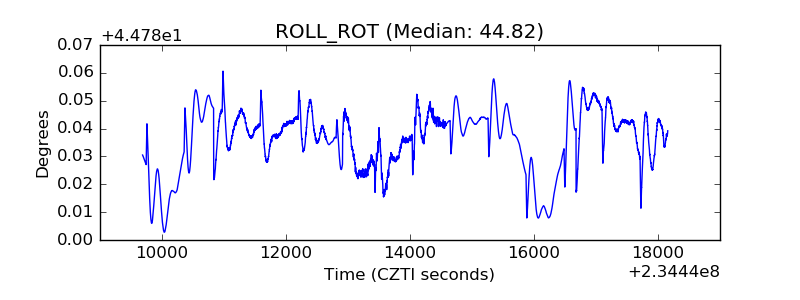 |
| _Roll_DEC | 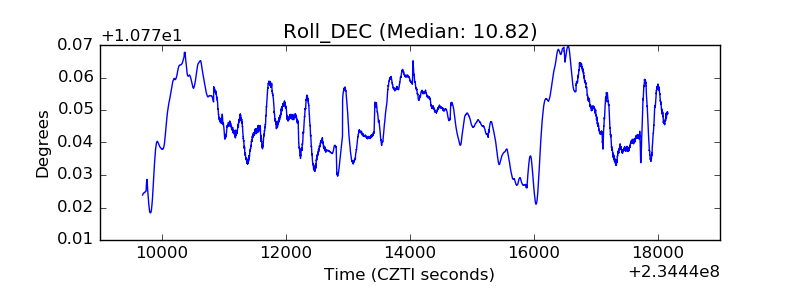 |
| _Roll_RA | 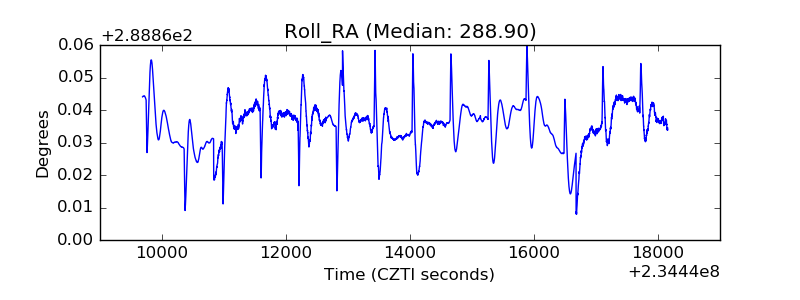 |
| Veto Counter | 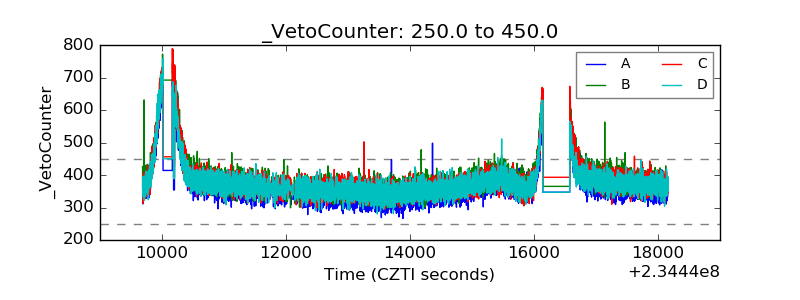 |