| Param | Original file | Final file |
|---|---|---|
| Filename | modeM0/AS1G07_052T01_9000001270cztM0_level2.fits | modeM0/AS1G07_052T01_9000001270cztM0_level2_quad_clean.evt |
| Size (bytes) | 144,167,040 | 135,089,280 |
| Size | 137.5 MB | 128.8 MB |
| Events in quadrant A | 853,972 | 788,819 |
| Events in quadrant B | 830,340 | 786,185 |
| Events in quadrant C | 848,374 | 739,337 |
| Events in quadrant D | 736,364 | 679,090 |
| Mode M0 | |||
|---|---|---|---|
| Quadrant | BADHDUFLAG | Total packets | Discarded packets |
| A | 0 | 39012 | 0 |
| B | 0 | 32793 | 0 |
| C | 0 | 32681 | 0 |
| D | 0 | 36611 | 0 |
| Mode SS | |||
|---|---|---|---|
| Quadrant | BADHDUFLAG | Total packets | Discarded packets |
| A | 0 | 322 | 0 |
| B | 0 | 324 | 0 |
| C | 0 | 324 | 0 |
| D | 0 | 324 | 0 |
| Mode M9 | |||
|---|---|---|---|
| Quadrant | BADHDUFLAG | Total packets | Discarded packets |
| A | 0 | 16 | 0 |
| B | 0 | 16 | 0 |
| C | 0 | 16 | 0 |
| D | 0 | 16 | 0 |
| Quadrant | Total seconds | Saturated seconds | Saturation percentage |
|---|---|---|---|
| A | 15910 | 307 | 1.929604% |
| B | 15904 | 175 | 1.100352% |
| C | 15907 | 153 | 0.961841% |
| D | 15905 | 446 | 2.804150% |
Noise dominated data is calculated using 1-second bins in cleaned event files. If a bin has >2000 counts, and if more than 50% of those come from <1% of pixels, then it is considered to be noise-dominated and hence unusable.
| Quadrant | # 1 sec bins | Bins with >0 counts | Bins with >2000 counts | High rate bins dominated by noise | Noise dominated (total time) | Noise dominated (detector-on time) | Marked lightcurve |
|---|---|---|---|---|---|---|---|
| A | 17505 | 15912 | 0 | 0 | 0.00% | 0.00% | 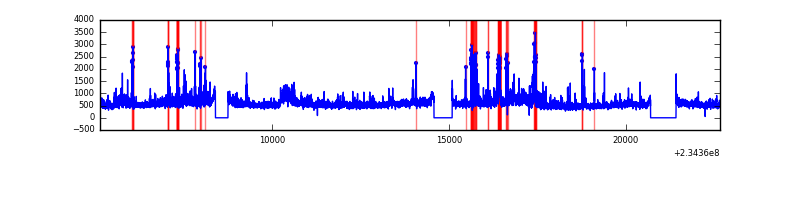 |
| B | 17505 | 15912 | 0 | 0 | 0.00% | 0.00% | 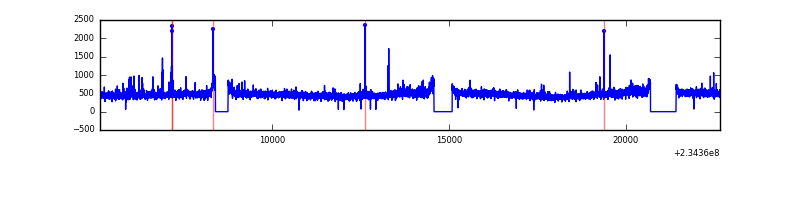 |
| C | 17505 | 15912 | 0 | 0 | 0.00% | 0.00% | 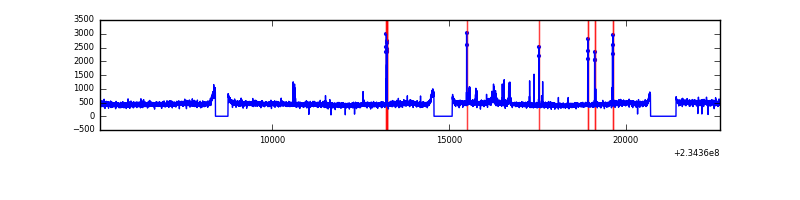 |
| D | 17505 | 15908 | 0 | 0 | 0.00% | 0.00% | 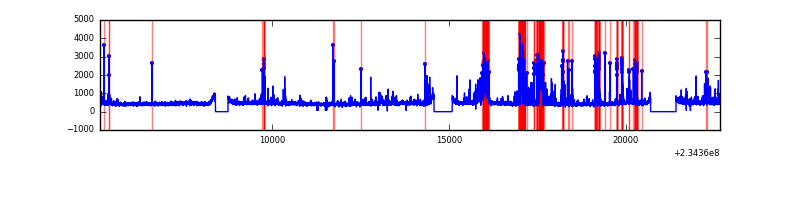 |
Top three noisy pixels from each quadrant. If the there are fewer than three noisy pixels in the level2.evt file, extra rows are filled as -1
| Pixel properties | Quadrant properties | ||||||
|---|---|---|---|---|---|---|---|
| Quadrant | DetID | PixID | Counts | Sigma | Mean | Median | Sigma |
| A | 14 | 188 | 923 | 12.23 | 222 | 207 | 58.5 |
| A | 0 | 29 | 848 | 10.95 | 222 | 207 | 58.5 |
| A | 14 | 204 | 751 | 9.29 | 222 | 207 | 58.5 |
| B | 2 | 9 | 698 | 10.52 | 218 | 207 | 46.7 |
| B | 12 | 226 | 566 | 7.69 | 218 | 207 | 46.7 |
| B | 14 | 254 | 562 | 7.61 | 218 | 207 | 46.7 |
| C | 1 | 81 | 663 | 7.44 | 224 | 207 | 61.3 |
| C | 1 | 80 | 660 | 7.39 | 224 | 207 | 61.3 |
| C | 3 | 158 | 573 | 5.97 | 224 | 207 | 61.3 |
| D | 3 | 14 | 592 | 6.99 | 209 | 189 | 57.6 |
| D | 3 | 31 | 533 | 5.97 | 209 | 189 | 57.6 |
| D | 1 | 19 | 528 | 5.88 | 209 | 189 | 57.6 |
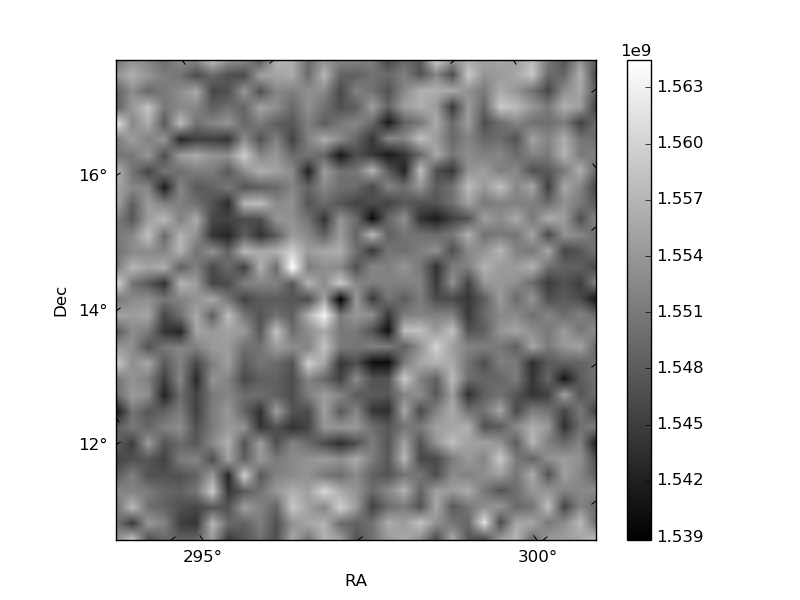
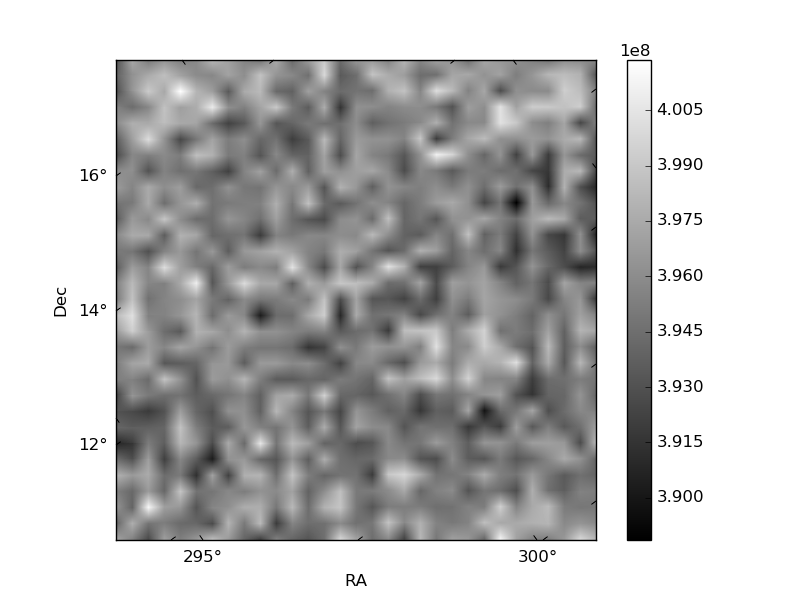
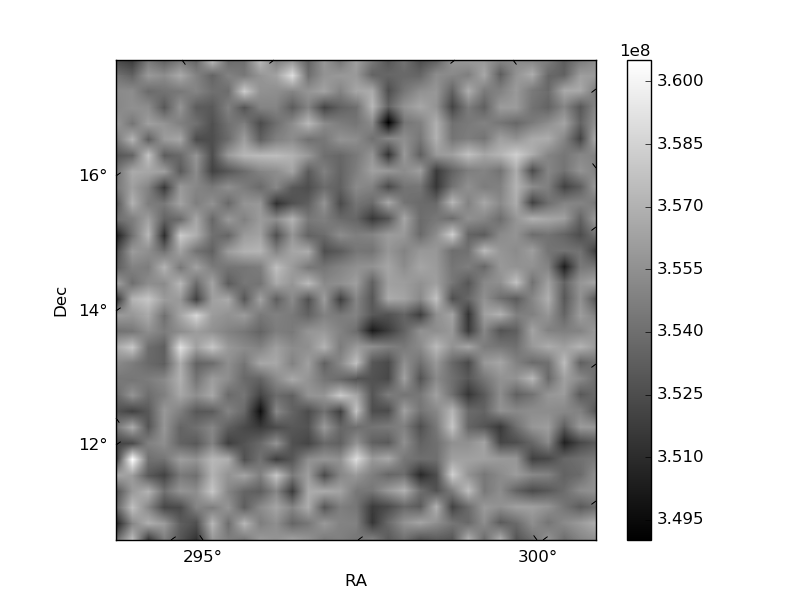
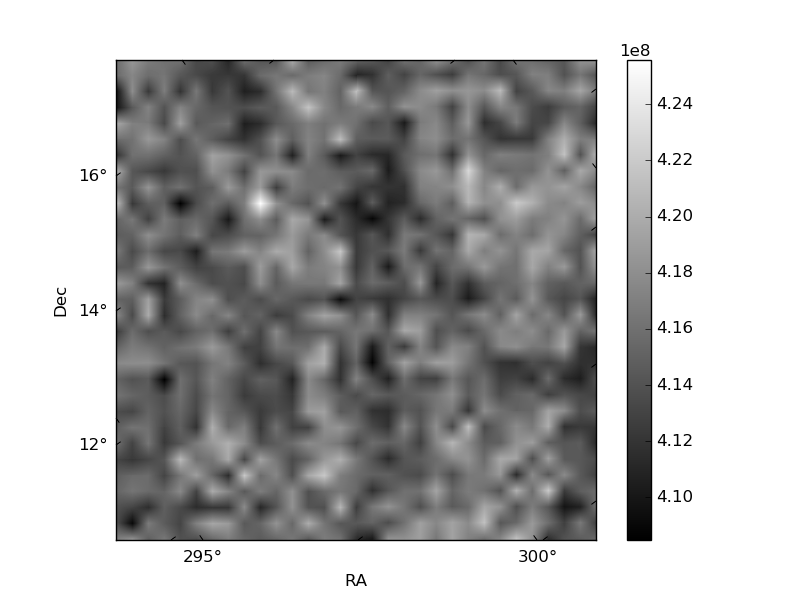
Histogram calculated using DETX and DETY for each event in the final _common_clean file
| Quadrant A | 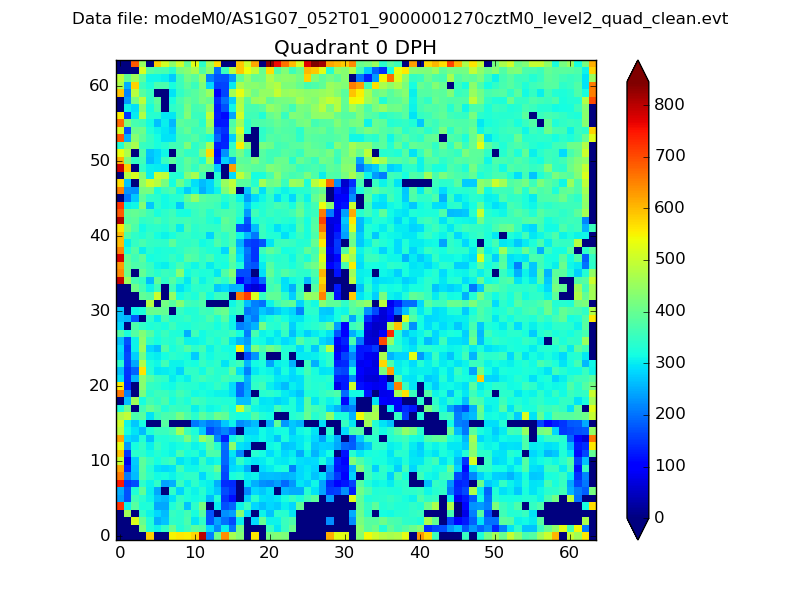 |
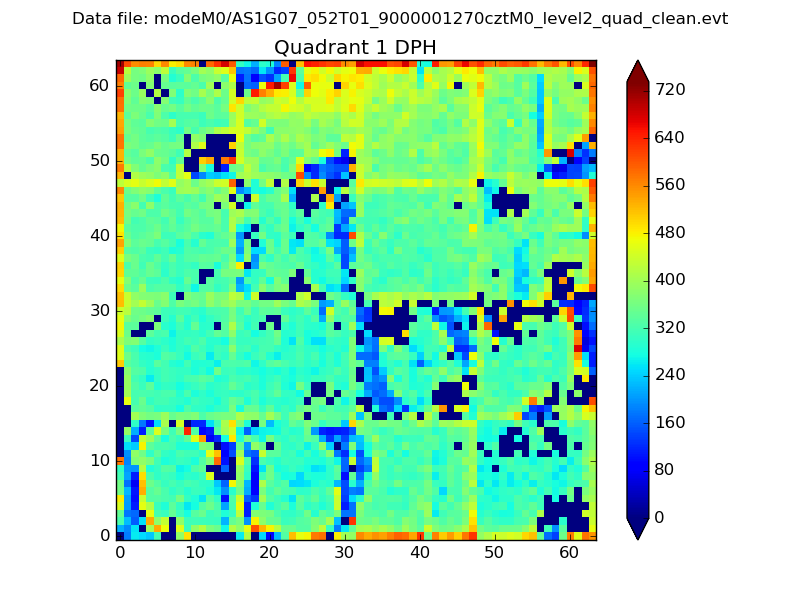 |
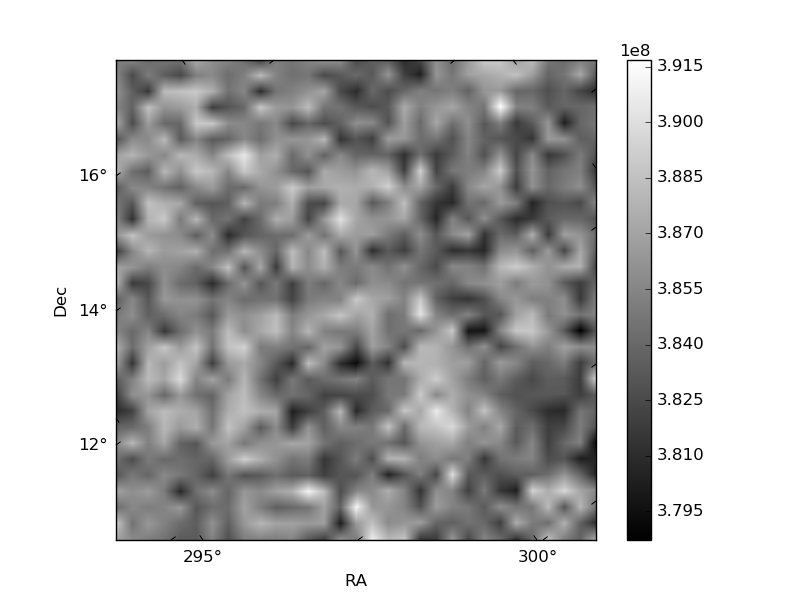
Quadrant B |
|---|---|---|---|
| Quadrant D | 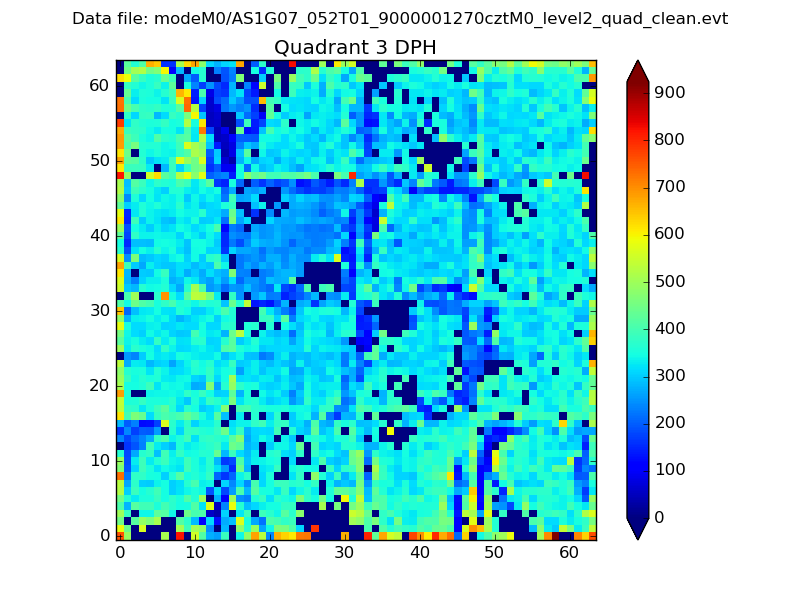 |
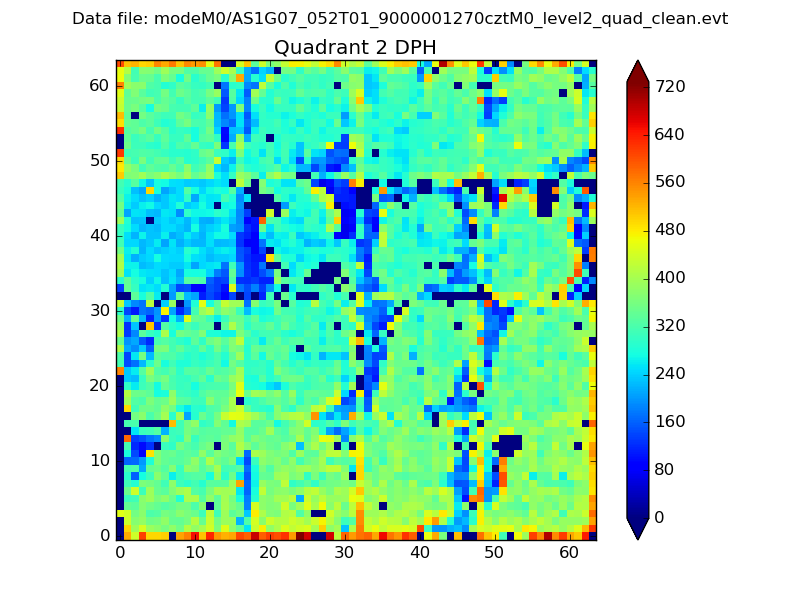 |
Quadrant C |
| Plot type | Count rate plots | Images |
|---|---|---|
| Comparison with Poisson distribution Blue bars denote a histogram of data divided into 1 sec bins. Red curve is a Poisson curve with rate = median count rate of data. |
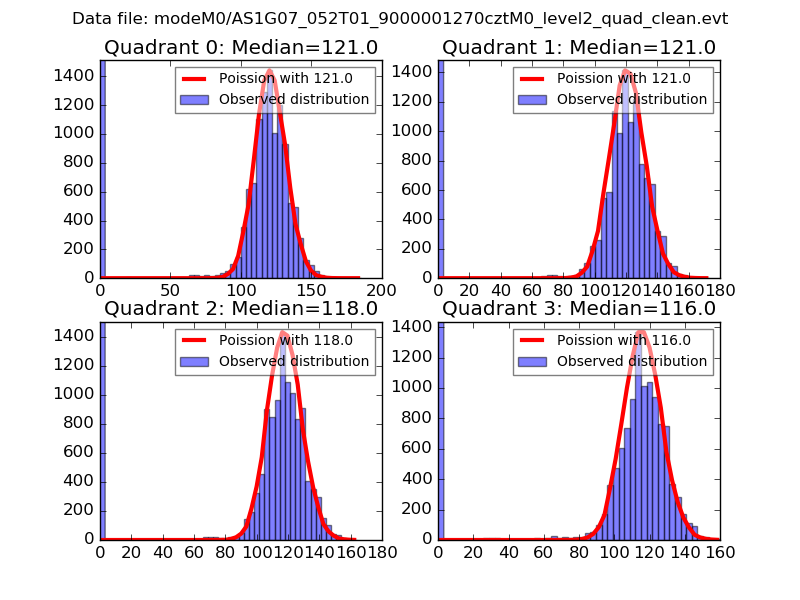 |
 |
| Quadrant-wise count rates Data is divided into 100 sec bins |
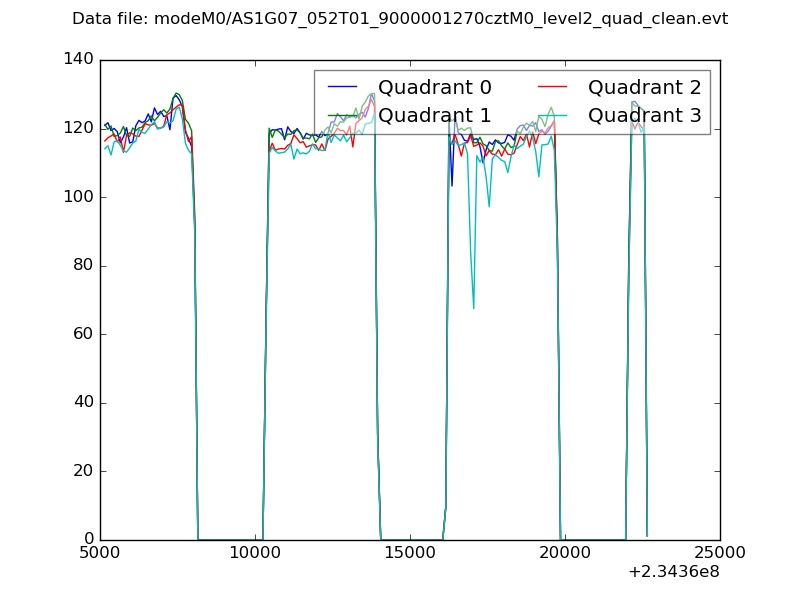 |
|
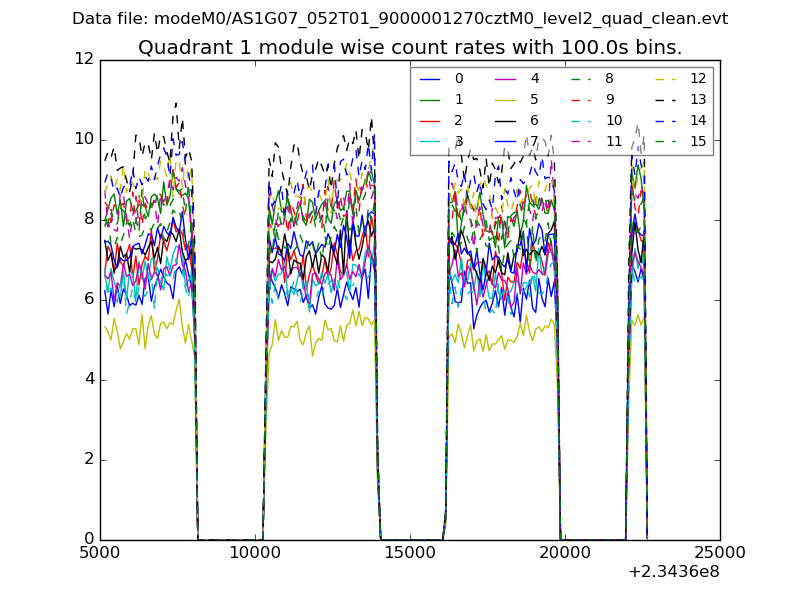
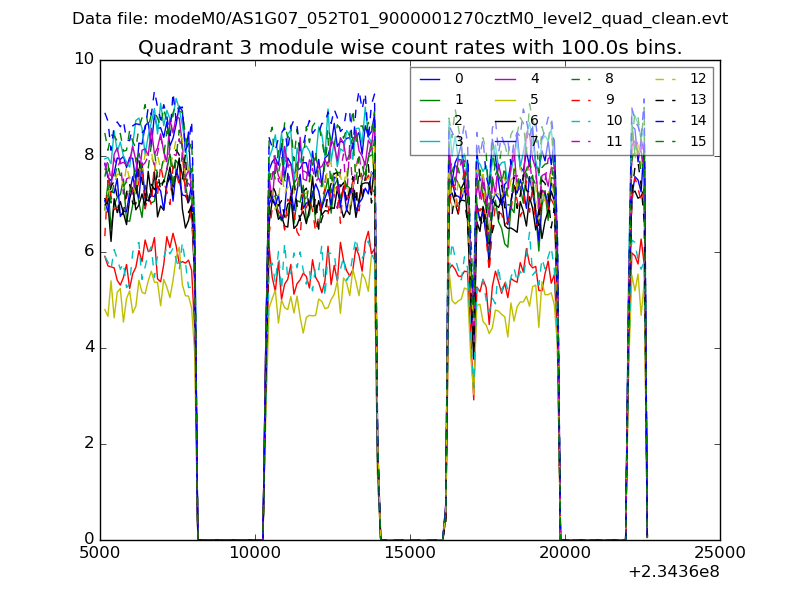
| Module-wise count rates for Quadrant A Data is divided into 100 sec bins |
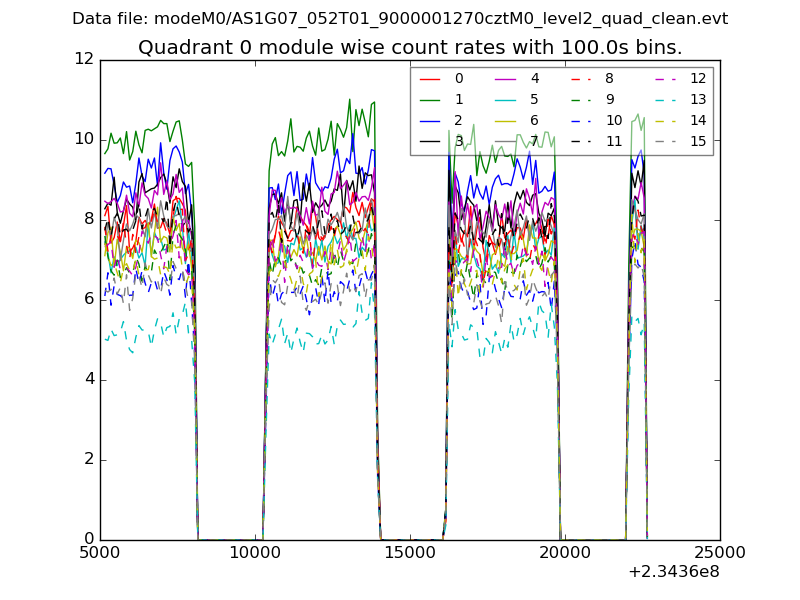 |
 |
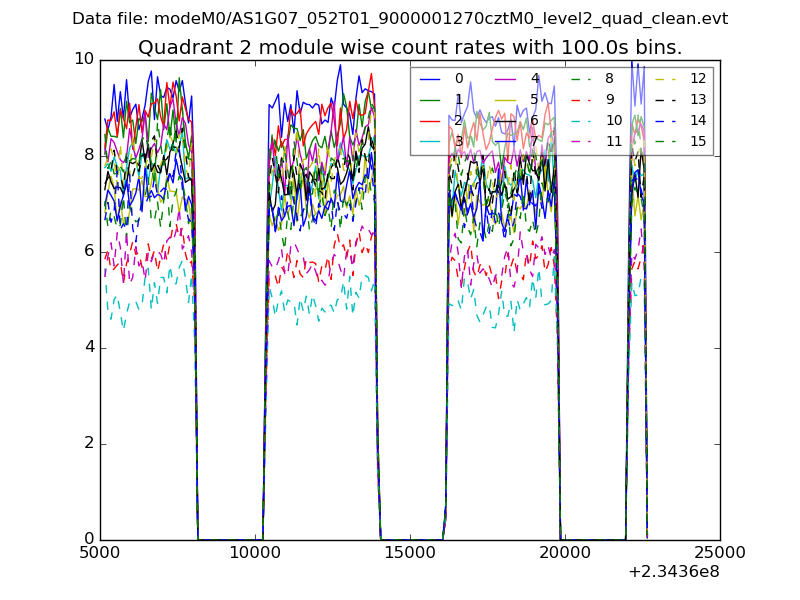
| Module-wise count rates for Quadrant B Data is divided into 100 sec bins |
 |
 |
| Module-wise count rates for Quadrant C Data is divided into 100 sec bins |
 |
 |
| Module-wise count rates for Quadrant D Data is divided into 100 sec bins |
 |
 |
| Parameter | Plot |
|---|---|
| CZT HV Monitor | 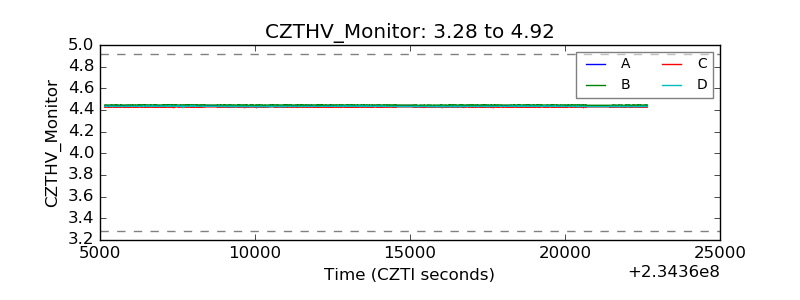 |
| D_VDD | 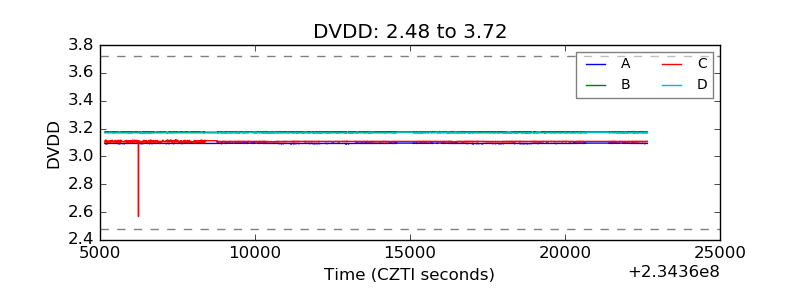 |
| Temperature 1 | 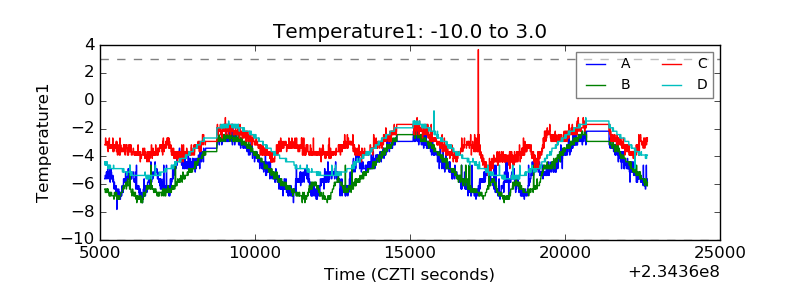 |
| Veto HV Monitor | 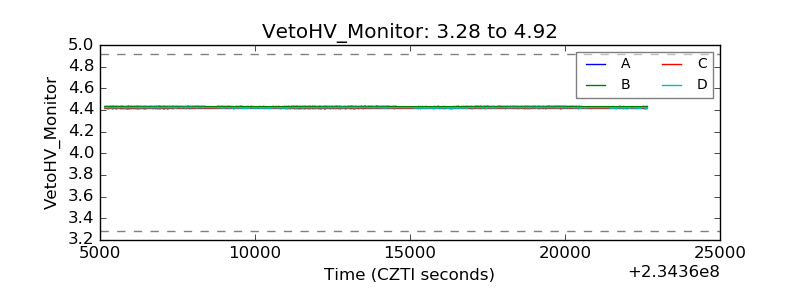 |
| Veto LLD | 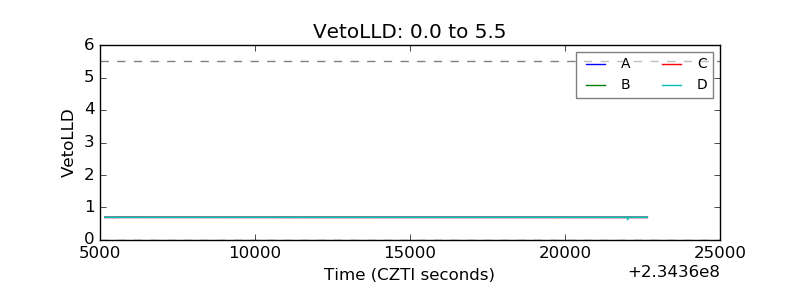 |
| Alpha Counter | 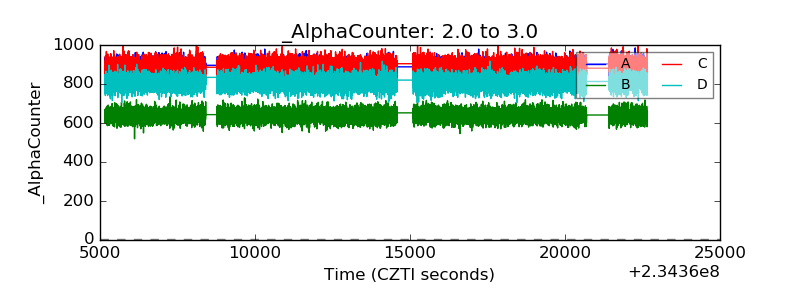 |
| _CPM_Rate | 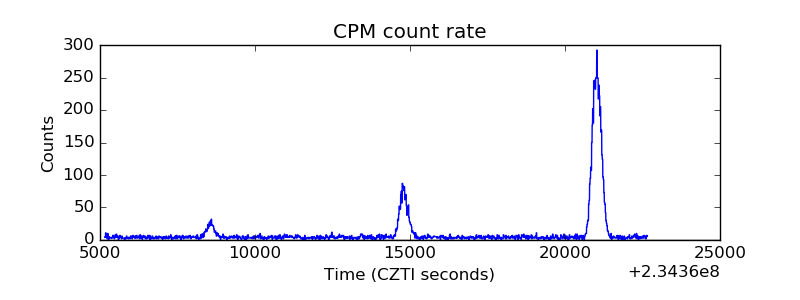 |
| CZT Counter | 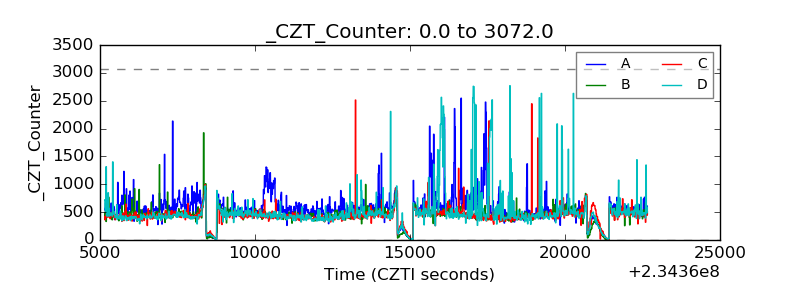 |
| +2.5 Volts monitor | 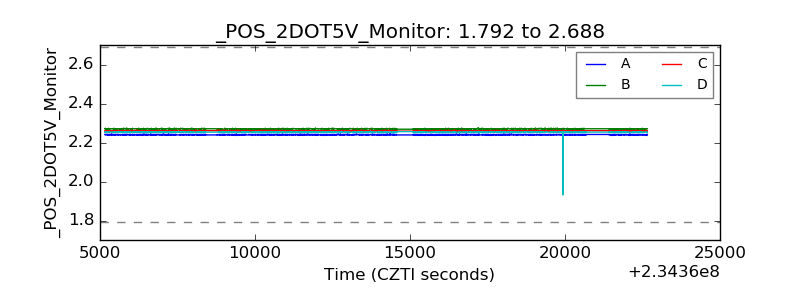 |
| +5 Volts monitor | 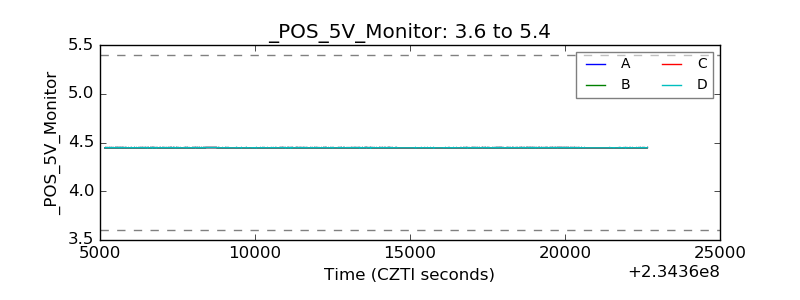 |
| _ROLL_ROT | 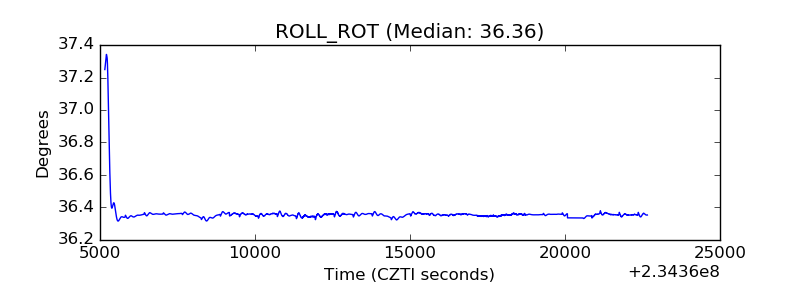 |
| _Roll_DEC | 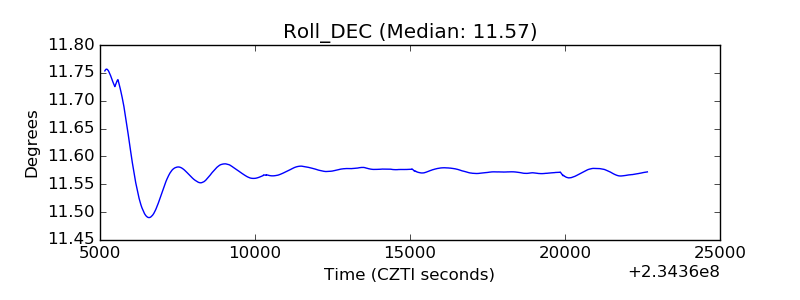 |
| _Roll_RA | 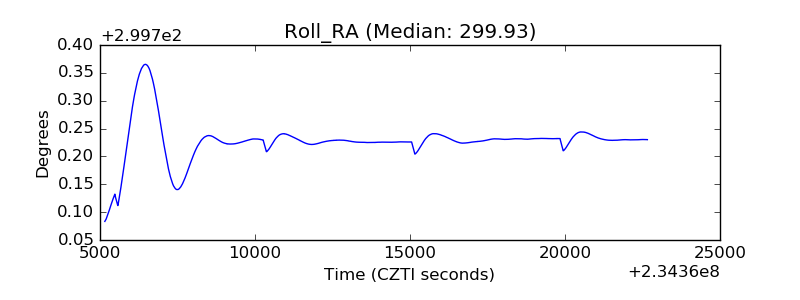 |
| Veto Counter | 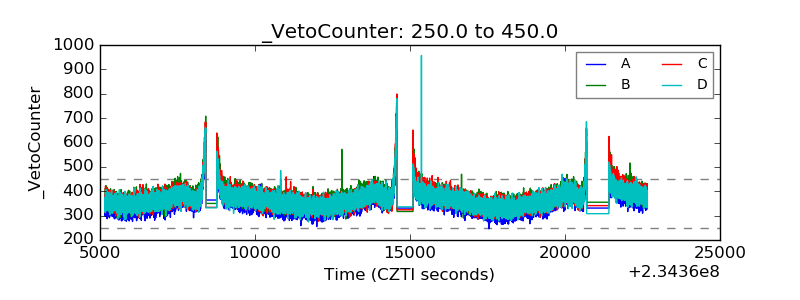 |