| Param | Original file | Final file |
|---|---|---|
| Filename | modeM0/AS1A03_033T01_9000001276cztM0_level2.fits | modeM0/AS1A03_033T01_9000001276cztM0_level2_quad_clean.evt |
| Size (bytes) | 155,188,800 | 164,557,440 |
| Size | 148.0 MB | 156.9 MB |
| Events in quadrant A | 915,580 | 1,003,748 |
| Events in quadrant B | 889,208 | 990,122 |
| Events in quadrant C | 913,408 | 950,069 |
| Events in quadrant D | 778,896 | 836,747 |
| Mode M0 | |||
|---|---|---|---|
| Quadrant | BADHDUFLAG | Total packets | Discarded packets |
| A | 0 | 42118 | 0 |
| B | 0 | 36839 | 0 |
| C | 0 | 35508 | 0 |
| D | 0 | 46068 | 0 |
| Mode SS | |||
|---|---|---|---|
| Quadrant | BADHDUFLAG | Total packets | Discarded packets |
| A | 0 | 352 | 0 |
| B | 0 | 352 | 0 |
| C | 0 | 352 | 0 |
| D | 0 | 352 | 0 |
| Mode M9 | |||
|---|---|---|---|
| Quadrant | BADHDUFLAG | Total packets | Discarded packets |
| A | 0 | 25 | 0 |
| B | 0 | 25 | 0 |
| C | 0 | 25 | 0 |
| D | 0 | 25 | 0 |
| Quadrant | Total seconds | Saturated seconds | Saturation percentage |
|---|---|---|---|
| A | 17448 | 259 | 1.484411% |
| B | 17453 | 177 | 1.014152% |
| C | 17454 | 123 | 0.704710% |
| D | 17453 | 1159 | 6.640692% |
Noise dominated data is calculated using 1-second bins in cleaned event files. If a bin has >2000 counts, and if more than 50% of those come from <1% of pixels, then it is considered to be noise-dominated and hence unusable.
| Quadrant | # 1 sec bins | Bins with >0 counts | Bins with >2000 counts | High rate bins dominated by noise | Noise dominated (total time) | Noise dominated (detector-on time) | Marked lightcurve |
|---|---|---|---|---|---|---|---|
| A | 19776 | 17451 | 0 | 0 | 0.00% | 0.00% | 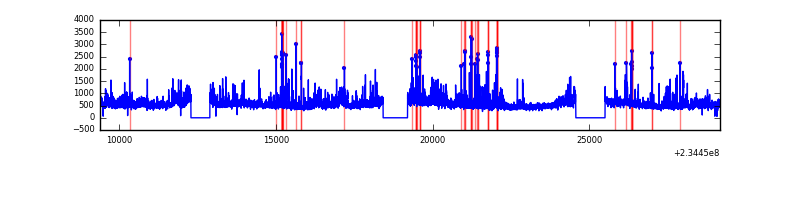 |
| B | 19776 | 17453 | 0 | 0 | 0.00% | 0.00% | 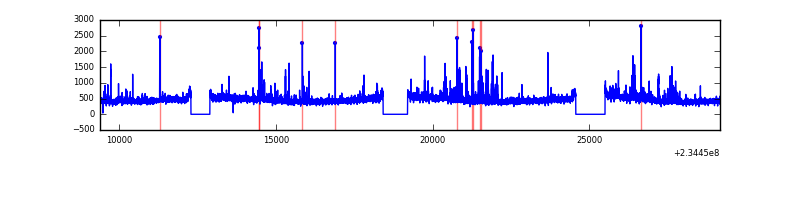 |
| C | 19776 | 17453 | 0 | 0 | 0.00% | 0.00% |  |
| D | 19776 | 17449 | 0 | 0 | 0.00% | 0.00% | 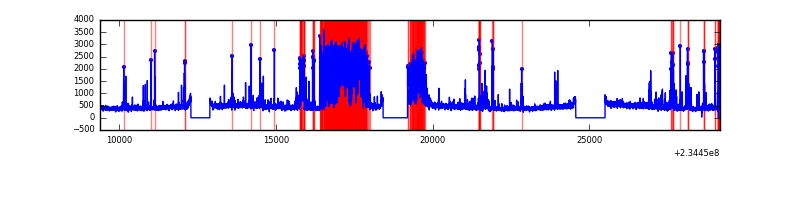 |
Top three noisy pixels from each quadrant. If the there are fewer than three noisy pixels in the level2.evt file, extra rows are filled as -1
| Pixel properties | Quadrant properties | ||||||
|---|---|---|---|---|---|---|---|
| Quadrant | DetID | PixID | Counts | Sigma | Mean | Median | Sigma |
| A | 0 | 29 | 961 | 11.81 | 238 | 223 | 62.5 |
| A | 7 | 110 | 785 | 8.99 | 238 | 223 | 62.5 |
| A | 0 | 30 | 756 | 8.53 | 238 | 223 | 62.5 |
| B | 2 | 9 | 783 | 11.42 | 235 | 223 | 49.0 |
| B | 3 | 17 | 646 | 8.62 | 235 | 223 | 49.0 |
| B | 14 | 254 | 610 | 7.89 | 235 | 223 | 49.0 |
| C | 3 | 158 | 666 | 6.83 | 241 | 222 | 65.0 |
| C | 2 | 191 | 657 | 6.69 | 241 | 222 | 65.0 |
| C | 12 | 241 | 634 | 6.34 | 241 | 222 | 65.0 |
| D | 3 | 14 | 592 | 6.41 | 221 | 202 | 60.9 |
| D | 6 | 67 | 567 | 6.0 | 221 | 202 | 60.9 |
| D | 1 | 19 | 563 | 5.93 | 221 | 202 | 60.9 |
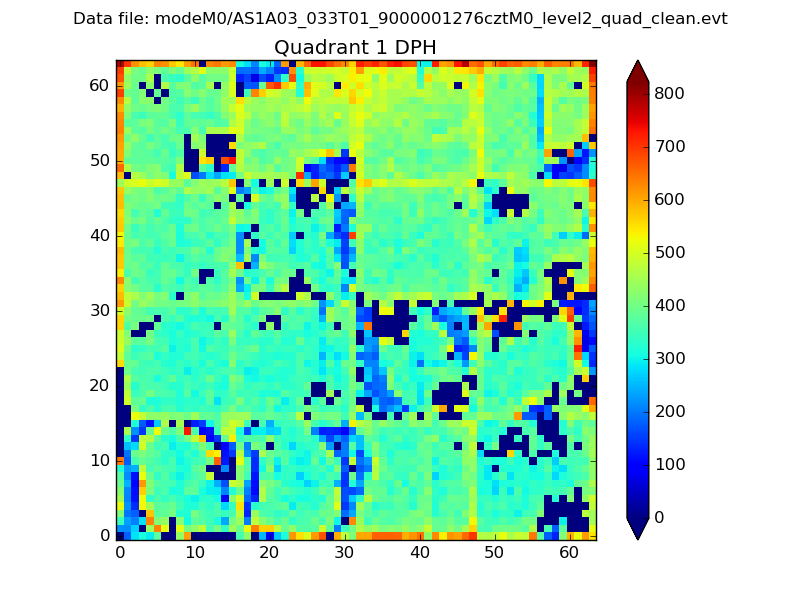
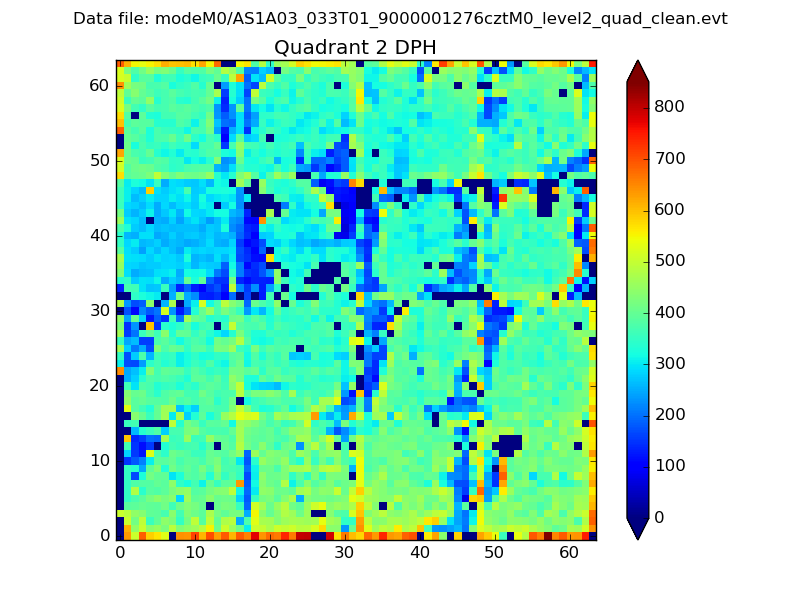
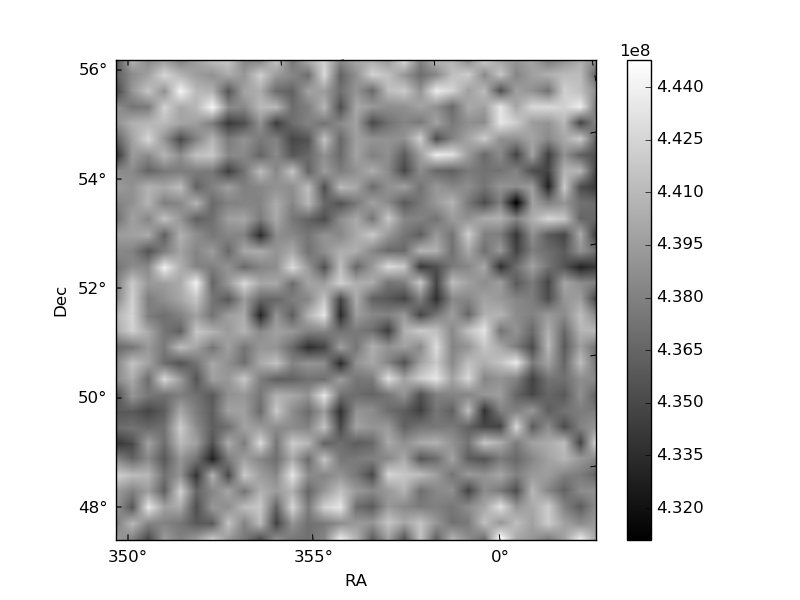
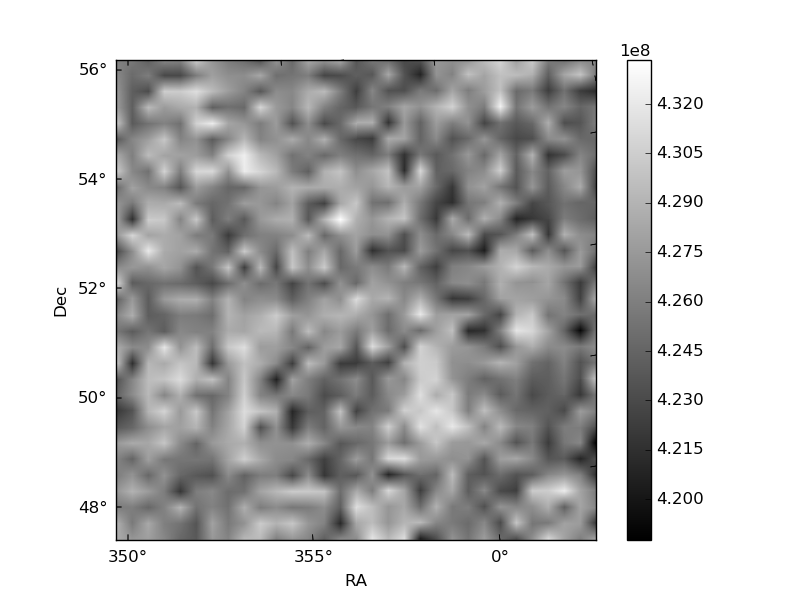
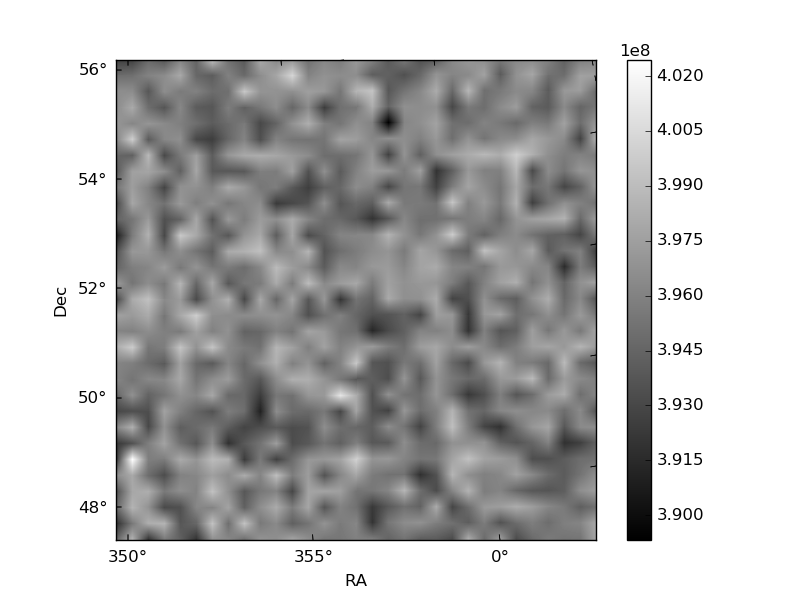
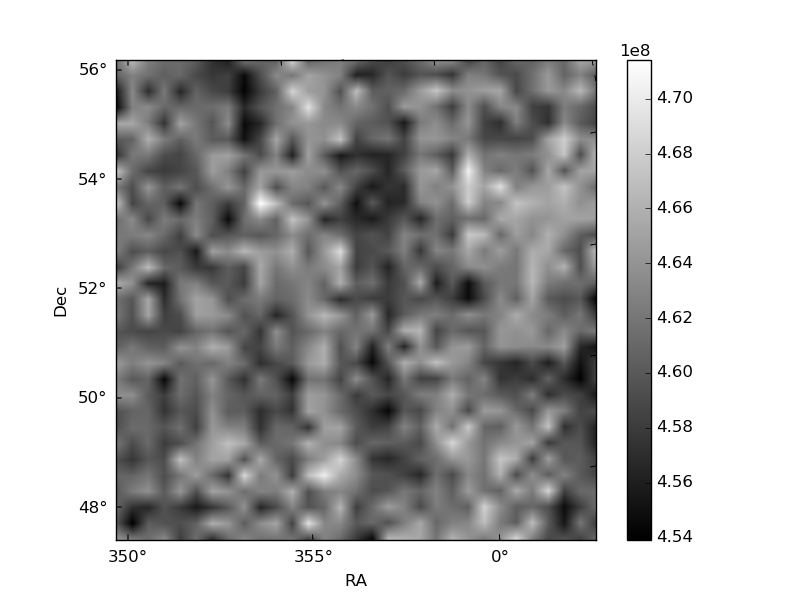
Histogram calculated using DETX and DETY for each event in the final _common_clean file
| Quadrant A | 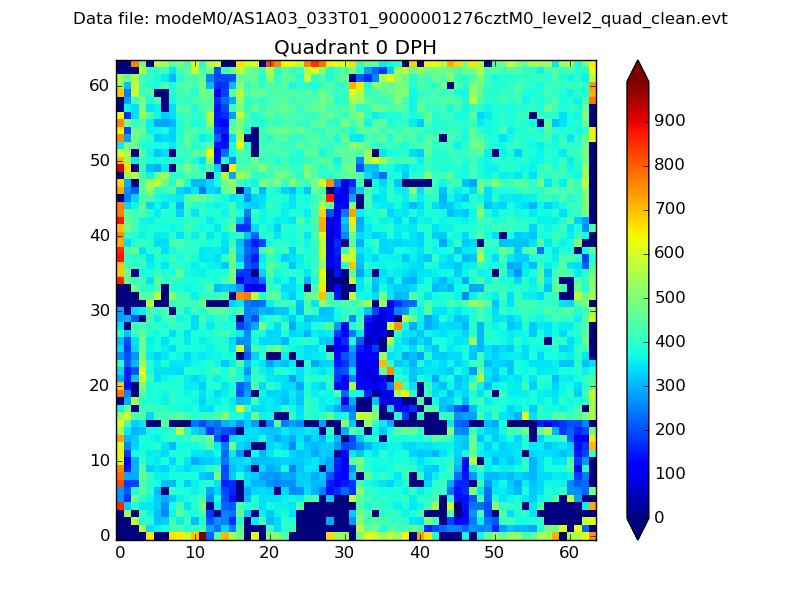 |
 |
Quadrant B |
|---|---|---|---|
| Quadrant D | 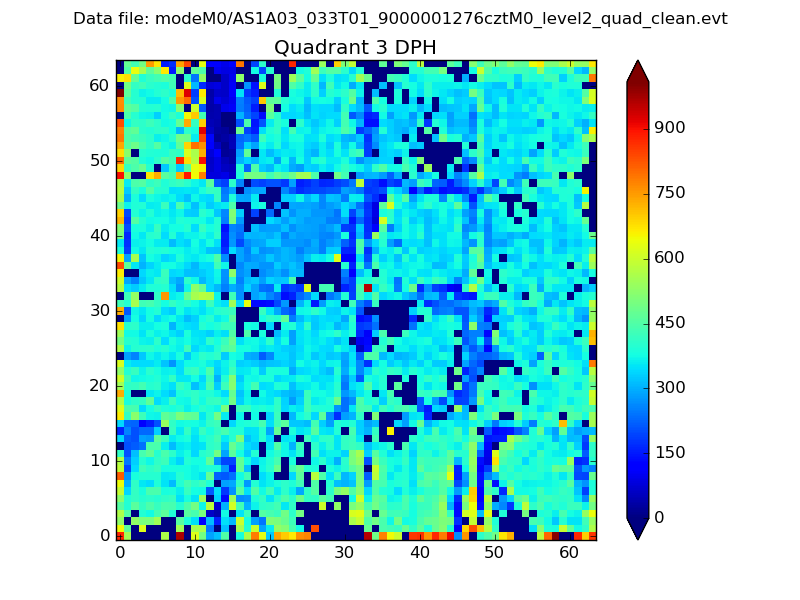 |
 |
Quadrant C |
| Plot type | Count rate plots | Images |
|---|---|---|
| Comparison with Poisson distribution Blue bars denote a histogram of data divided into 1 sec bins. Red curve is a Poisson curve with rate = median count rate of data. |
 |
 |
| Quadrant-wise count rates Data is divided into 100 sec bins |
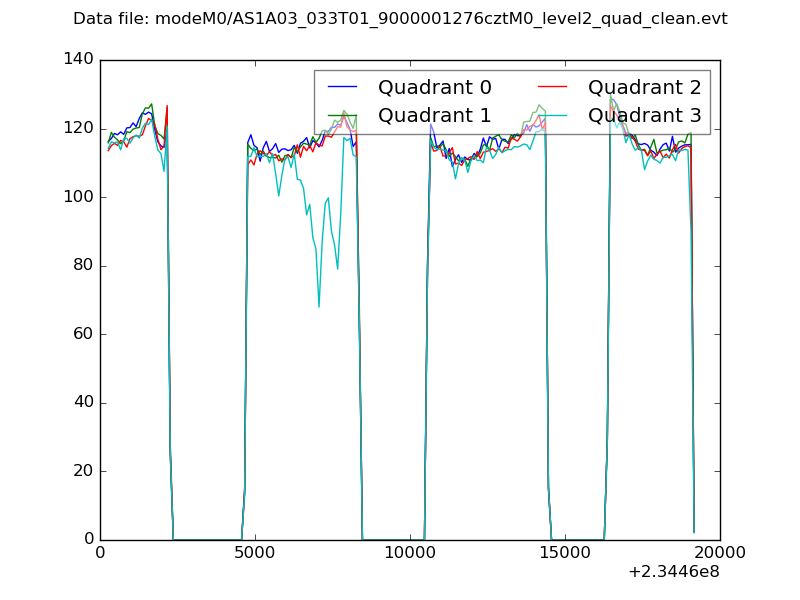 |
|
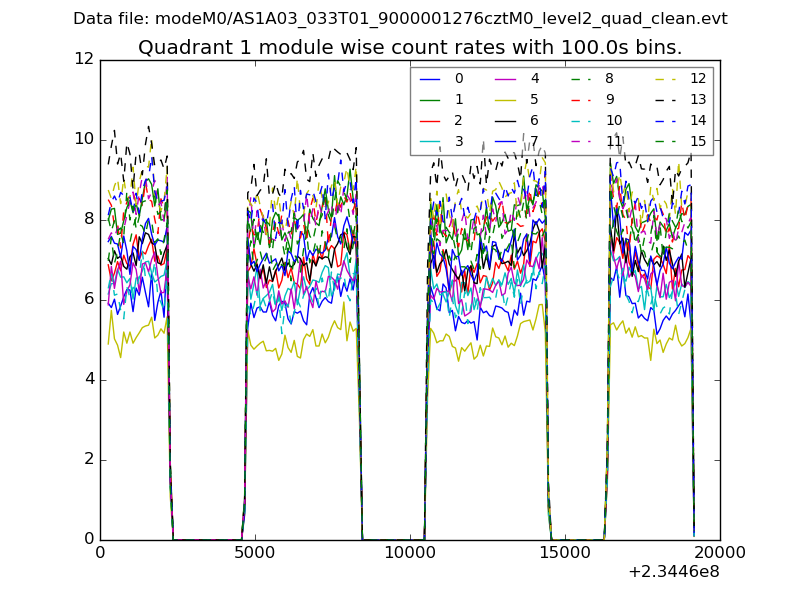
| Module-wise count rates for Quadrant A Data is divided into 100 sec bins |
 |
 |
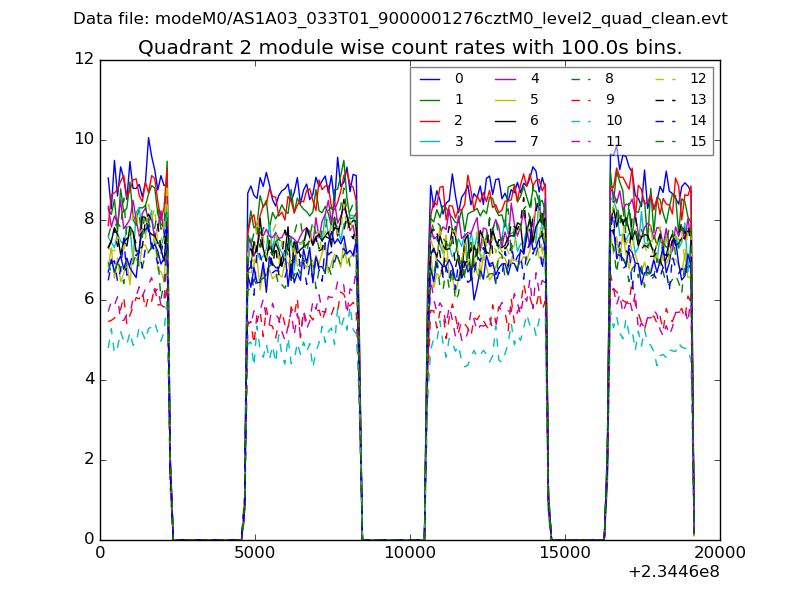
| Module-wise count rates for Quadrant B Data is divided into 100 sec bins |
 |
 |
| Module-wise count rates for Quadrant C Data is divided into 100 sec bins |
 |
 |
| Module-wise count rates for Quadrant D Data is divided into 100 sec bins |
 |
 |
| Parameter | Plot |
|---|---|
| CZT HV Monitor | 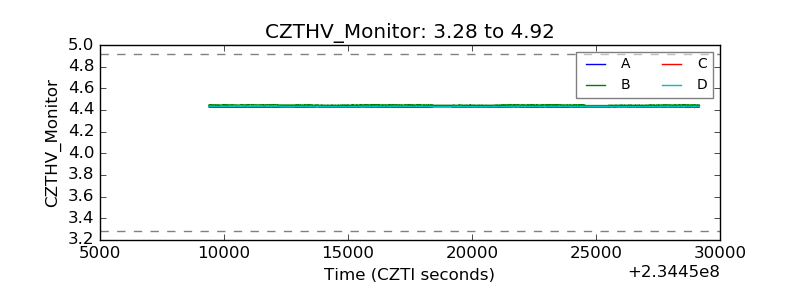 |
| D_VDD | 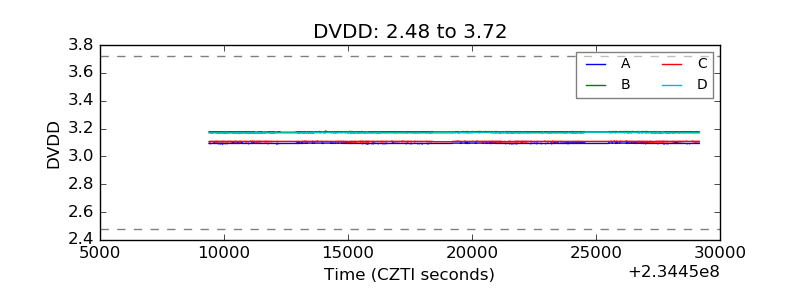 |
| Temperature 1 |  |
| Veto HV Monitor |  |
| Veto LLD | 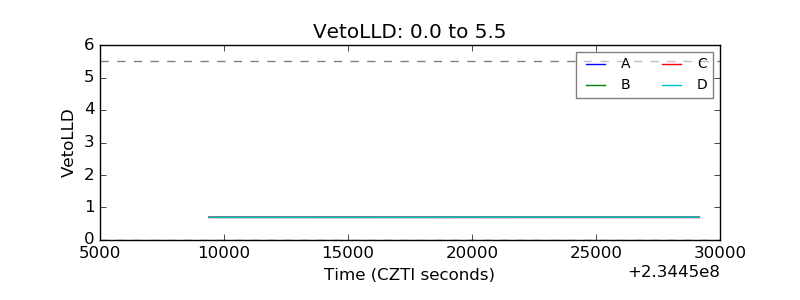 |
| Alpha Counter | 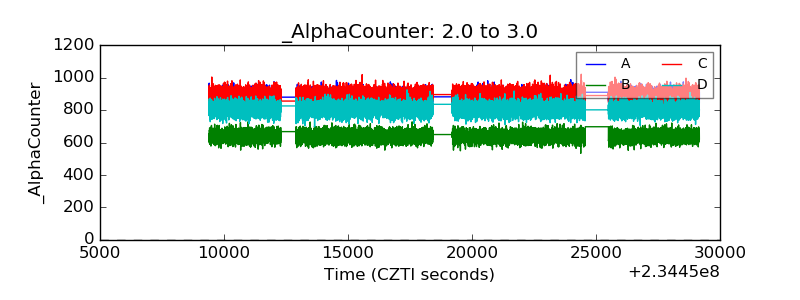 |
| _CPM_Rate | 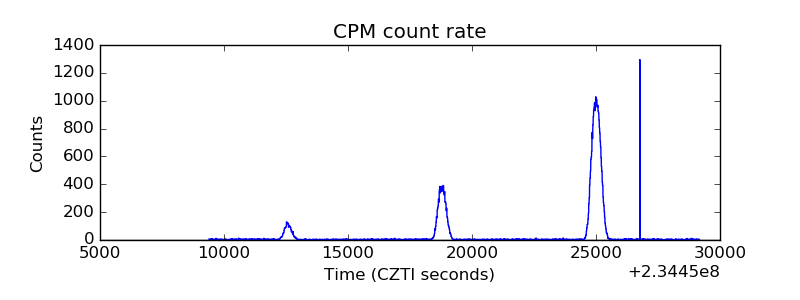 |
| CZT Counter | 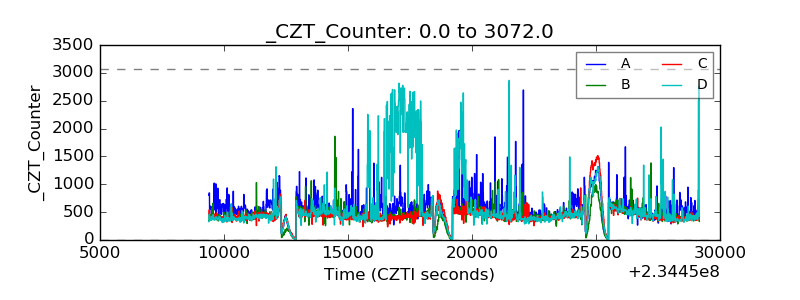 |
| +2.5 Volts monitor | 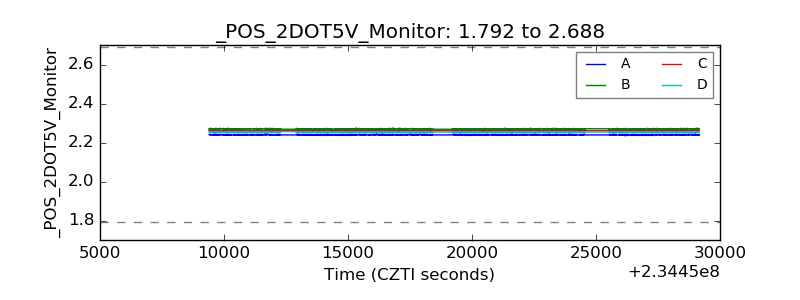 |
| +5 Volts monitor | 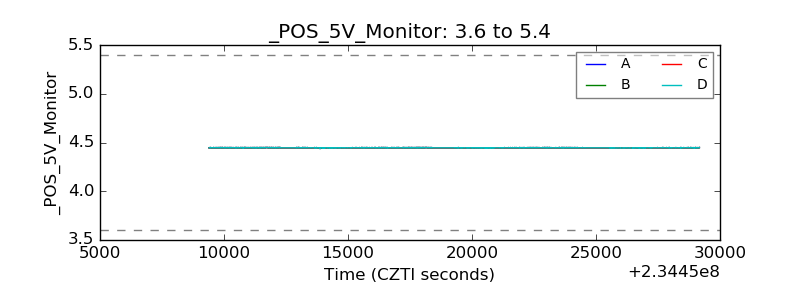 |
| _ROLL_ROT | 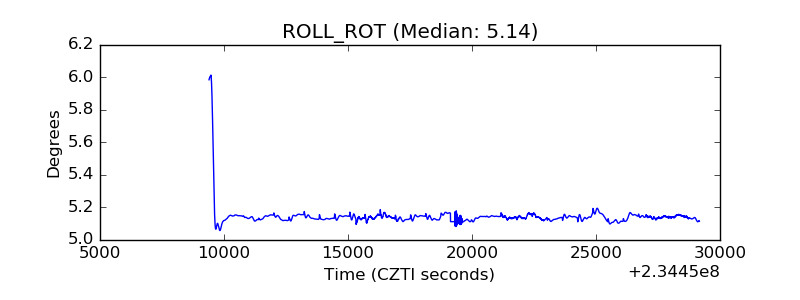 |
| _Roll_DEC | 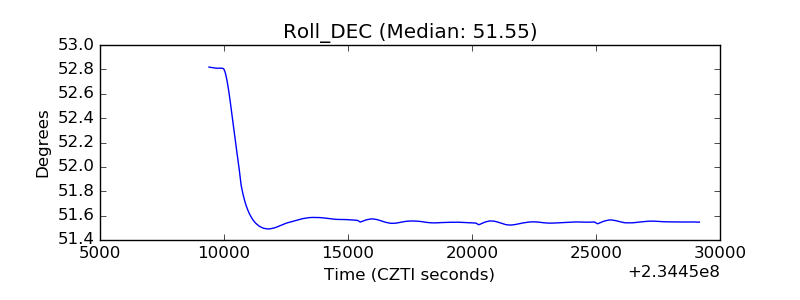 |
| _Roll_RA | 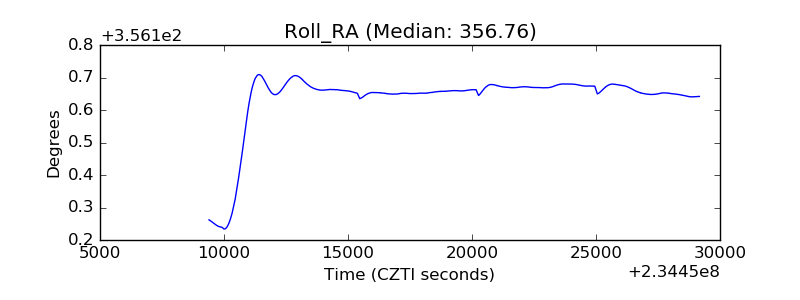 |
| Veto Counter | 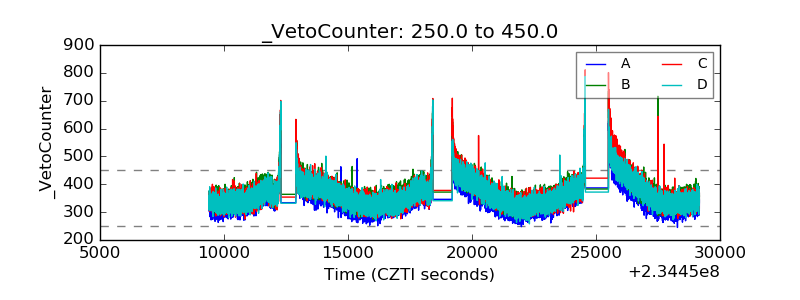 |