| Param | Original file | Final file |
|---|---|---|
| Filename | modeM0/AS1A03_033T01_9000001276_09141cztM0_level2.evt | modeM0/AS1A03_033T01_9000001276_09141cztM0_level2_quad_clean.evt |
| Size (bytes) | 768,646,080 | 120,983,040 |
| Size | 733.0 MB | 115.4 MB |
| Events in quadrant A | 5,988,843 | 759,903 |
| Events in quadrant B | 4,711,576 | 761,171 |
| Events in quadrant C | 4,340,410 | 750,434 |
| Events in quadrant D | 7,570,401 | 709,058 |
| Mode M0 | |||
|---|---|---|---|
| Quadrant | BADHDUFLAG | Total packets | Discarded packets |
| A | 0 | 24293 | 16 |
| B | 0 | 20604 | 8 |
| C | 0 | 19986 | 2 |
| D | 0 | 29471 | 2 |
| Mode SS | |||
|---|---|---|---|
| Quadrant | BADHDUFLAG | Total packets | Discarded packets |
| A | 0 | 200 | 0 |
| B | 0 | 200 | 0 |
| C | 0 | 200 | 0 |
| D | 0 | 200 | 0 |
| Mode M9 | |||
|---|---|---|---|
| Quadrant | BADHDUFLAG | Total packets | Discarded packets |
| A | 0 | 15 | 0 |
| B | 0 | 15 | 0 |
| C | 0 | 15 | 0 |
| D | 0 | 15 | 0 |
| Quadrant | Total seconds | Saturated seconds | Saturation percentage |
|---|---|---|---|
| A | 9854 | 164 | 1.664299% |
| B | 9856 | 106 | 1.075487% |
| C | 9859 | 71 | 0.720154% |
| D | 9859 | 1062 | 10.771884% |
Noise dominated data is calculated using 1-second bins in cleaned event files. If a bin has >2000 counts, and if more than 50% of those come from <1% of pixels, then it is considered to be noise-dominated and hence unusable.
| Quadrant | # 1 sec bins | Bins with >0 counts | Bins with >2000 counts | High rate bins dominated by noise | Noise dominated (total time) | Noise dominated (detector-on time) | Marked lightcurve |
|---|---|---|---|---|---|---|---|
| A | 11244 | 9859 | 25 | 25 | 0.22% | 0.25% | 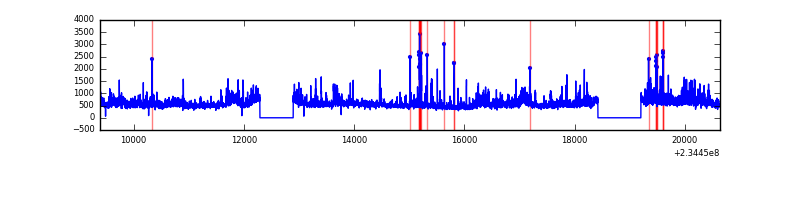 |
| B | 11244 | 9859 | 5 | 5 | 0.04% | 0.05% | 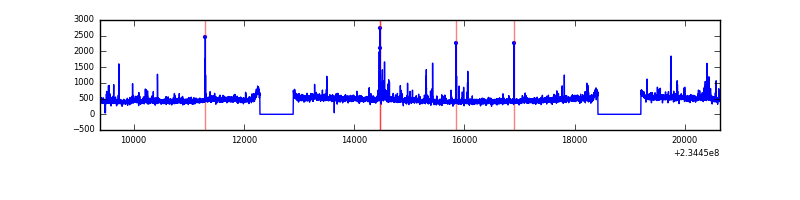 |
| C | 11244 | 9859 | 0 | 0 | 0.00% | 0.00% | 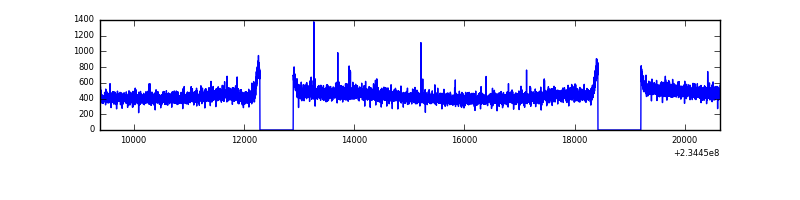 |
| D | 11244 | 9859 | 1008 | 1008 | 8.96% | 10.22% | 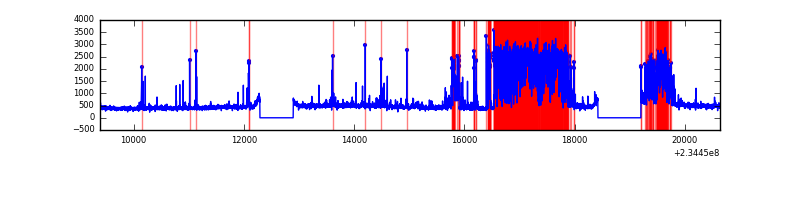 |
Top three noisy pixels from each quadrant. If the there are fewer than three noisy pixels in the level2.evt file, extra rows are filled as -1
| Pixel properties | Quadrant properties | ||||||
|---|---|---|---|---|---|---|---|
| Quadrant | DetID | PixID | Counts | Sigma | Mean | Median | Sigma |
| A | 8 | 5 | 1363352 | 5931.39 | 1140 | 1113 | 229.7 |
| A | 1 | 162 | 79347 | 340.64 | 1140 | 1113 | 229.7 |
| A | 13 | 251 | 43167 | 183.11 | 1140 | 1113 | 229.7 |
| B | 4 | 48 | 66831 | 302.56 | 1144 | 1117 | 217.2 |
| B | 4 | 80 | 39273 | 175.68 | 1144 | 1117 | 217.2 |
| B | 0 | 219 | 37898 | 169.35 | 1144 | 1117 | 217.2 |
| C | 9 | 68 | 18925 | 69.92 | 1104 | 1107 | 254.8 |
| C | 14 | 234 | 9540 | 33.09 | 1104 | 1107 | 254.8 |
| C | 13 | 61 | 8366 | 28.48 | 1104 | 1107 | 254.8 |
| D | 12 | 233 | 2810529 | 9857.44 | 1080 | 1052 | 285.0 |
| D | 2 | 14 | 361958 | 1266.29 | 1080 | 1052 | 285.0 |
| D | 8 | 195 | 101063 | 350.9 | 1080 | 1052 | 285.0 |
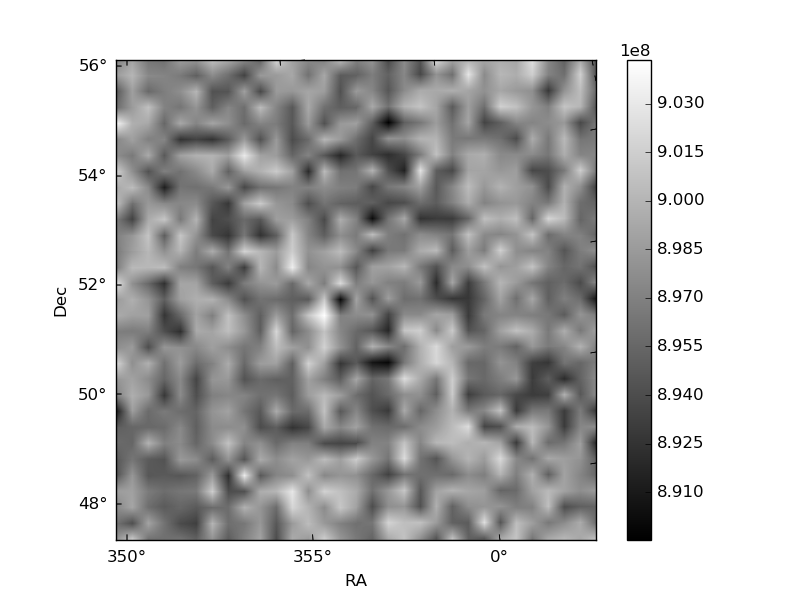
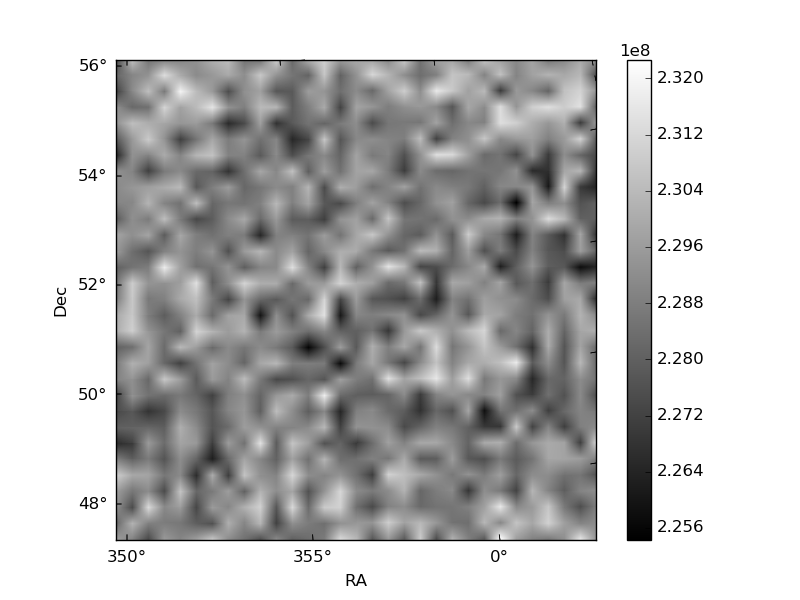
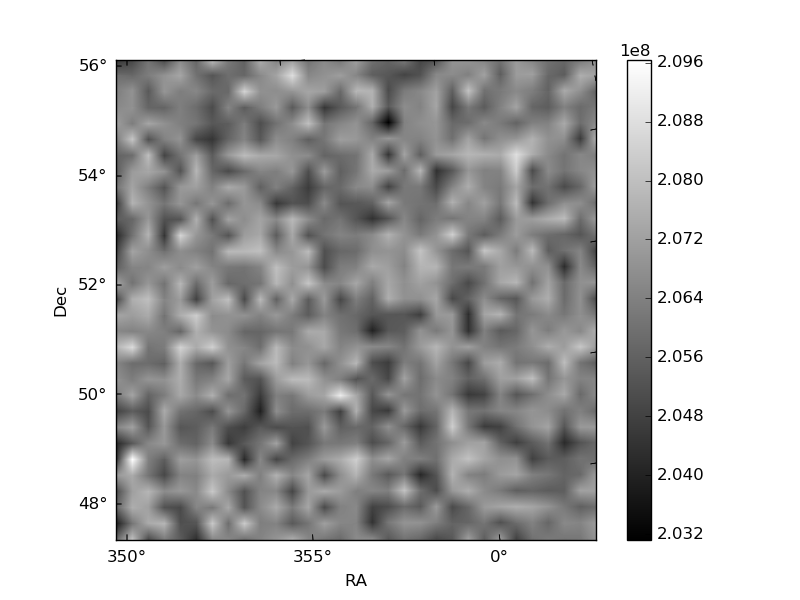
Histogram calculated using DETX and DETY for each event in the final _common_clean file
| Quadrant A | 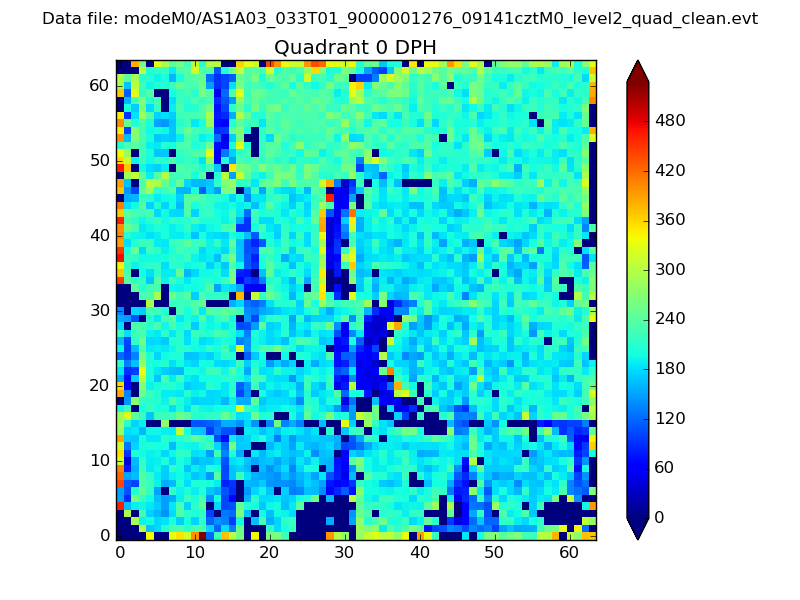 |
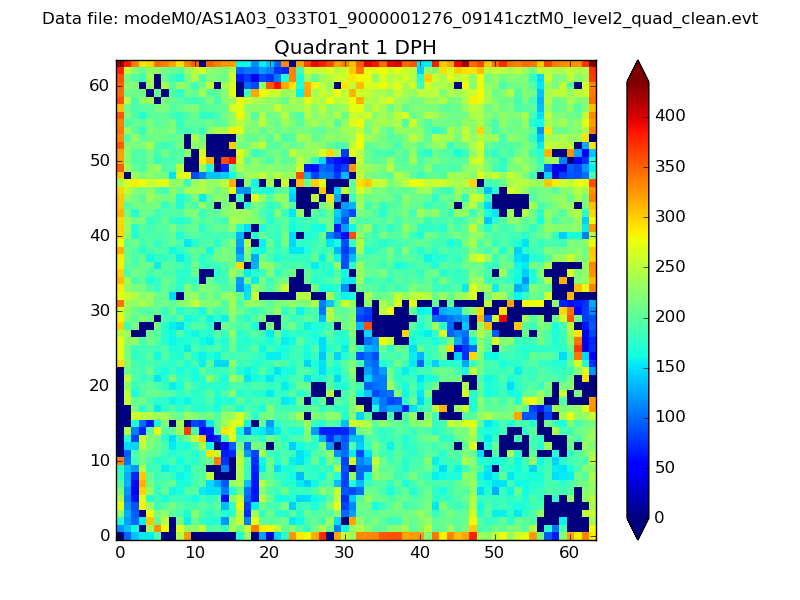 |
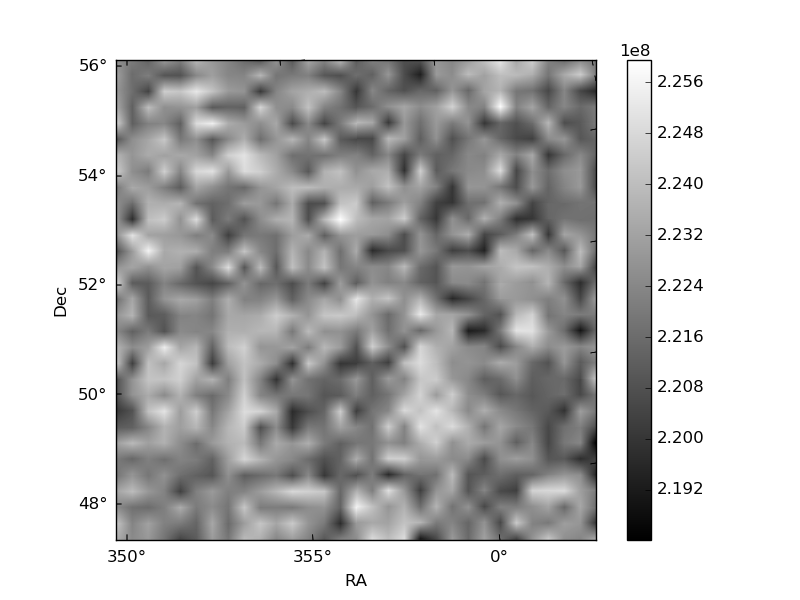
Quadrant B |
|---|---|---|---|
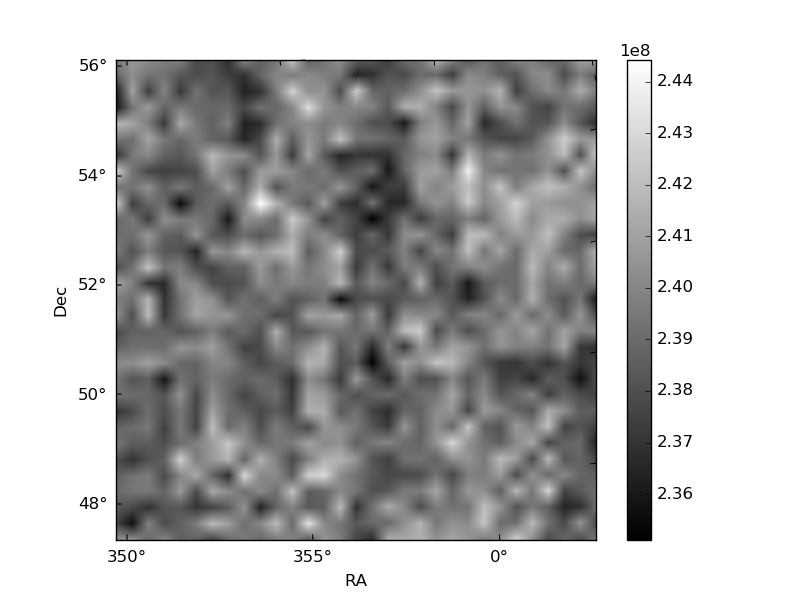
| Quadrant D | 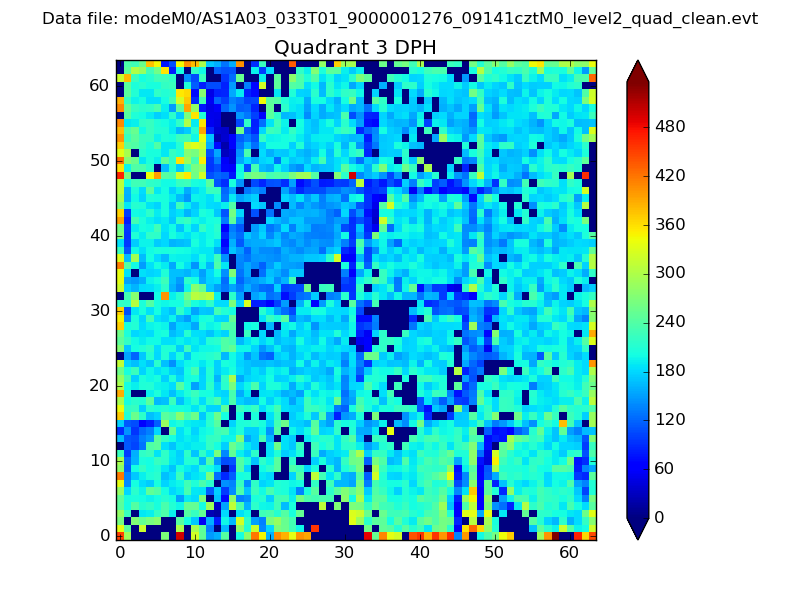 |
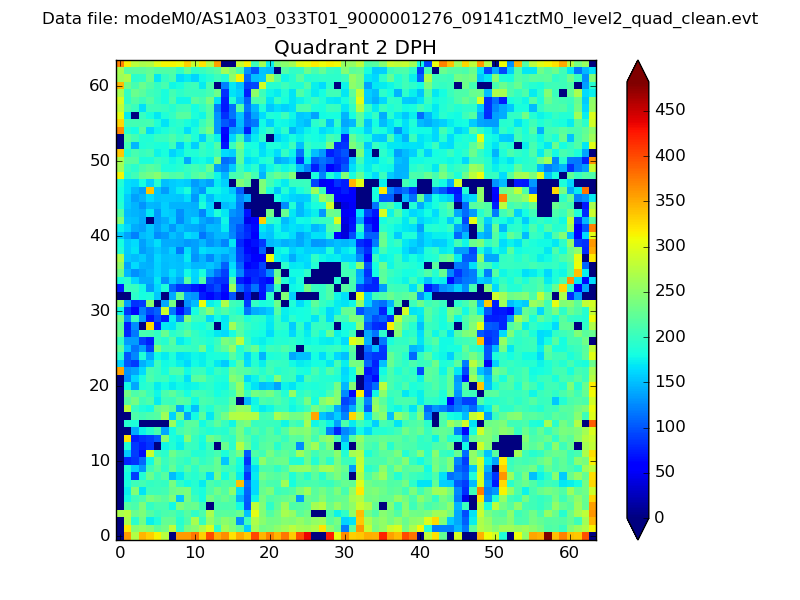 |
Quadrant C |
| Plot type | Count rate plots | Images |
|---|---|---|
| Comparison with Poisson distribution Blue bars denote a histogram of data divided into 1 sec bins. Red curve is a Poisson curve with rate = median count rate of data. |
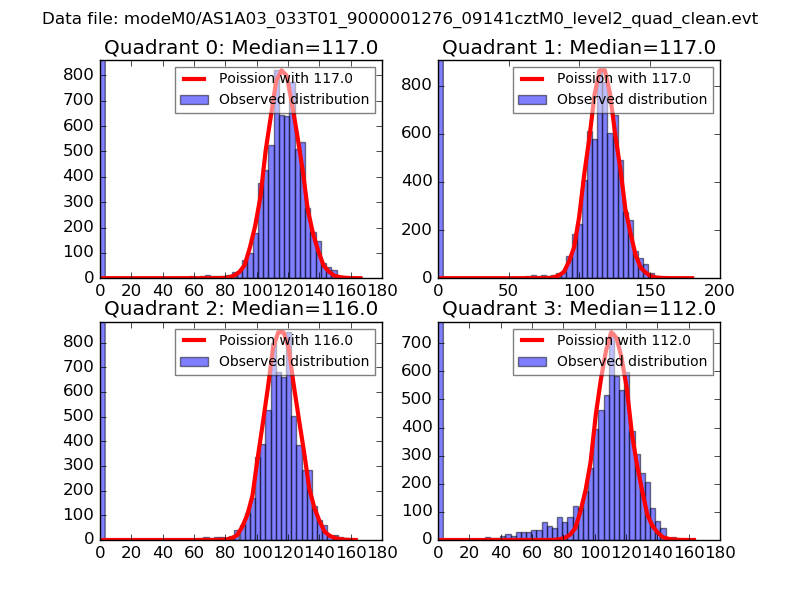 |
 |
| Quadrant-wise count rates Data is divided into 100 sec bins |
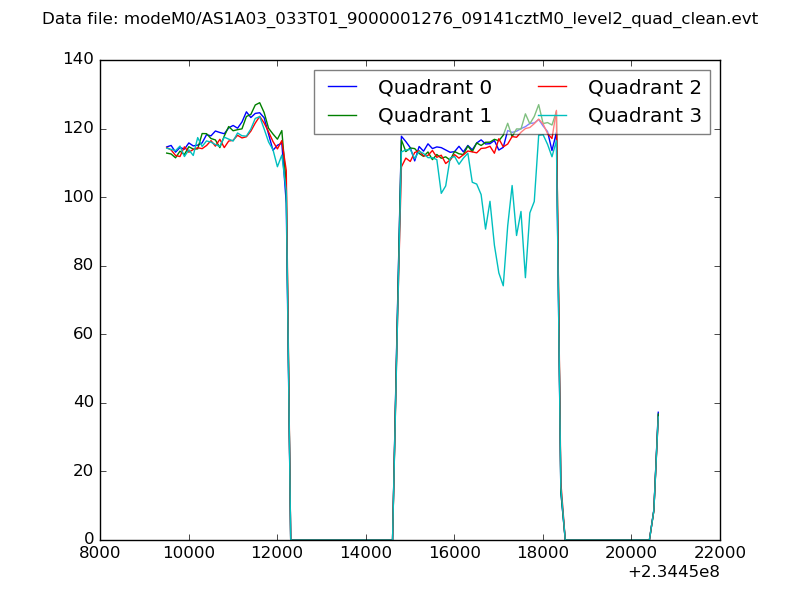 |
|
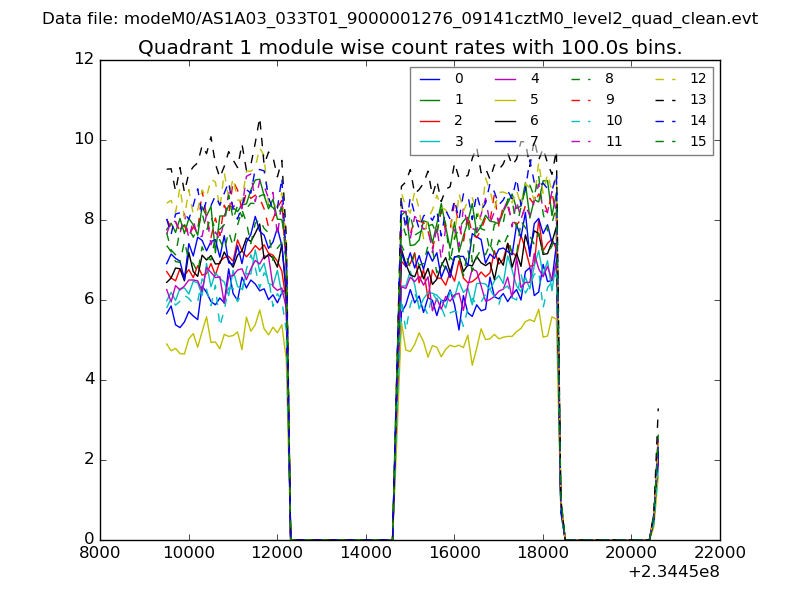
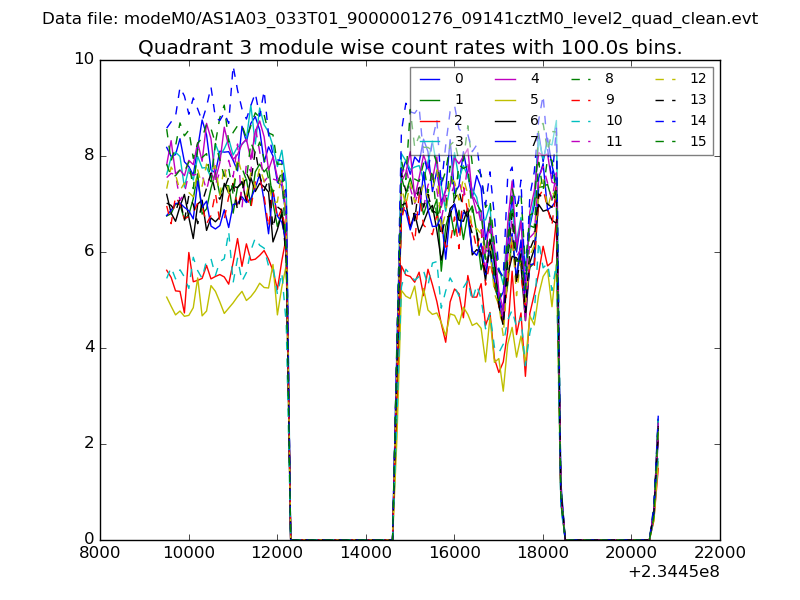
| Module-wise count rates for Quadrant A Data is divided into 100 sec bins |
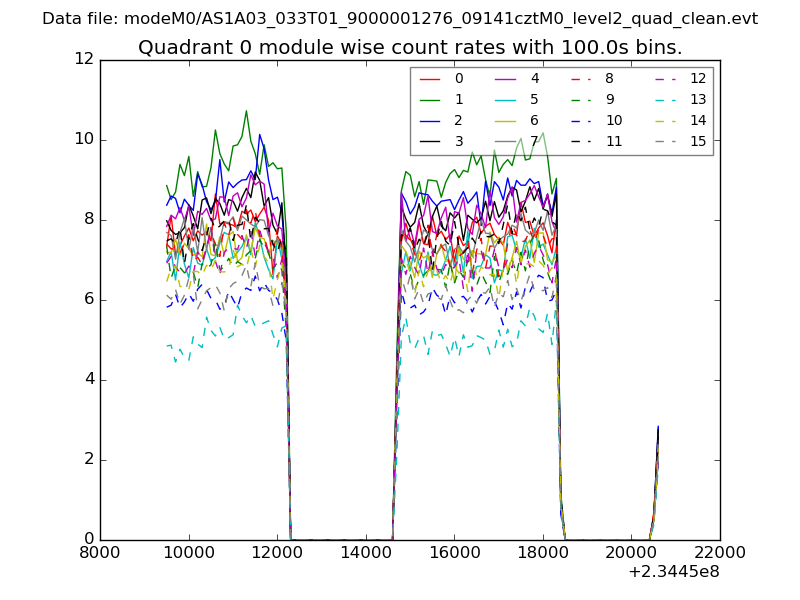 |
 |
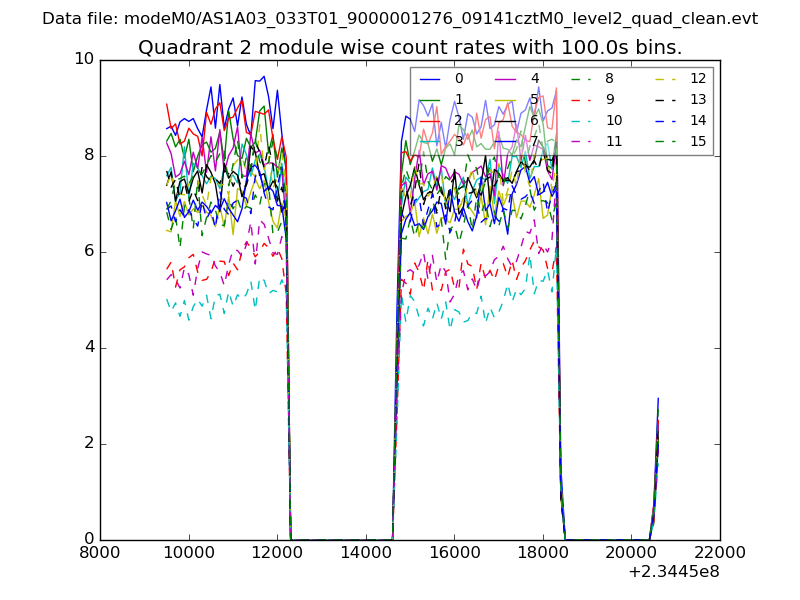
| Module-wise count rates for Quadrant B Data is divided into 100 sec bins |
 |
 |
| Module-wise count rates for Quadrant C Data is divided into 100 sec bins |
 |
 |
| Module-wise count rates for Quadrant D Data is divided into 100 sec bins |
 |
 |
| Parameter | Plot |
|---|---|
| CZT HV Monitor | 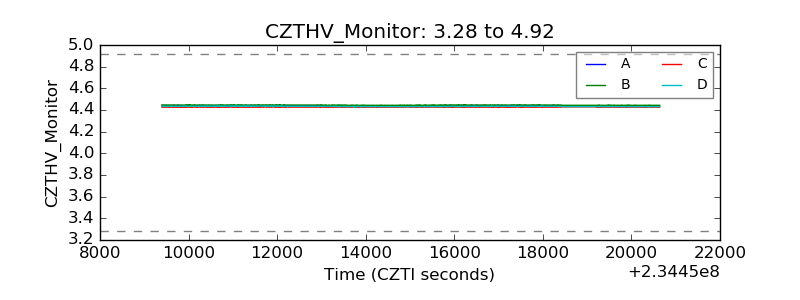 |
| D_VDD | 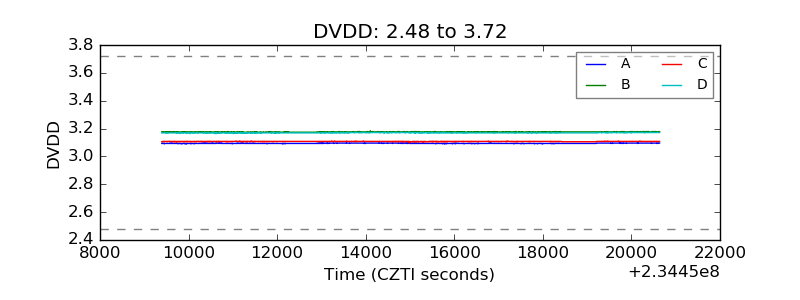 |
| Temperature 1 | 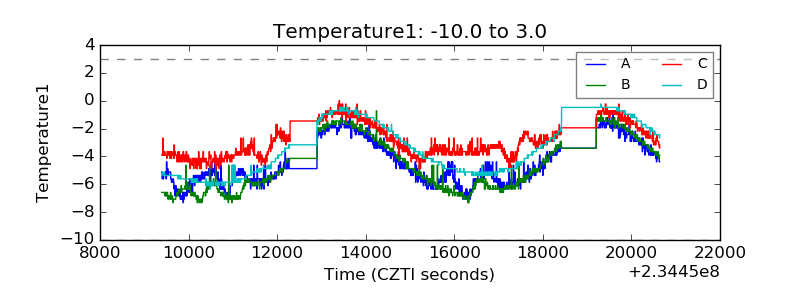 |
| Veto HV Monitor | 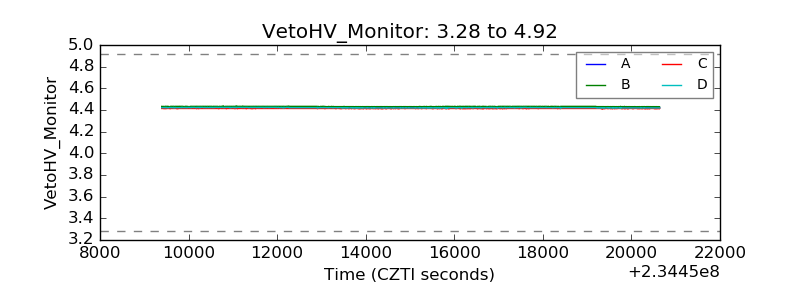 |
| Veto LLD | 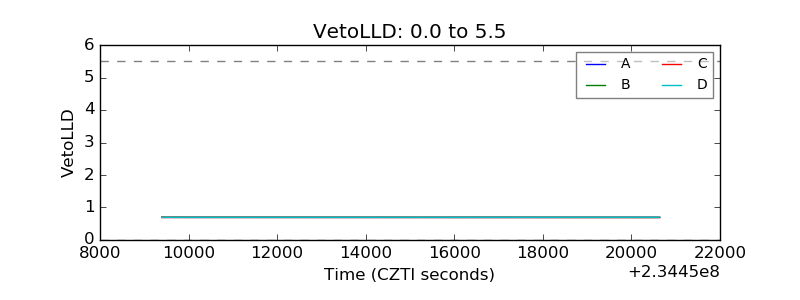 |
| Alpha Counter | 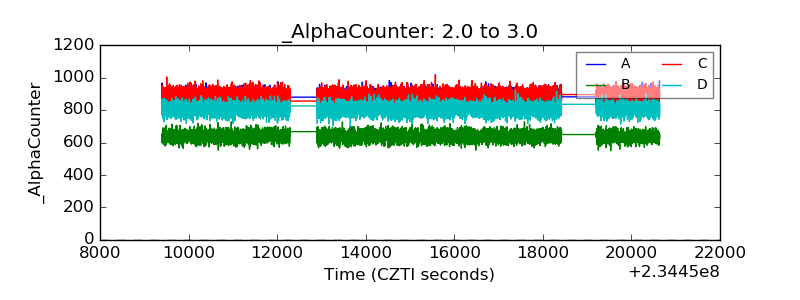 |
| _CPM_Rate | 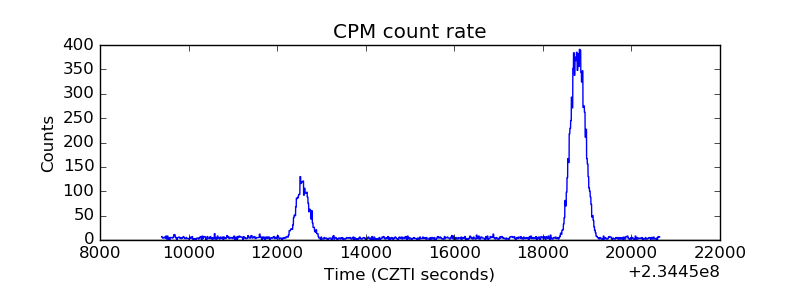 |
| CZT Counter | 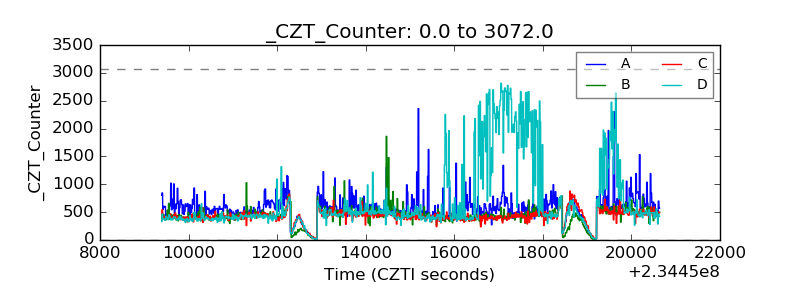 |
| +2.5 Volts monitor |  |
| +5 Volts monitor |  |
| _ROLL_ROT | 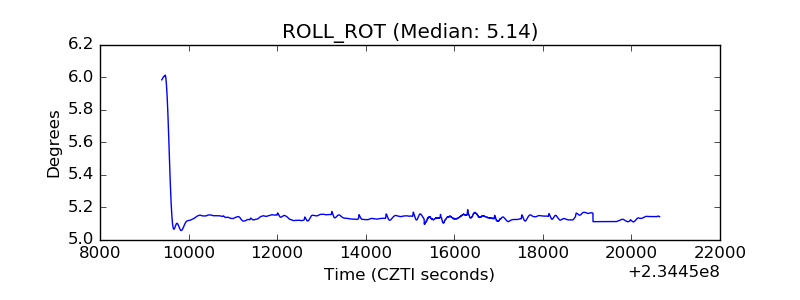 |
| _Roll_DEC | 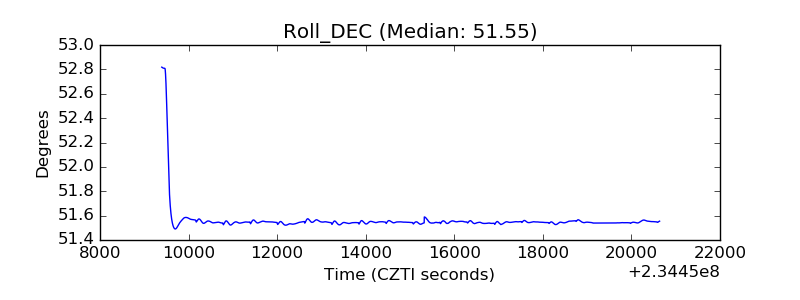 |
| _Roll_RA | 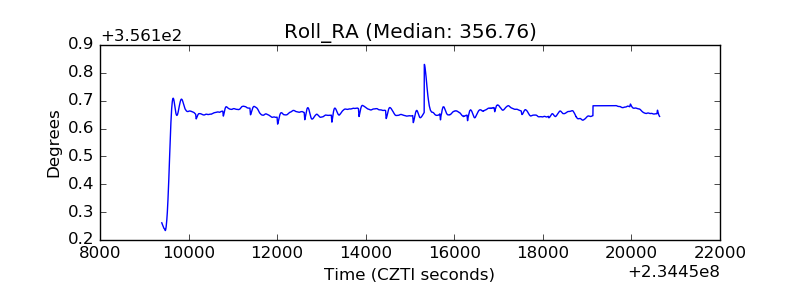 |
| Veto Counter | 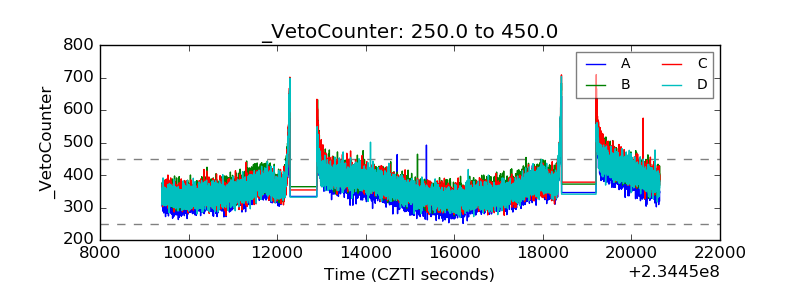 |