| Param | Original file | Final file |
|---|---|---|
| Filename | modeM0/AS1A03_033T01_9000001276_09142cztM0_level2.evt | modeM0/AS1A03_033T01_9000001276_09142cztM0_level2_quad_clean.evt |
| Size (bytes) | 473,863,680 | 79,499,520 |
| Size | 451.9 MB | 75.8 MB |
| Events in quadrant A | 3,980,530 | 493,440 |
| Events in quadrant B | 3,310,552 | 494,339 |
| Events in quadrant C | 2,989,908 | 487,386 |
| Events in quadrant D | 3,627,058 | 477,502 |
| Mode M0 | |||
|---|---|---|---|
| Quadrant | BADHDUFLAG | Total packets | Discarded packets |
| A | 0 | 16350 | 2 |
| B | 0 | 14195 | 1 |
| C | 0 | 13410 | 1 |
| D | 0 | 15363 | 1 |
| Mode SS | |||
|---|---|---|---|
| Quadrant | BADHDUFLAG | Total packets | Discarded packets |
| A | 0 | 130 | 0 |
| B | 0 | 130 | 0 |
| C | 0 | 130 | 0 |
| D | 0 | 130 | 0 |
| Mode M9 | |||
|---|---|---|---|
| Quadrant | BADHDUFLAG | Total packets | Discarded packets |
| A | 0 | 10 | 0 |
| B | 0 | 10 | 0 |
| C | 0 | 10 | 0 |
| D | 0 | 10 | 0 |
| Quadrant | Total seconds | Saturated seconds | Saturation percentage |
|---|---|---|---|
| A | 6527 | 118 | 1.807875% |
| B | 6527 | 75 | 1.149073% |
| C | 6527 | 55 | 0.842654% |
| D | 6527 | 223 | 3.416577% |
Noise dominated data is calculated using 1-second bins in cleaned event files. If a bin has >2000 counts, and if more than 50% of those come from <1% of pixels, then it is considered to be noise-dominated and hence unusable.
| Quadrant | # 1 sec bins | Bins with >0 counts | Bins with >2000 counts | High rate bins dominated by noise | Noise dominated (total time) | Noise dominated (detector-on time) | Marked lightcurve |
|---|---|---|---|---|---|---|---|
| A | 7462 | 6527 | 36 | 36 | 0.48% | 0.55% | 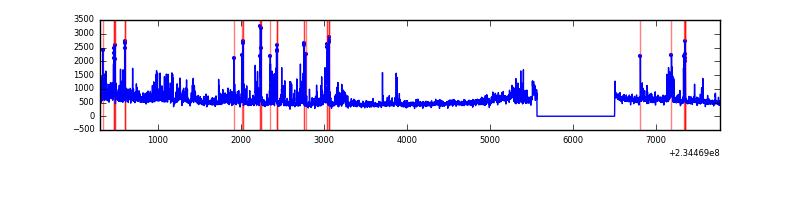 |
| B | 7462 | 6527 | 6 | 6 | 0.08% | 0.09% | 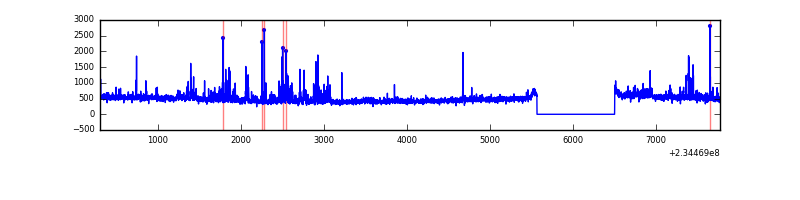 |
| C | 7462 | 6527 | 6 | 6 | 0.08% | 0.09% | 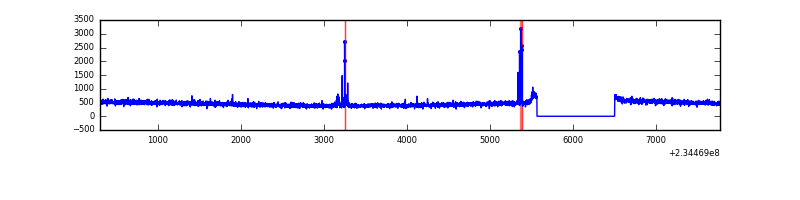 |
| D | 7462 | 6527 | 121 | 121 | 1.62% | 1.85% | 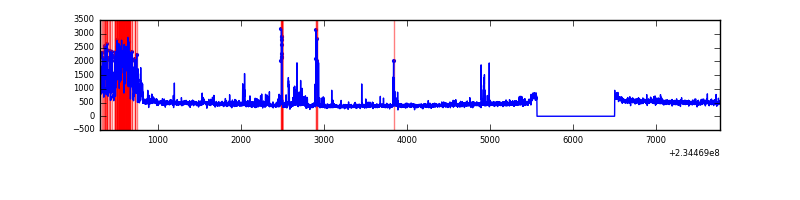 |
Top three noisy pixels from each quadrant. If the there are fewer than three noisy pixels in the level2.evt file, extra rows are filled as -1
| Pixel properties | Quadrant properties | ||||||
|---|---|---|---|---|---|---|---|
| Quadrant | DetID | PixID | Counts | Sigma | Mean | Median | Sigma |
| A | 8 | 5 | 795917 | 5135.64 | 769 | 754 | 154.8 |
| A | 13 | 251 | 98375 | 630.49 | 769 | 754 | 154.8 |
| A | 1 | 162 | 68256 | 435.97 | 769 | 754 | 154.8 |
| B | 4 | 48 | 160172 | 1080.0 | 774 | 756 | 147.6 |
| B | 0 | 230 | 41810 | 278.13 | 774 | 756 | 147.6 |
| B | 0 | 246 | 29689 | 196.01 | 774 | 756 | 147.6 |
| C | 14 | 234 | 46079 | 259.01 | 750 | 752 | 175.0 |
| C | 9 | 68 | 15582 | 84.74 | 750 | 752 | 175.0 |
| C | 13 | 61 | 5746 | 28.54 | 750 | 752 | 175.0 |
| D | 12 | 233 | 470022 | 2552.43 | 751 | 727 | 183.9 |
| D | 7 | 71 | 87290 | 470.8 | 751 | 727 | 183.9 |
| D | 1 | 52 | 75377 | 406.01 | 751 | 727 | 183.9 |
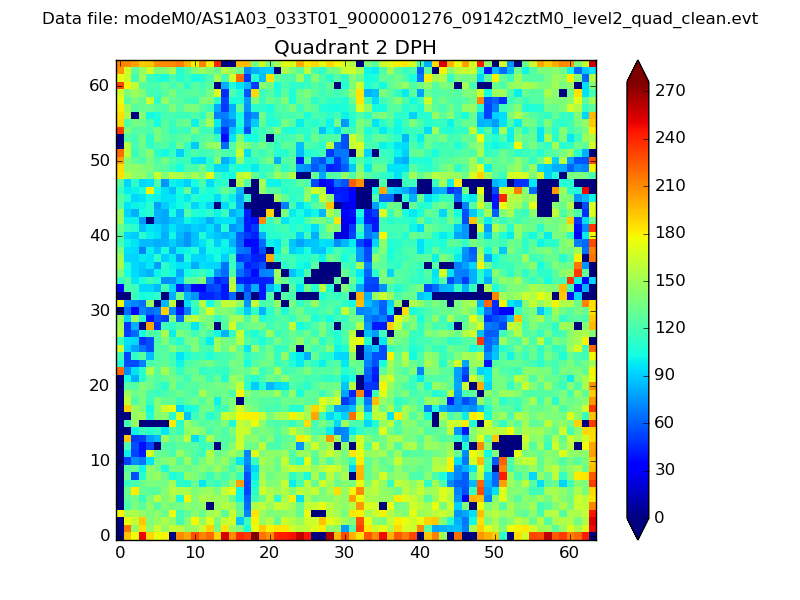
Histogram calculated using DETX and DETY for each event in the final _common_clean file
| Quadrant A | 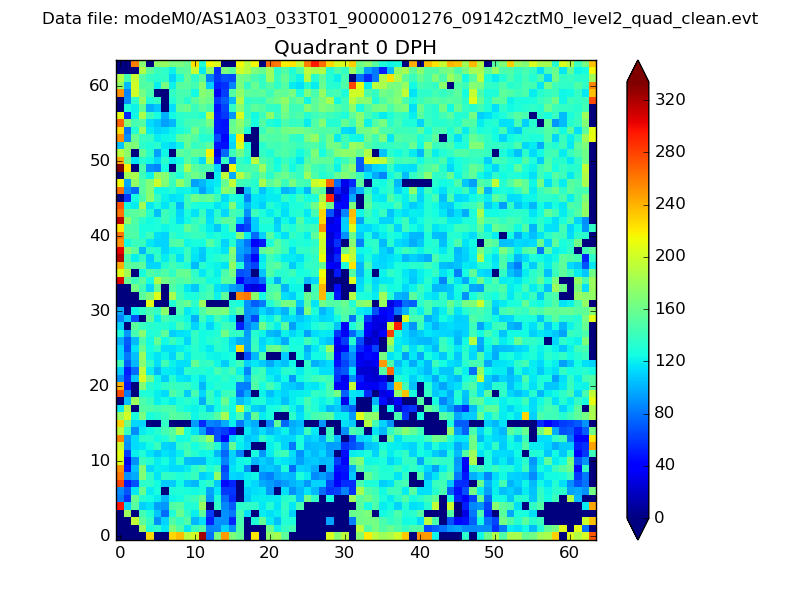 |
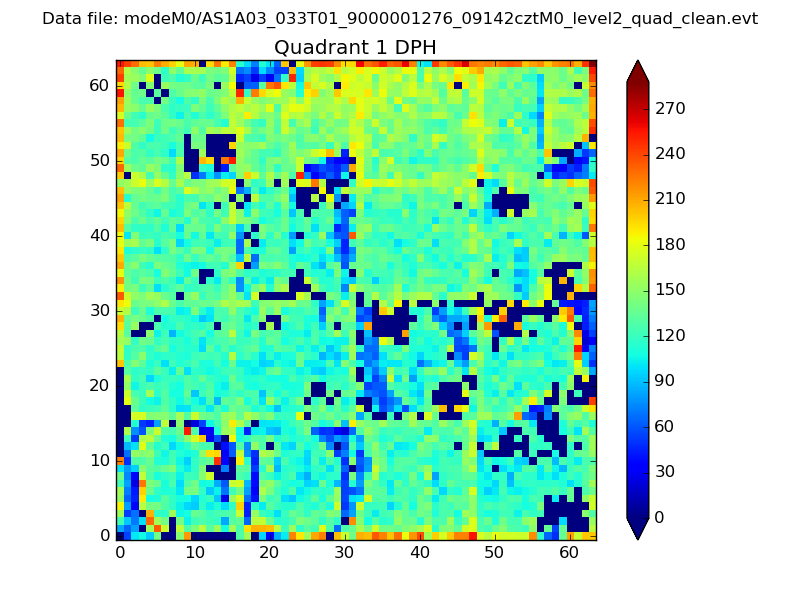 |
Quadrant B |
|---|---|---|---|
| Quadrant D | 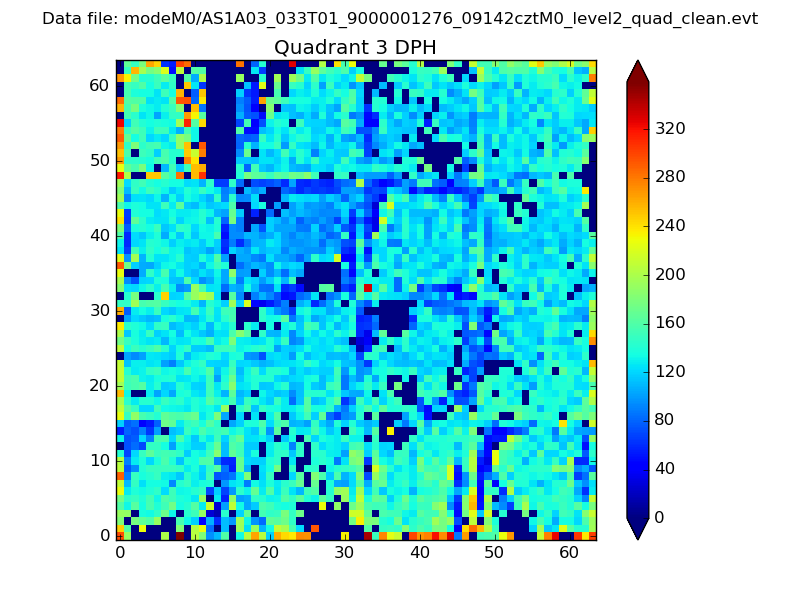 |
 |
Quadrant C |
| Plot type | Count rate plots | Images |
|---|---|---|
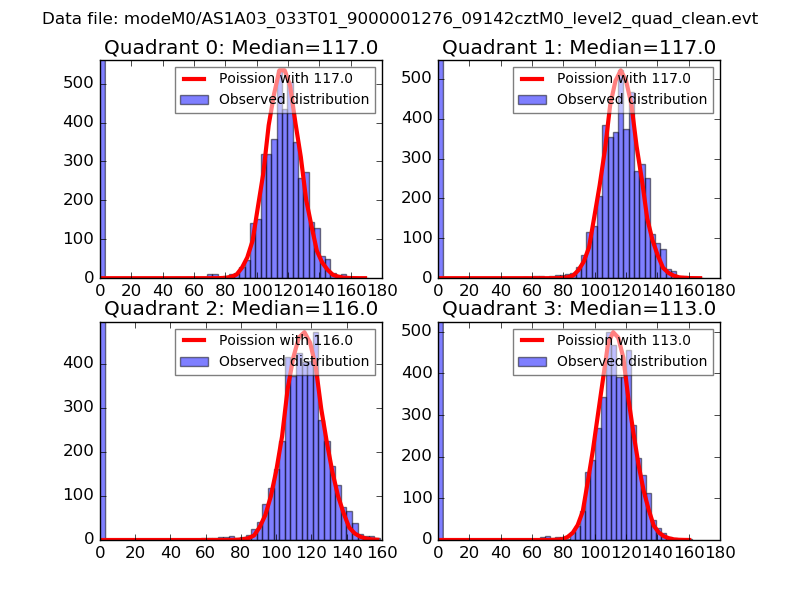
| Comparison with Poisson distribution Blue bars denote a histogram of data divided into 1 sec bins. Red curve is a Poisson curve with rate = median count rate of data. |
 |
 |
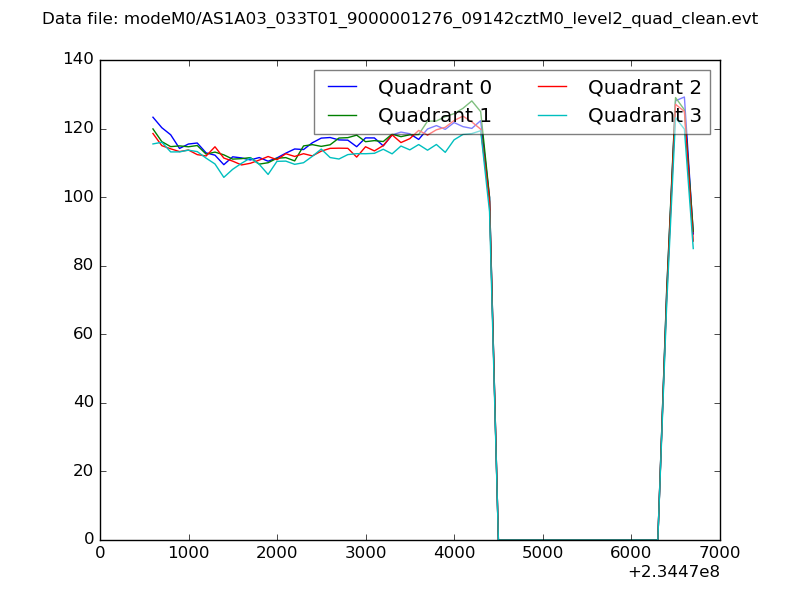
| Quadrant-wise count rates Data is divided into 100 sec bins |
 |
|
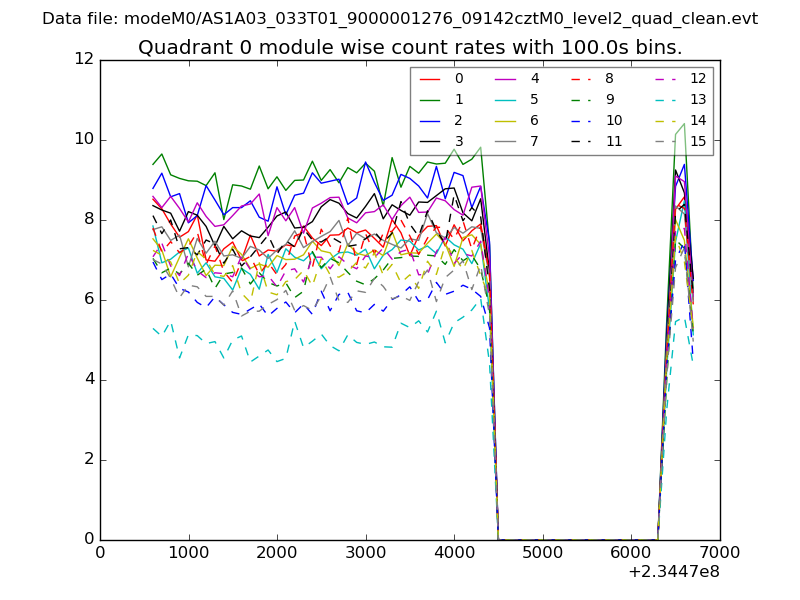
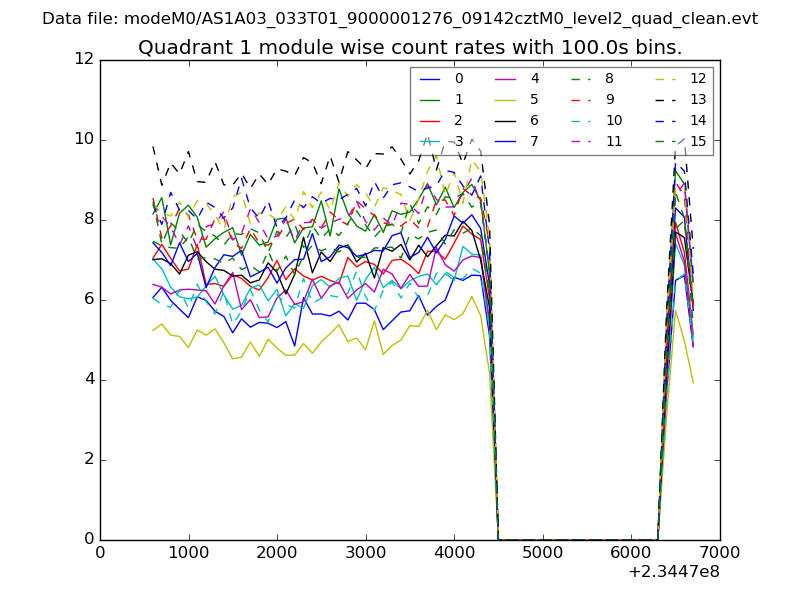
| Module-wise count rates for Quadrant A Data is divided into 100 sec bins |
 |
 |
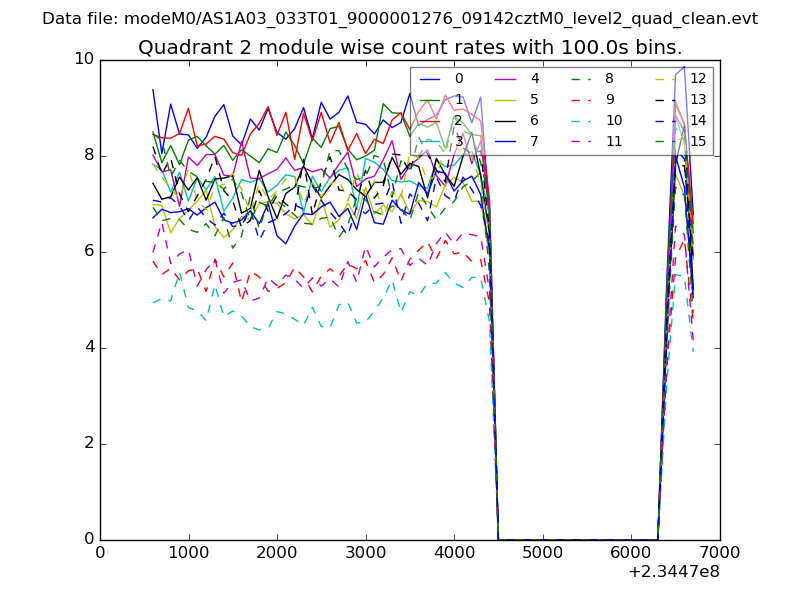
| Module-wise count rates for Quadrant B Data is divided into 100 sec bins |
 |
 |
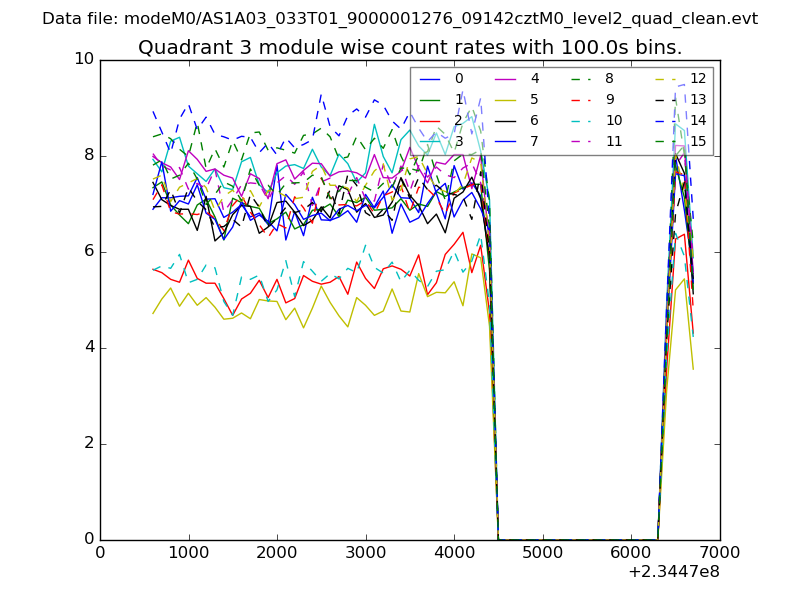
| Module-wise count rates for Quadrant C Data is divided into 100 sec bins |
 |
 |
| Module-wise count rates for Quadrant D Data is divided into 100 sec bins |
 |
 |
| Parameter | Plot |
|---|---|
| CZT HV Monitor | 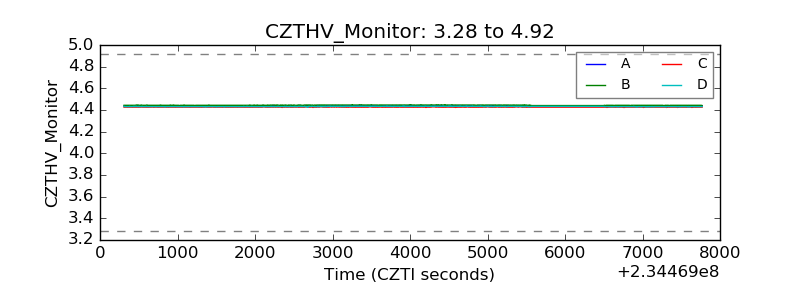 |
| D_VDD | 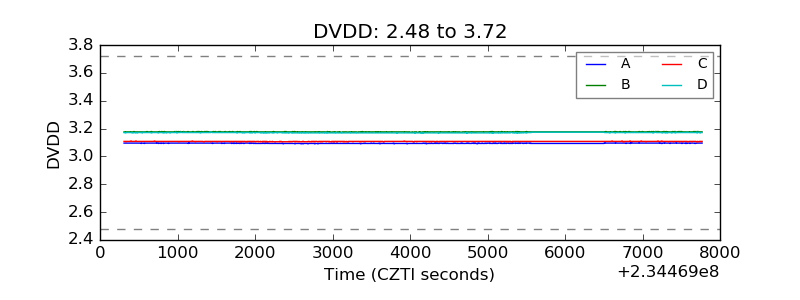 |
| Temperature 1 | 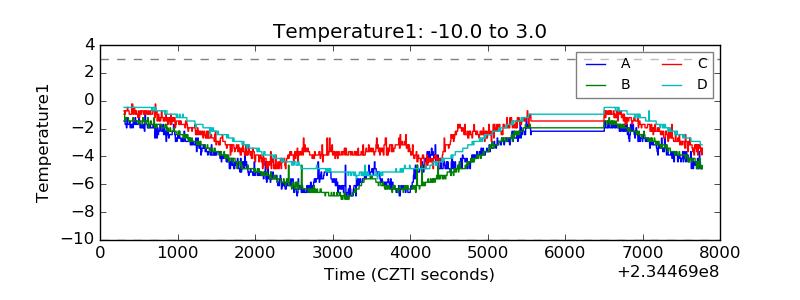 |
| Veto HV Monitor |  |
| Veto LLD | 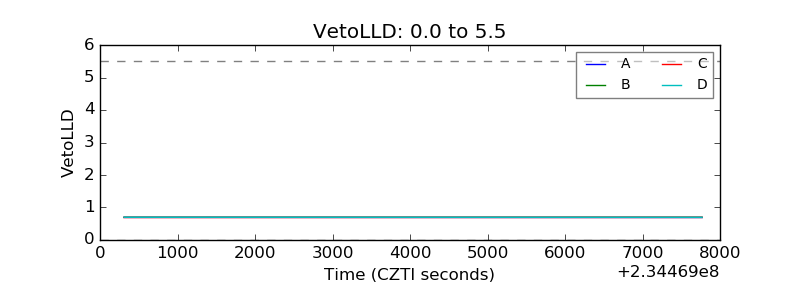 |
| Alpha Counter | 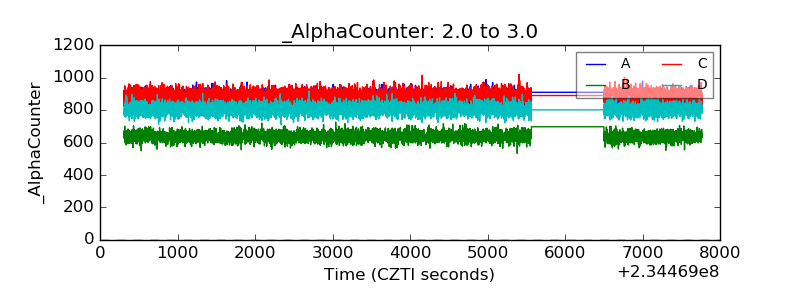 |
| _CPM_Rate | 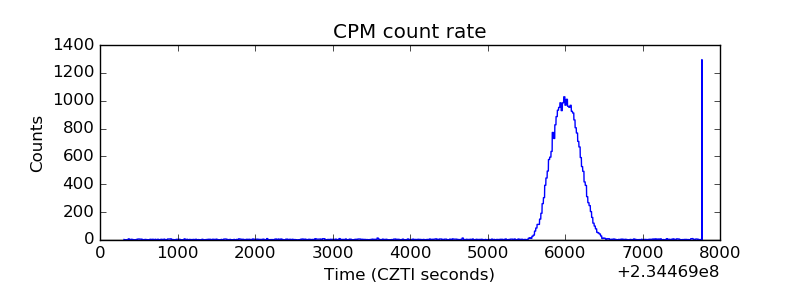 |
| CZT Counter | 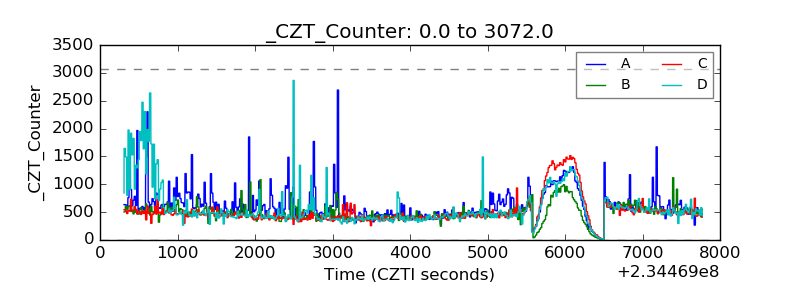 |
| +2.5 Volts monitor |  |
| +5 Volts monitor |  |
| _ROLL_ROT | 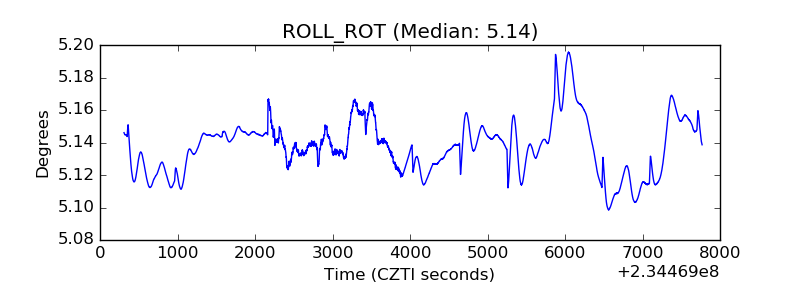 |
| _Roll_DEC | 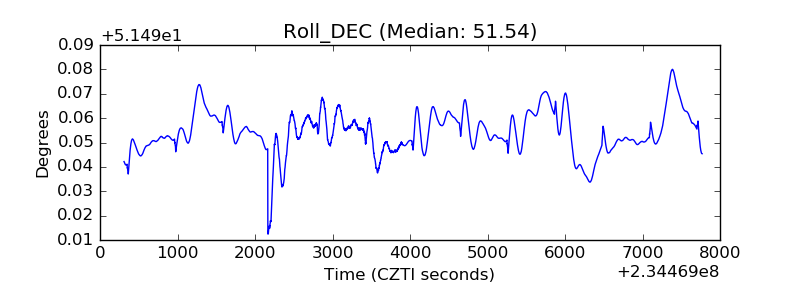 |
| _Roll_RA | 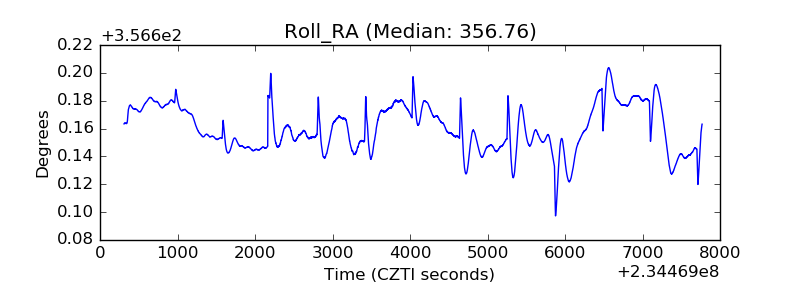 |
| Veto Counter | 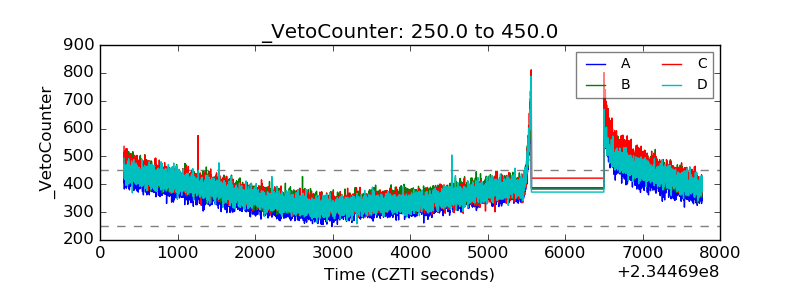 |