| Param | Original file | Final file |
|---|---|---|
| Filename | modeM0/AS1A03_033T01_9000001276_09144cztM0_level2.evt | modeM0/AS1A03_033T01_9000001276_09144cztM0_level2_quad_clean.evt |
| Size (bytes) | 251,386,560 | 50,273,280 |
| Size | 239.7 MB | 47.9 MB |
| Events in quadrant A | 2,066,966 | 319,753 |
| Events in quadrant B | 1,772,725 | 320,052 |
| Events in quadrant C | 1,608,769 | 315,706 |
| Events in quadrant D | 1,914,349 | 307,543 |
| Mode M0 | |||
|---|---|---|---|
| Quadrant | BADHDUFLAG | Total packets | Discarded packets |
| A | 0 | 8601 | 8 |
| B | 0 | 7916 | 1 |
| C | 0 | 7491 | 7 |
| D | 0 | 8309 | 26 |
| Mode SS | |||
|---|---|---|---|
| Quadrant | BADHDUFLAG | Total packets | Discarded packets |
| A | 0 | 72 | 0 |
| B | 0 | 72 | 0 |
| C | 0 | 72 | 0 |
| D | 0 | 72 | 0 |
| Mode M9 | |||
|---|---|---|---|
| Quadrant | BADHDUFLAG | Total packets | Discarded packets |
| A | 0 | 1 | 0 |
| B | 0 | 1 | 0 |
| C | 0 | 1 | 0 |
| D | 0 | 2 | 0 |
| Quadrant | Total seconds | Saturated seconds | Saturation percentage |
|---|---|---|---|
| A | 3664 | 27 | 0.736900% |
| B | 3667 | 15 | 0.409054% |
| C | 3664 | 3 | 0.081878% |
| D | 3662 | 45 | 1.228837% |
Noise dominated data is calculated using 1-second bins in cleaned event files. If a bin has >2000 counts, and if more than 50% of those come from <1% of pixels, then it is considered to be noise-dominated and hence unusable.
| Quadrant | # 1 sec bins | Bins with >0 counts | Bins with >2000 counts | High rate bins dominated by noise | Noise dominated (total time) | Noise dominated (detector-on time) | Marked lightcurve |
|---|---|---|---|---|---|---|---|
| A | 3667 | 3667 | 10 | 10 | 0.27% | 0.27% | 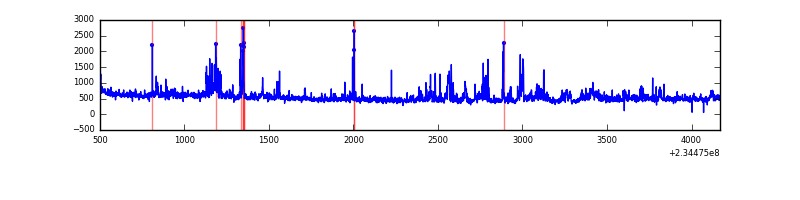 |
| B | 3667 | 3667 | 1 | 1 | 0.03% | 0.03% | 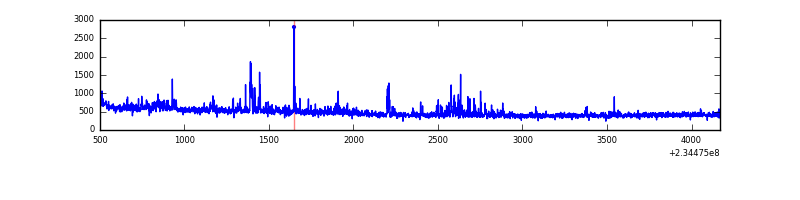 |
| C | 3667 | 3667 | 0 | 0 | 0.00% | 0.00% | 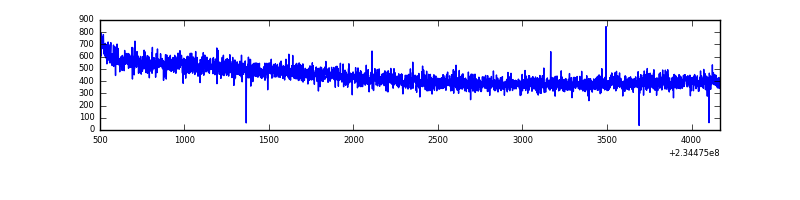 |
| D | 3667 | 3665 | 43 | 43 | 1.17% | 1.17% | 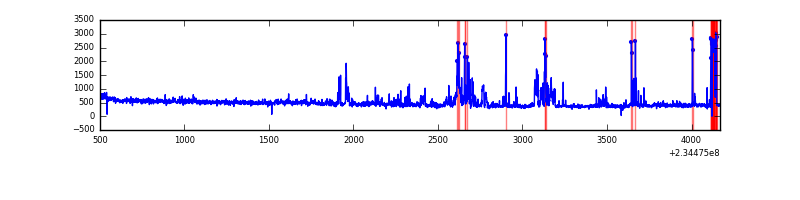 |
Top three noisy pixels from each quadrant. If the there are fewer than three noisy pixels in the level2.evt file, extra rows are filled as -1
| Pixel properties | Quadrant properties | ||||||
|---|---|---|---|---|---|---|---|
| Quadrant | DetID | PixID | Counts | Sigma | Mean | Median | Sigma |
| A | 8 | 5 | 314121 | 3688.21 | 414 | 405 | 85.1 |
| A | 13 | 251 | 94645 | 1107.93 | 414 | 405 | 85.1 |
| A | 1 | 162 | 35711 | 415.08 | 414 | 405 | 85.1 |
| B | 4 | 48 | 54413 | 667.21 | 421 | 410 | 80.9 |
| B | 0 | 230 | 43896 | 537.27 | 421 | 410 | 80.9 |
| B | 0 | 219 | 12598 | 150.58 | 421 | 410 | 80.9 |
| C | 9 | 68 | 14911 | 151.07 | 408 | 409 | 96.0 |
| C | 13 | 61 | 3083 | 27.86 | 408 | 409 | 96.0 |
| C | 12 | 4 | 1397 | 10.29 | 408 | 409 | 96.0 |
| D | 2 | 14 | 151309 | 1500.52 | 405 | 393 | 100.6 |
| D | 1 | 52 | 148630 | 1473.88 | 405 | 393 | 100.6 |
| D | 7 | 71 | 36655 | 360.54 | 405 | 393 | 100.6 |
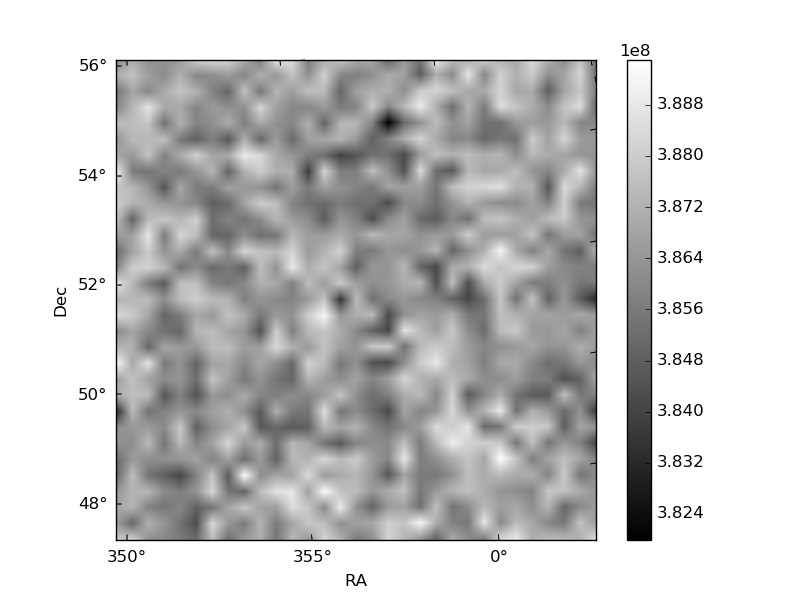
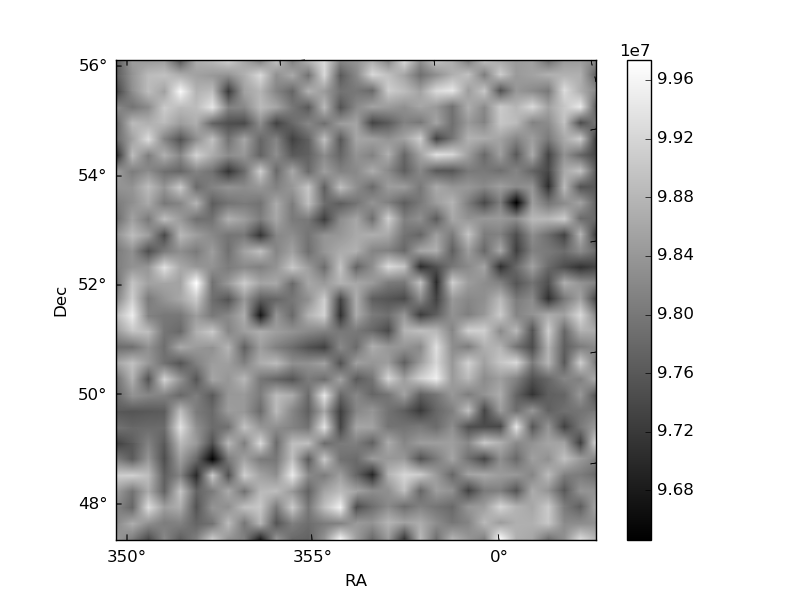
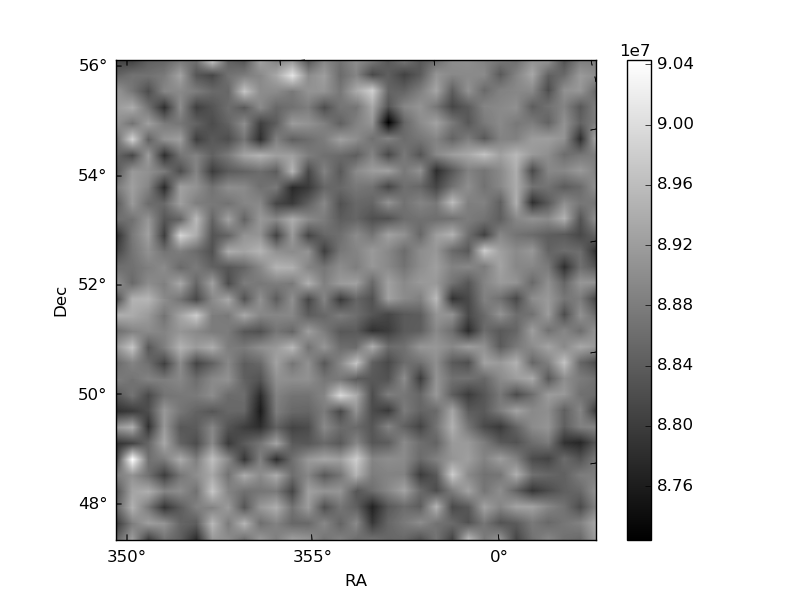
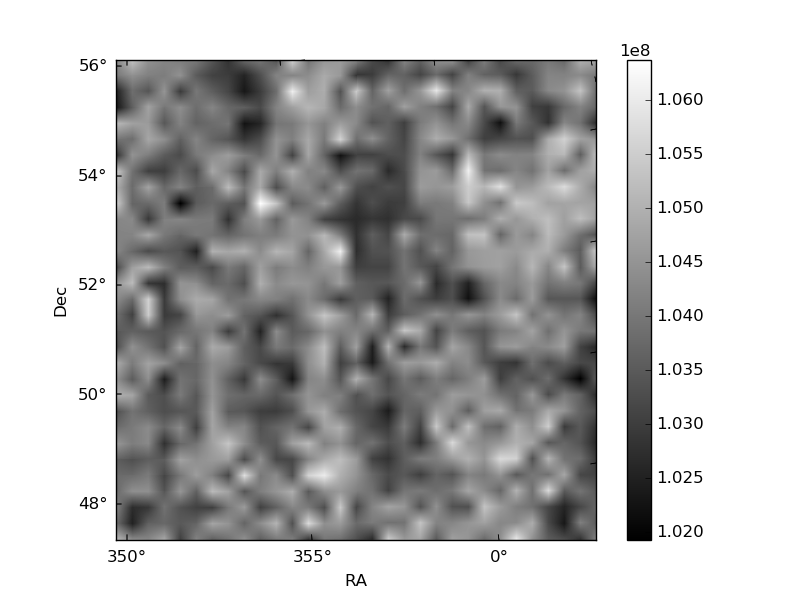
Histogram calculated using DETX and DETY for each event in the final _common_clean file
| Quadrant A | 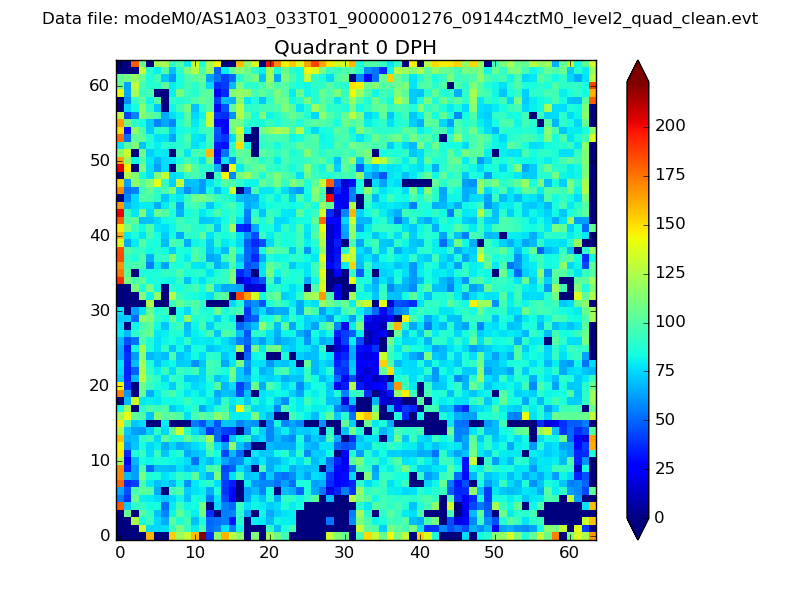 |
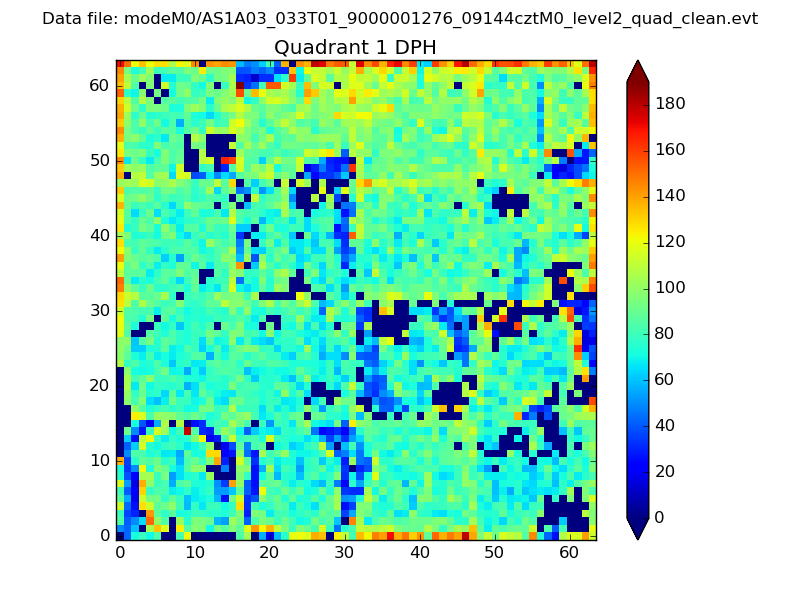 |
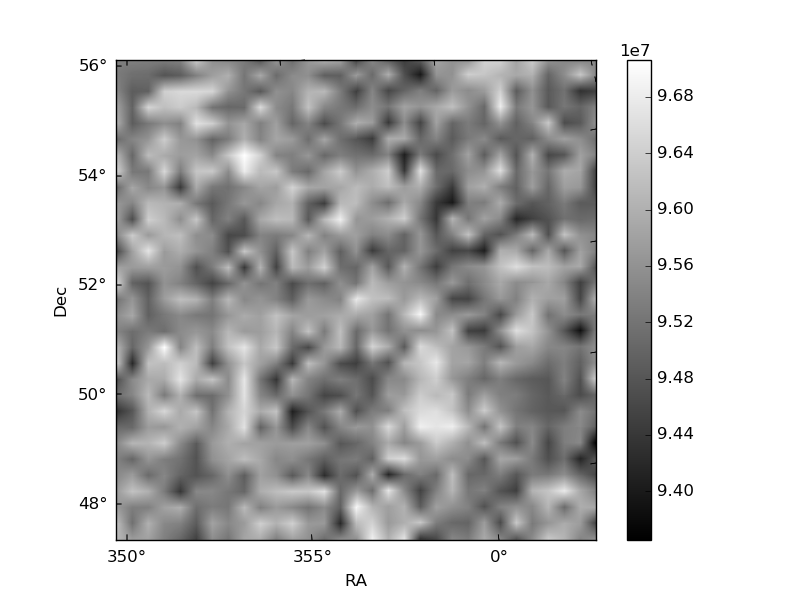
Quadrant B |
|---|---|---|---|
| Quadrant D | 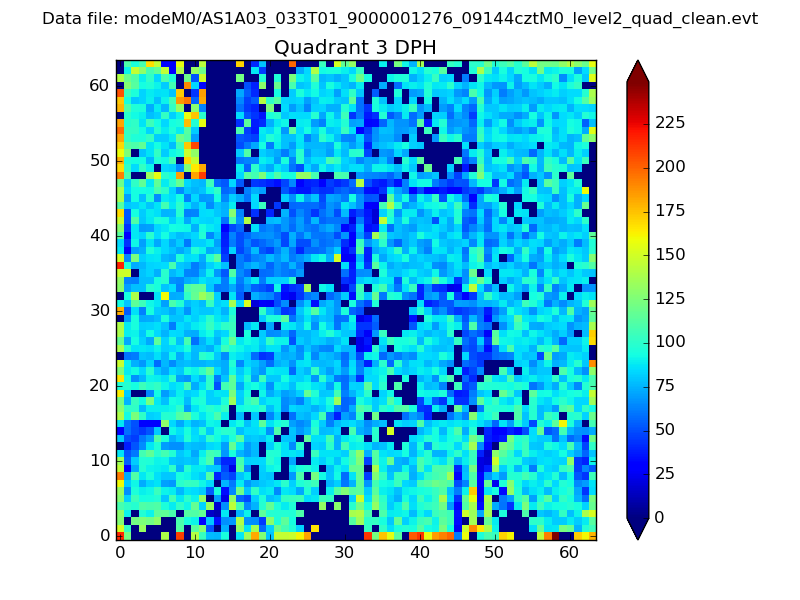 |
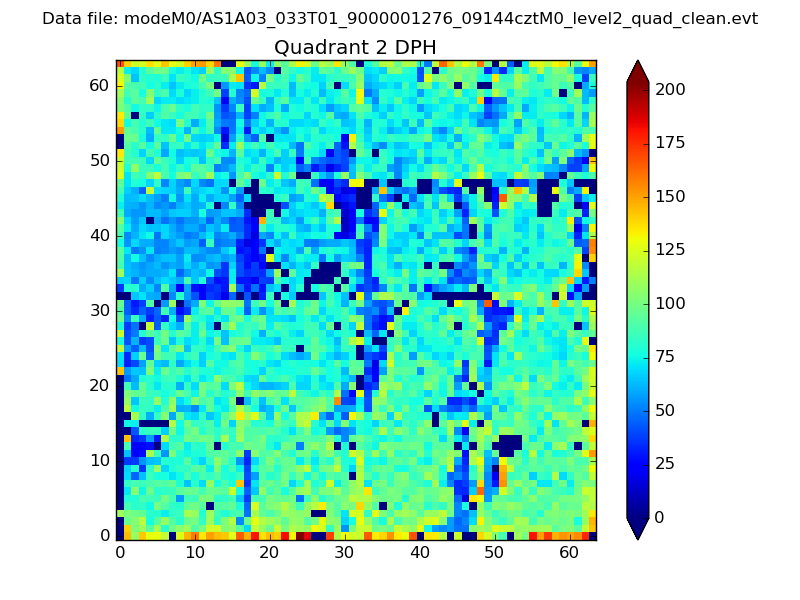 |
Quadrant C |
| Plot type | Count rate plots | Images |
|---|---|---|
| Comparison with Poisson distribution Blue bars denote a histogram of data divided into 1 sec bins. Red curve is a Poisson curve with rate = median count rate of data. |
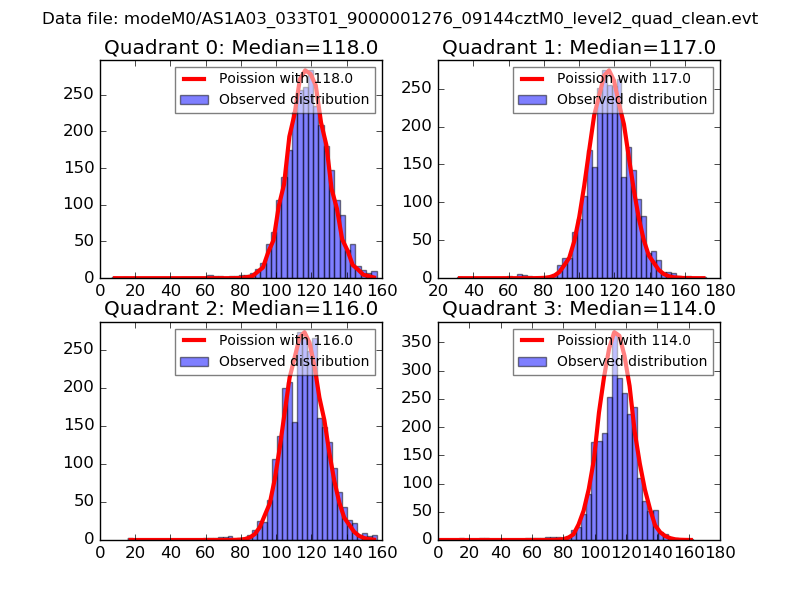 |
 |
| Quadrant-wise count rates Data is divided into 100 sec bins |
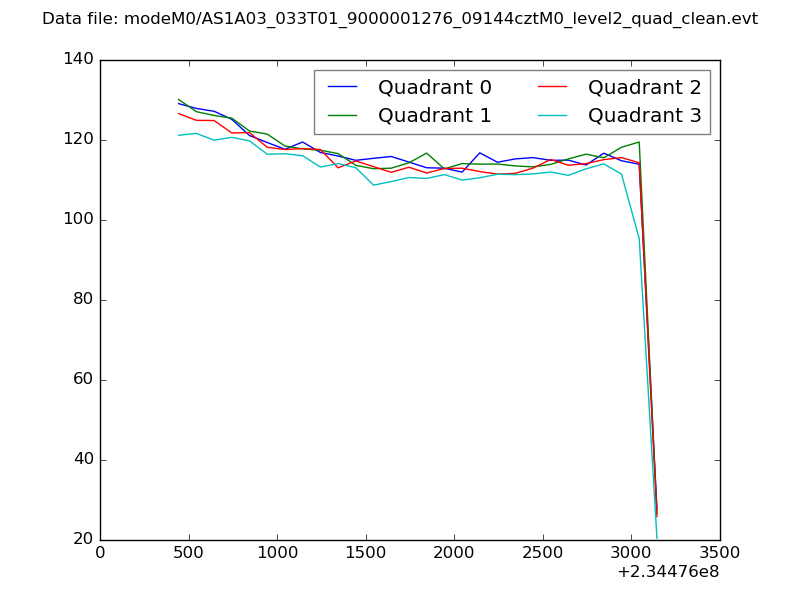 |
|
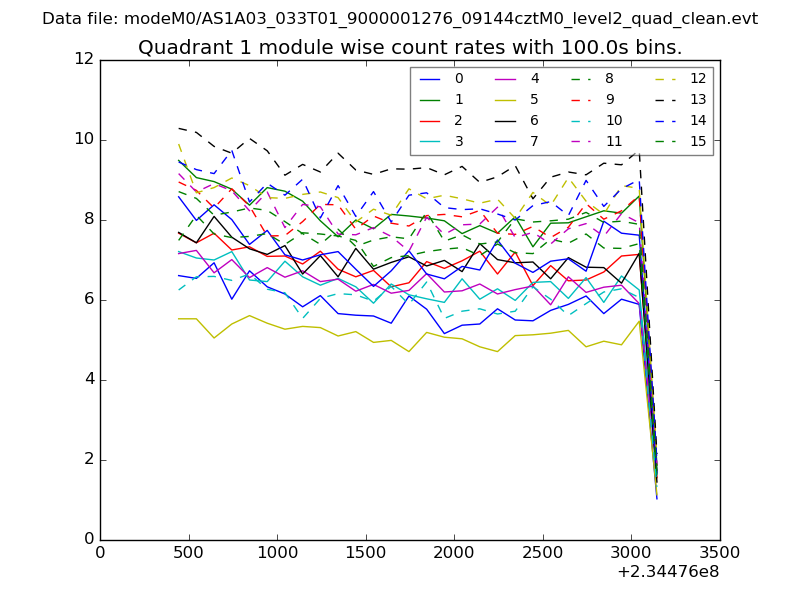
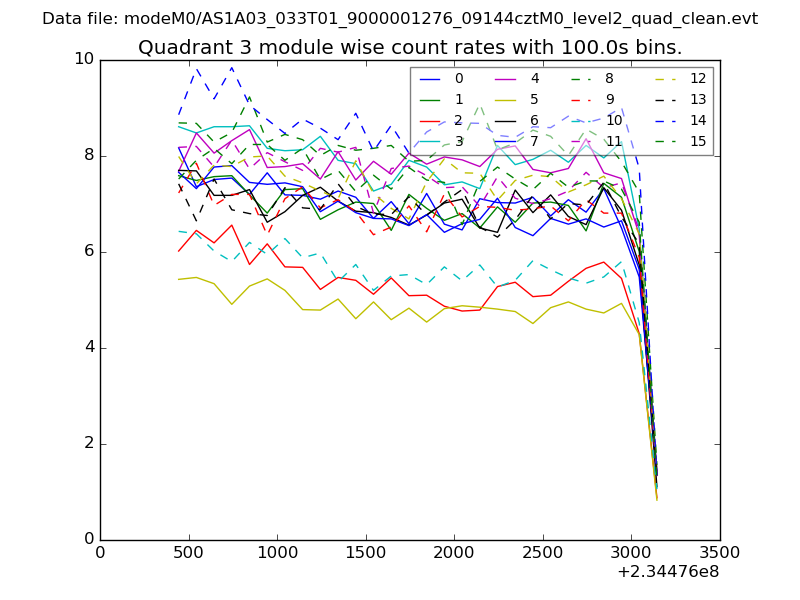
| Module-wise count rates for Quadrant A Data is divided into 100 sec bins |
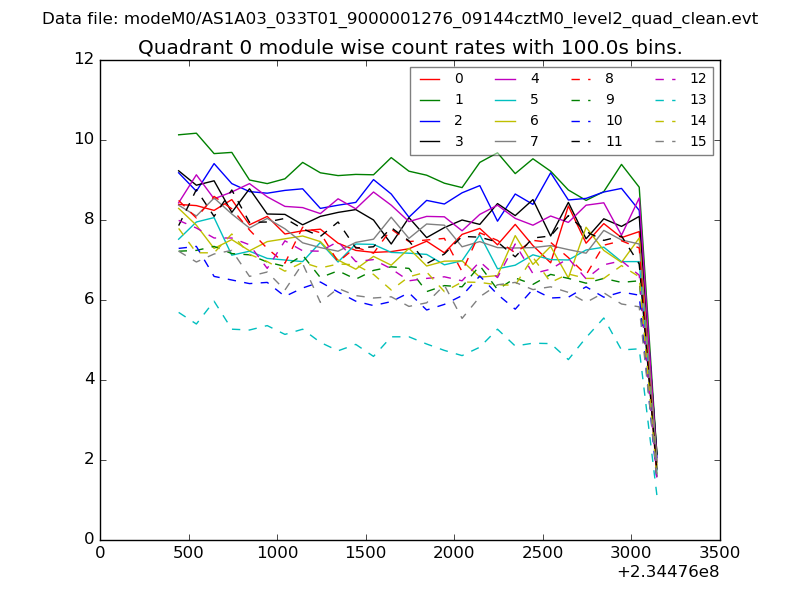 |
 |
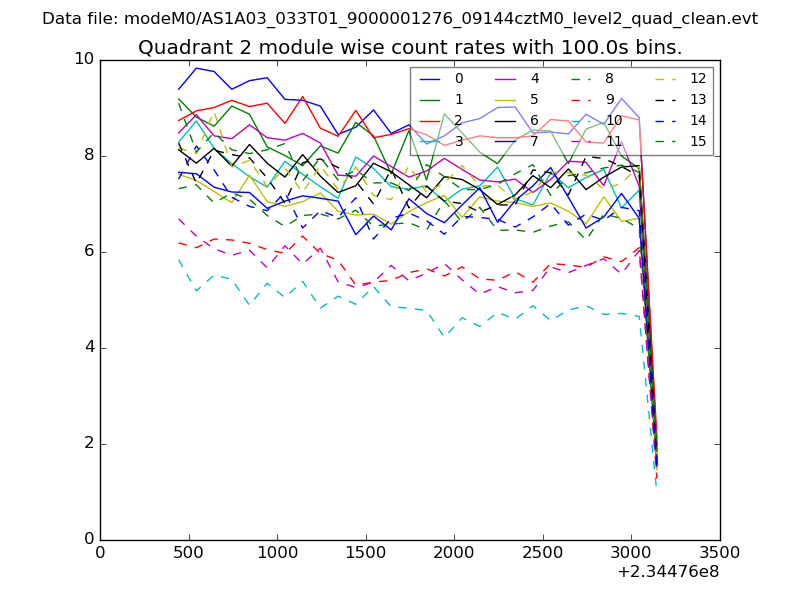
| Module-wise count rates for Quadrant B Data is divided into 100 sec bins |
 |
 |
| Module-wise count rates for Quadrant C Data is divided into 100 sec bins |
 |
 |
| Module-wise count rates for Quadrant D Data is divided into 100 sec bins |
 |
 |
| Parameter | Plot |
|---|---|
| CZT HV Monitor | 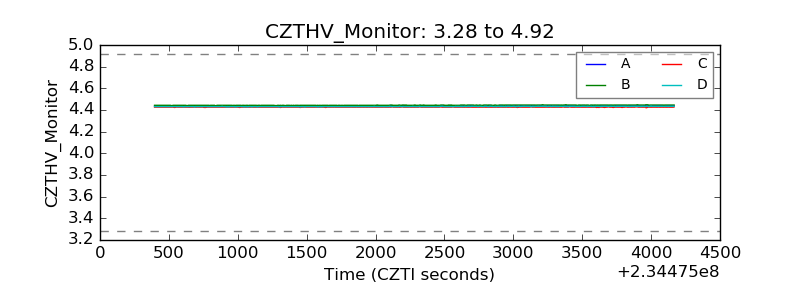 |
| D_VDD | 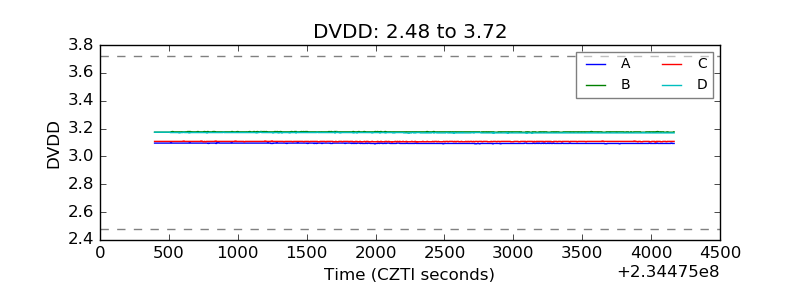 |
| Temperature 1 | 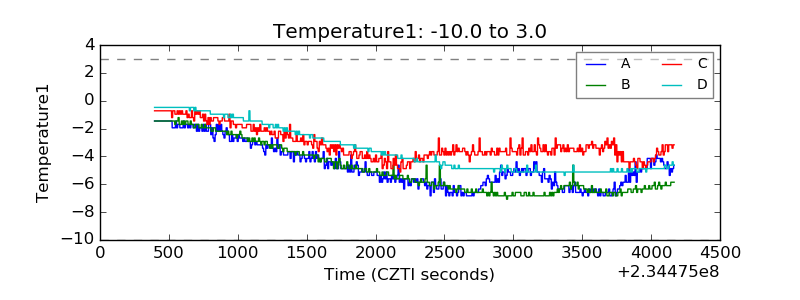 |
| Veto HV Monitor | 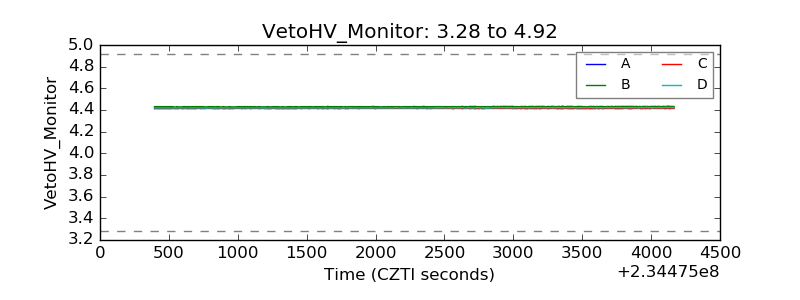 |
| Veto LLD | 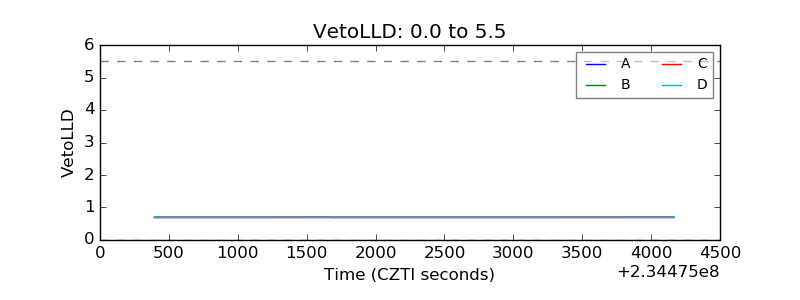 |
| Alpha Counter | 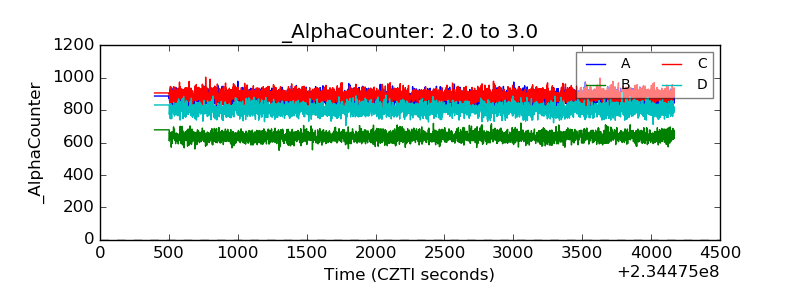 |
| _CPM_Rate | 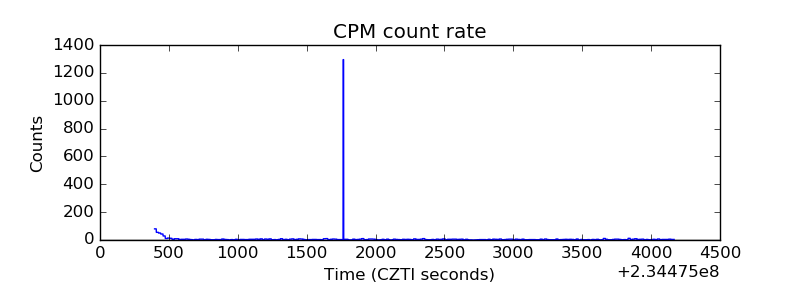 |
| CZT Counter | 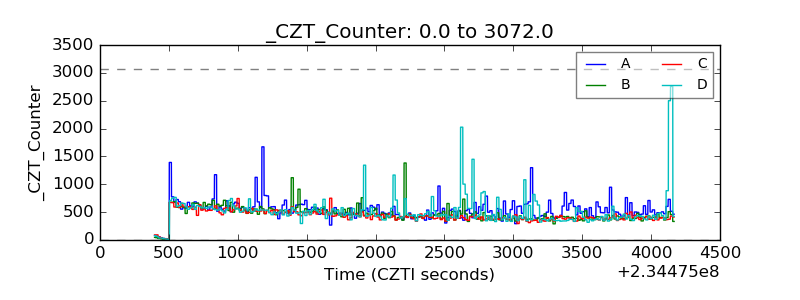 |
| +2.5 Volts monitor |  |
| +5 Volts monitor |  |
| _ROLL_ROT | 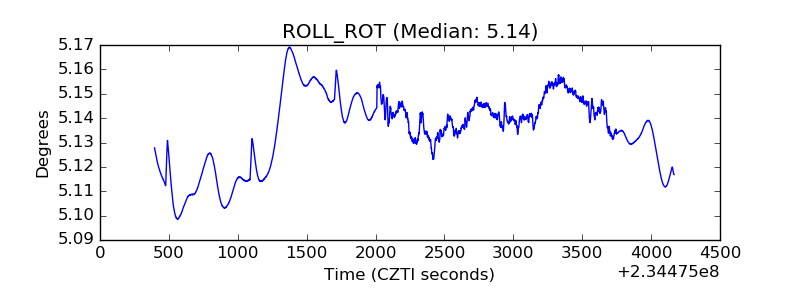 |
| _Roll_DEC | 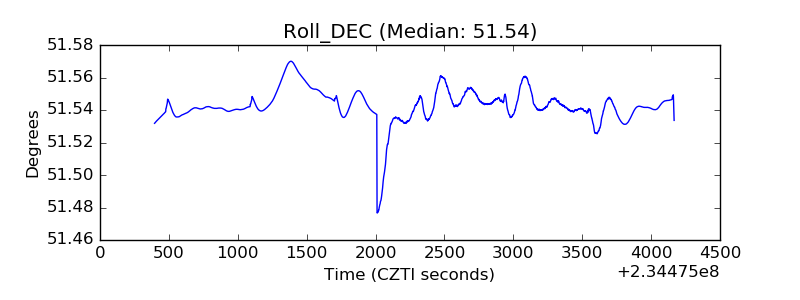 |
| _Roll_RA | 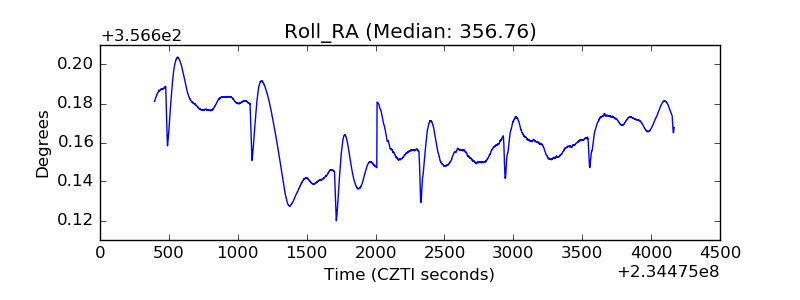 |
| Veto Counter | 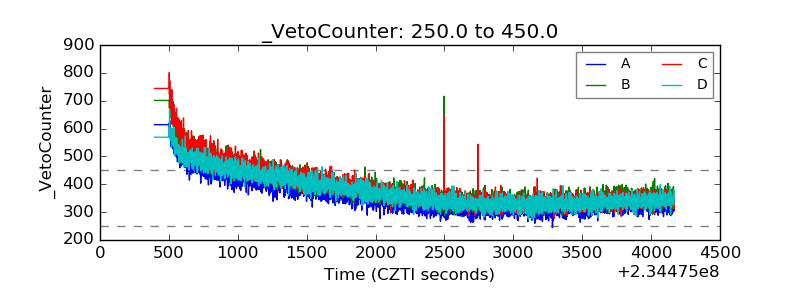 |