| Param | Original file | Final file |
|---|---|---|
| Filename | modeM0/AS1C02_042T01_9000001278cztM0_level2.fits | modeM0/AS1C02_042T01_9000001278cztM0_level2_quad_clean.evt |
| Size (bytes) | 755,792,640 | 809,697,600 |
| Size | 720.8 MB | 772.2 MB |
| Events in quadrant A | 4,525,226 | 4,915,376 |
| Events in quadrant B | 4,429,477 | 4,952,690 |
| Events in quadrant C | 4,490,566 | 4,752,137 |
| Events in quadrant D | 3,841,278 | 4,302,144 |
| Mode M0 | |||
|---|---|---|---|
| Quadrant | BADHDUFLAG | Total packets | Discarded packets |
| A | 0 | 188310 | 0 |
| B | 0 | 170396 | 0 |
| C | 0 | 167026 | 0 |
| D | 0 | 185163 | 0 |
| Mode M9 | |||
|---|---|---|---|
| Quadrant | BADHDUFLAG | Total packets | Discarded packets |
| A | 0 | 147 | 0 |
| B | 0 | 146 | 0 |
| C | 0 | 145 | 0 |
| D | 0 | 145 | 0 |
| Mode SS | |||
|---|---|---|---|
| Quadrant | BADHDUFLAG | Total packets | Discarded packets |
| A | 0 | 1640 | 0 |
| B | 0 | 1666 | 0 |
| C | 0 | 1658 | 0 |
| D | 0 | 1659 | 0 |
| Quadrant | Total seconds | Saturated seconds | Saturation percentage |
|---|---|---|---|
| A | 81691 | 1216 | 1.488536% |
| B | 81804 | 1056 | 1.290890% |
| C | 81745 | 697 | 0.852652% |
| D | 81598 | 2089 | 2.560112% |
Noise dominated data is calculated using 1-second bins in cleaned event files. If a bin has >2000 counts, and if more than 50% of those come from <1% of pixels, then it is considered to be noise-dominated and hence unusable.
| Quadrant | # 1 sec bins | Bins with >0 counts | Bins with >2000 counts | High rate bins dominated by noise | Noise dominated (total time) | Noise dominated (detector-on time) | Marked lightcurve |
|---|---|---|---|---|---|---|---|
| A | 97612 | 82728 | 0 | 0 | 0.00% | 0.00% |  |
| B | 97611 | 82775 | 0 | 0 | 0.00% | 0.00% |  |
| C | 97611 | 82718 | 0 | 0 | 0.00% | 0.00% | 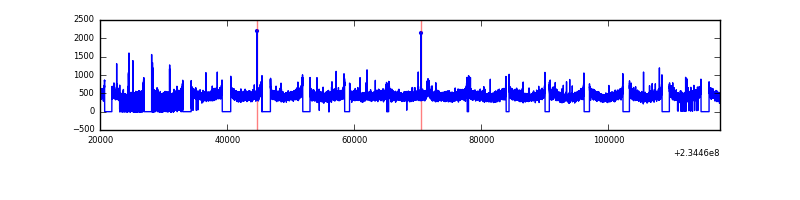 |
| D | 97612 | 82591 | 0 | 0 | 0.00% | 0.00% | 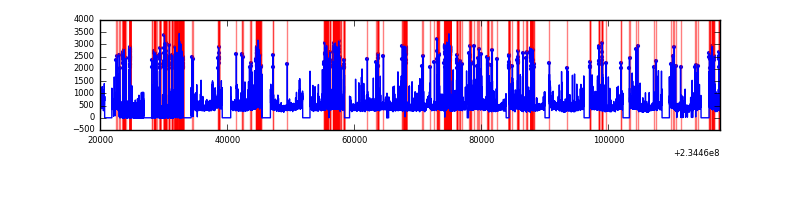 |
Top three noisy pixels from each quadrant. If the there are fewer than three noisy pixels in the level2.evt file, extra rows are filled as -1
| Pixel properties | Quadrant properties | ||||||
|---|---|---|---|---|---|---|---|
| Quadrant | DetID | PixID | Counts | Sigma | Mean | Median | Sigma |
| A | 14 | 188 | 4654 | 12.11 | 1176 | 1101 | 293.4 |
| A | 0 | 29 | 4373 | 11.15 | 1176 | 1101 | 293.4 |
| A | 14 | 204 | 4058 | 10.08 | 1176 | 1101 | 293.4 |
| B | 2 | 9 | 3867 | 12.1 | 1169 | 1115 | 227.5 |
| B | 14 | 254 | 3021 | 8.38 | 1169 | 1115 | 227.5 |
| B | 12 | 226 | 2979 | 8.19 | 1169 | 1115 | 227.5 |
| C | 1 | 80 | 3327 | 7.2 | 1185 | 1099 | 309.3 |
| C | 1 | 81 | 3297 | 7.11 | 1185 | 1099 | 309.3 |
| C | 12 | 241 | 3248 | 6.95 | 1185 | 1099 | 309.3 |
| D | 3 | 14 | 2836 | 6.24 | 1096 | 994 | 294.9 |
| D | 6 | 231 | 2794 | 6.1 | 1096 | 994 | 294.9 |
| D | 7 | 5 | 2760 | 5.99 | 1096 | 994 | 294.9 |
Histogram calculated using DETX and DETY for each event in the final _common_clean file
| Quadrant A | 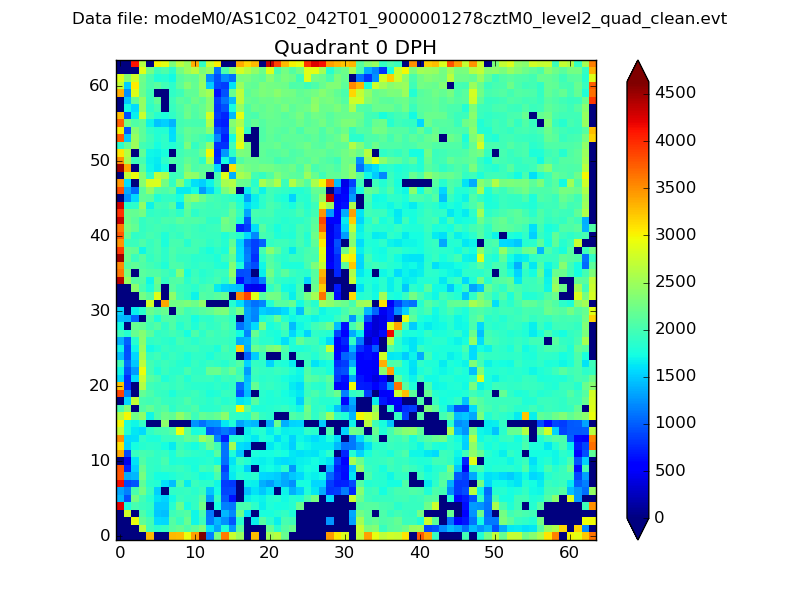 |
 |
Quadrant B |
|---|---|---|---|
| Quadrant D |  |
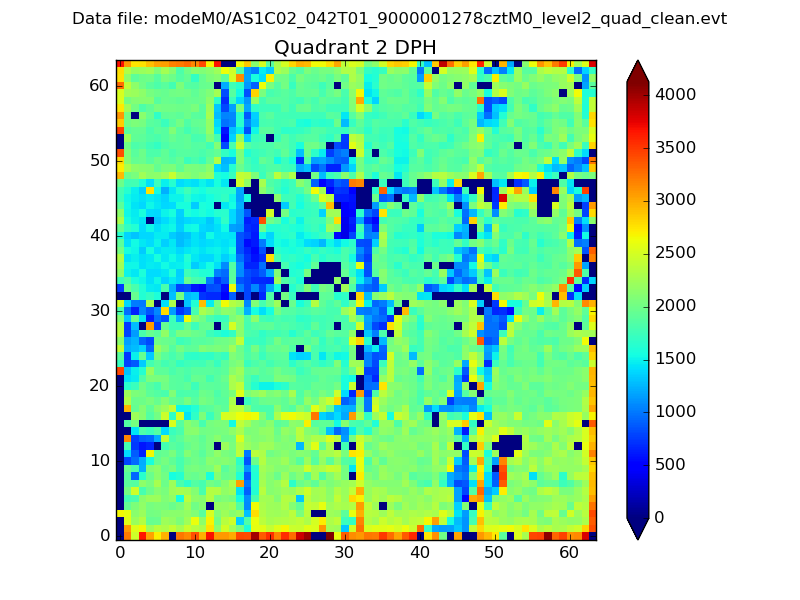 |
Quadrant C |
| Plot type | Count rate plots | Images |
|---|---|---|
| Comparison with Poisson distribution Blue bars denote a histogram of data divided into 1 sec bins. Red curve is a Poisson curve with rate = median count rate of data. |
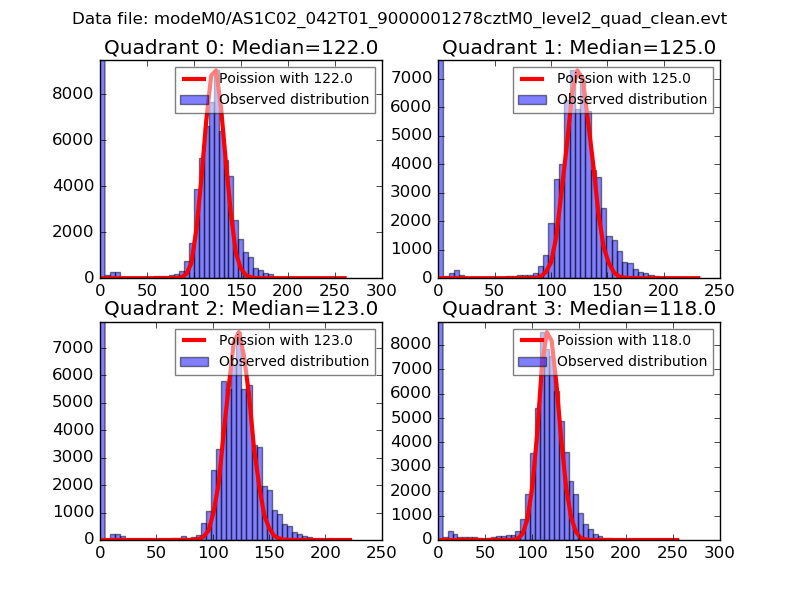 |
 |
| Quadrant-wise count rates Data is divided into 100 sec bins |
 |
|
| Module-wise count rates for Quadrant A Data is divided into 100 sec bins |
 |
 |
| Module-wise count rates for Quadrant B Data is divided into 100 sec bins |
 |
 |
| Module-wise count rates for Quadrant C Data is divided into 100 sec bins |
 |
 |
| Module-wise count rates for Quadrant D Data is divided into 100 sec bins |
 |
 |
| Parameter | Plot |
|---|---|
| CZT HV Monitor |  |
| D_VDD |  |
| Temperature 1 |  |
| Veto HV Monitor |  |
| Veto LLD | 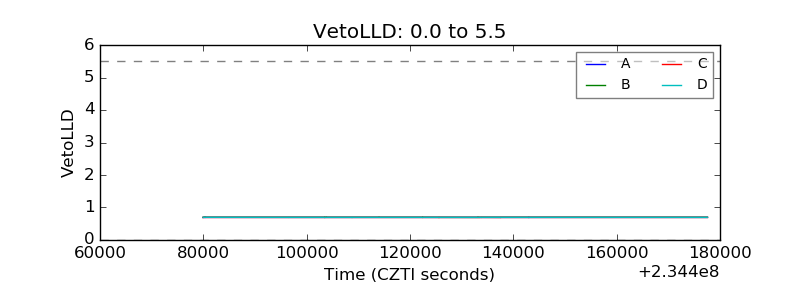 |
| Alpha Counter |  |
| _CPM_Rate |  |
| CZT Counter |  |
| +2.5 Volts monitor |  |
| +5 Volts monitor |  |
| _ROLL_ROT |  |
| _Roll_DEC |  |
| _Roll_RA |  |
| Veto Counter |  |