| Param | Original file | Final file |
|---|---|---|
| Filename | modeM0/AS1C02_042T01_9000001278_09144cztM0_level2.evt | modeM0/AS1C02_042T01_9000001278_09144cztM0_level2_quad_clean.evt |
| Size (bytes) | 142,776,000 | 39,003,840 |
| Size | 136.2 MB | 37.2 MB |
| Events in quadrant A | 1,112,202 | 259,436 |
| Events in quadrant B | 1,062,876 | 266,254 |
| Events in quadrant C | 961,796 | 263,584 |
| Events in quadrant D | 1,052,509 | 249,957 |
| Mode M0 | |||
|---|---|---|---|
| Quadrant | BADHDUFLAG | Total packets | Discarded packets |
| A | 0 | 4559 | 10 |
| B | 0 | 4359 | 3 |
| C | 0 | 4044 | 1 |
| D | 0 | 4361 | 10 |
| Mode M9 | |||
|---|---|---|---|
| Quadrant | BADHDUFLAG | Total packets | Discarded packets |
| A | 0 | 12 | 0 |
| B | 0 | 12 | 0 |
| C | 0 | 12 | 0 |
| D | 0 | 12 | 0 |
| Mode SS | |||
|---|---|---|---|
| Quadrant | BADHDUFLAG | Total packets | Discarded packets |
| A | 0 | 40 | 0 |
| B | 0 | 40 | 0 |
| C | 0 | 40 | 0 |
| D | 0 | 40 | 0 |
| Quadrant | Total seconds | Saturated seconds | Saturation percentage |
|---|---|---|---|
| A | 1946 | 10 | 0.513875% |
| B | 1948 | 14 | 0.718686% |
| C | 1949 | 2 | 0.102617% |
| D | 1945 | 8 | 0.411311% |
Noise dominated data is calculated using 1-second bins in cleaned event files. If a bin has >2000 counts, and if more than 50% of those come from <1% of pixels, then it is considered to be noise-dominated and hence unusable.
| Quadrant | # 1 sec bins | Bins with >0 counts | Bins with >2000 counts | High rate bins dominated by noise | Noise dominated (total time) | Noise dominated (detector-on time) | Marked lightcurve |
|---|---|---|---|---|---|---|---|
| A | 3094 | 1950 | 6 | 6 | 0.19% | 0.31% | 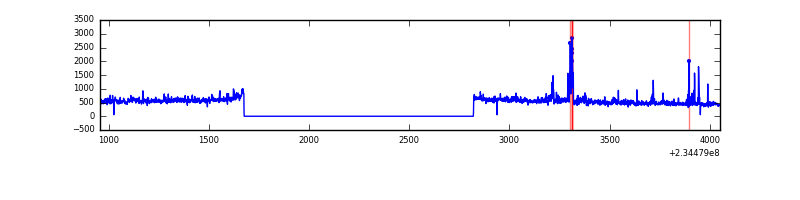 |
| B | 3094 | 1950 | 4 | 4 | 0.13% | 0.21% |  |
| C | 3094 | 1950 | 0 | 0 | 0.00% | 0.00% |  |
| D | 3094 | 1950 | 4 | 4 | 0.13% | 0.21% | 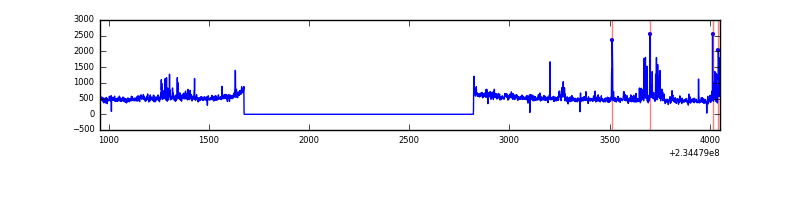 |
Top three noisy pixels from each quadrant. If the there are fewer than three noisy pixels in the level2.evt file, extra rows are filled as -1
| Pixel properties | Quadrant properties | ||||||
|---|---|---|---|---|---|---|---|
| Quadrant | DetID | PixID | Counts | Sigma | Mean | Median | Sigma |
| A | 8 | 5 | 134650 | 2646.59 | 244 | 238 | 50.8 |
| A | 1 | 162 | 14357 | 278.01 | 244 | 238 | 50.8 |
| A | 13 | 251 | 10542 | 202.89 | 244 | 238 | 50.8 |
| B | 4 | 48 | 36608 | 748.22 | 247 | 241 | 48.6 |
| B | 0 | 214 | 30165 | 615.66 | 247 | 241 | 48.6 |
| B | 0 | 213 | 13218 | 266.99 | 247 | 241 | 48.6 |
| C | 9 | 68 | 3318 | 53.16 | 244 | 246 | 57.8 |
| C | 4 | 239 | 3111 | 49.58 | 244 | 246 | 57.8 |
| C | 13 | 61 | 1772 | 26.41 | 244 | 246 | 57.8 |
| D | 7 | 71 | 49799 | 835.22 | 240 | 234 | 59.3 |
| D | 1 | 52 | 29438 | 492.12 | 240 | 234 | 59.3 |
| D | 13 | 137 | 23515 | 392.31 | 240 | 234 | 59.3 |
Histogram calculated using DETX and DETY for each event in the final _common_clean file
| Quadrant A |  |
 |
Quadrant B |
|---|---|---|---|
| Quadrant D |  |
 |
Quadrant C |
| Plot type | Count rate plots | Images |
|---|---|---|
| Comparison with Poisson distribution Blue bars denote a histogram of data divided into 1 sec bins. Red curve is a Poisson curve with rate = median count rate of data. |
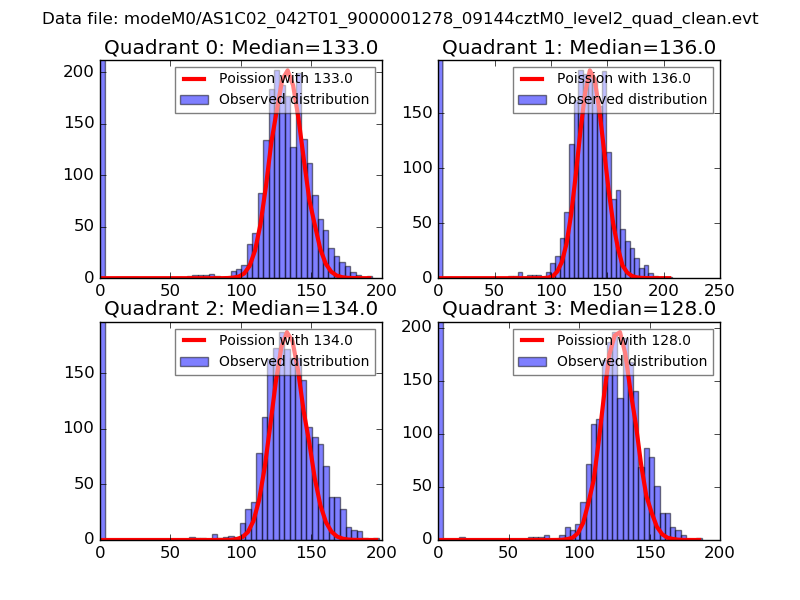 |
 |
| Quadrant-wise count rates Data is divided into 100 sec bins |
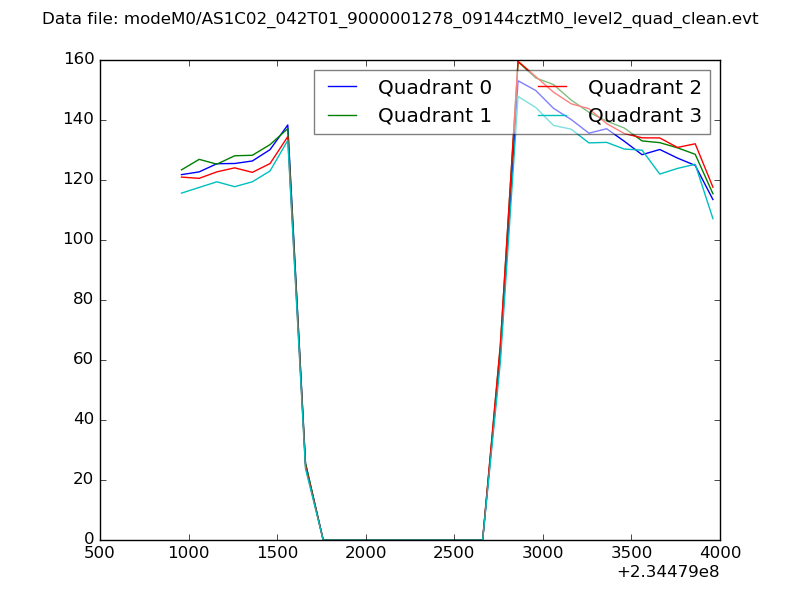 |
|
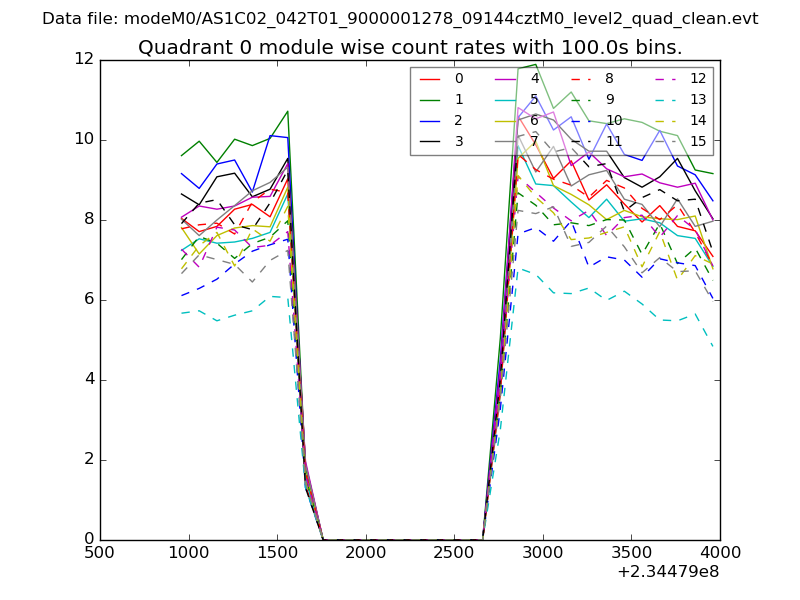
| Module-wise count rates for Quadrant A Data is divided into 100 sec bins |
 |
 |
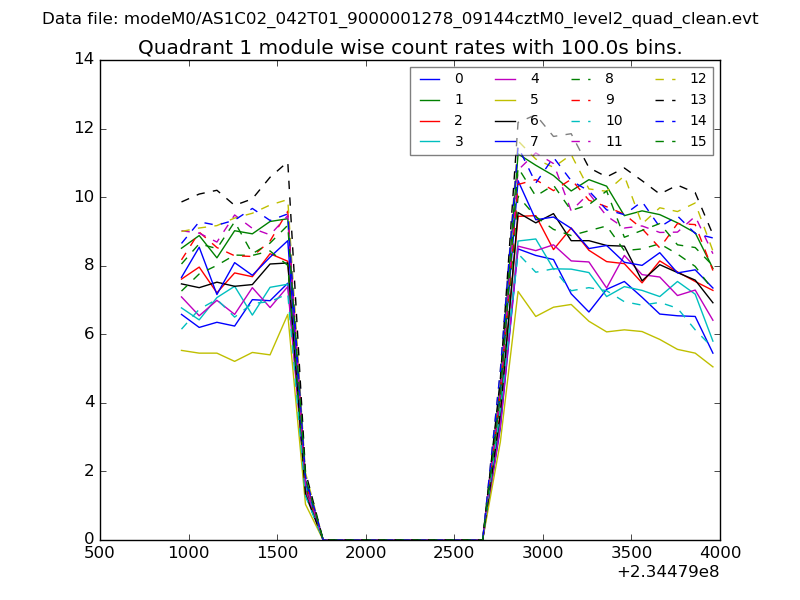
| Module-wise count rates for Quadrant B Data is divided into 100 sec bins |
 |
 |
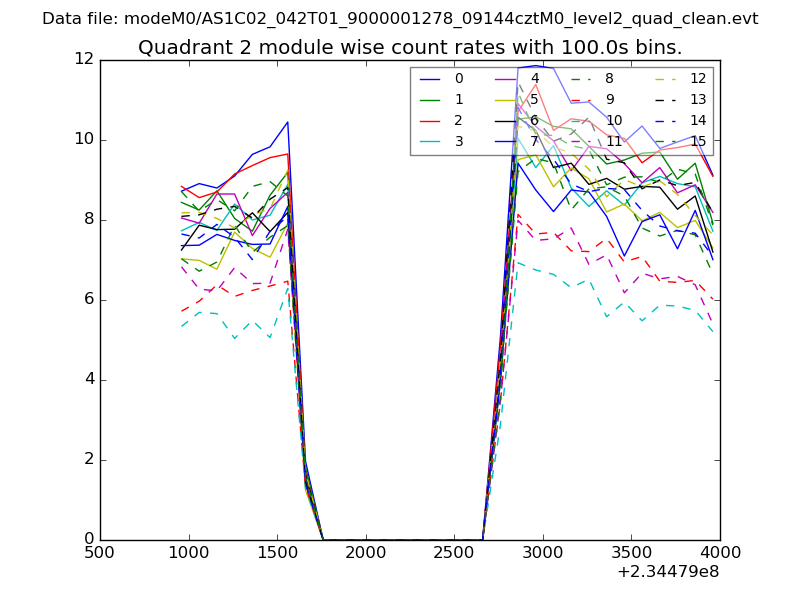
| Module-wise count rates for Quadrant C Data is divided into 100 sec bins |
 |
 |
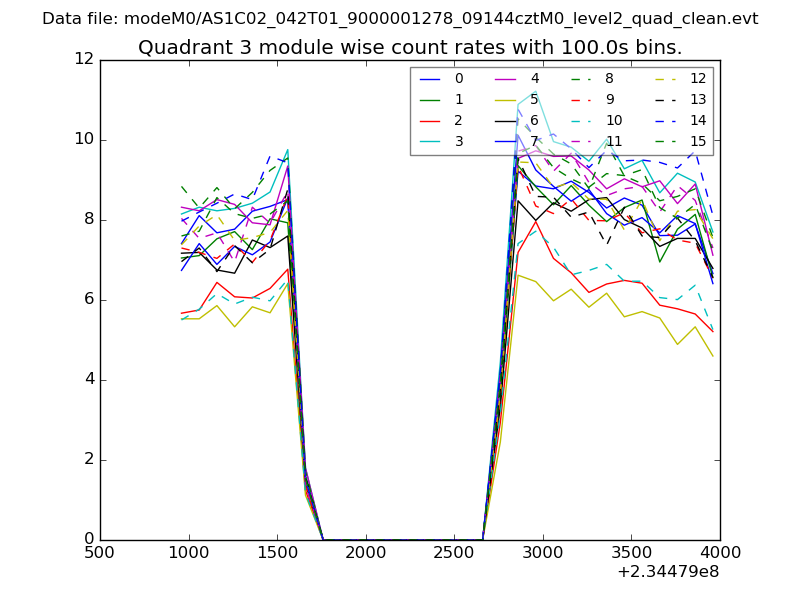
| Module-wise count rates for Quadrant D Data is divided into 100 sec bins |
 |
 |
| Parameter | Plot |
|---|---|
| CZT HV Monitor | 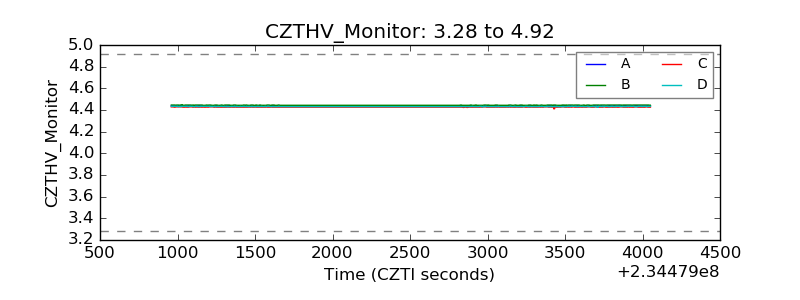 |
| D_VDD |  |
| Temperature 1 |  |
| Veto HV Monitor |  |
| Veto LLD |  |
| Alpha Counter | 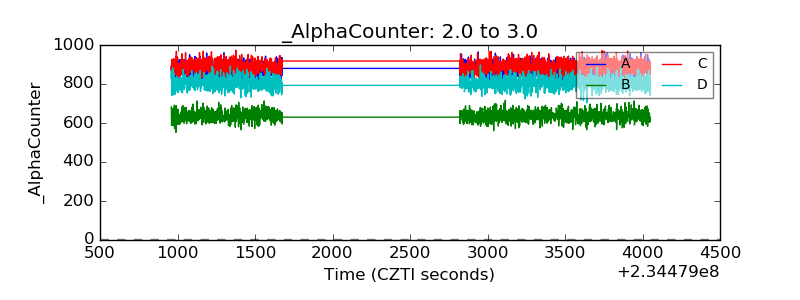 |
| _CPM_Rate | 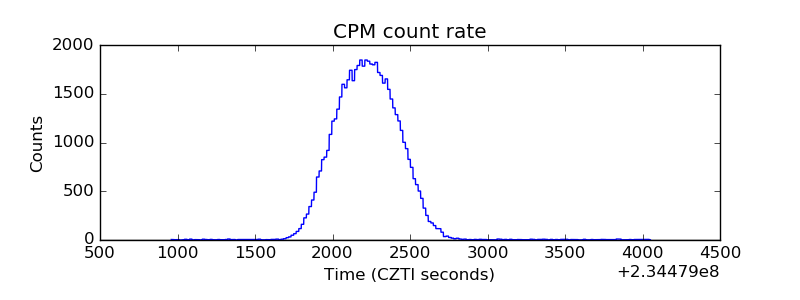 |
| CZT Counter |  |
| +2.5 Volts monitor |  |
| +5 Volts monitor |  |
| _ROLL_ROT |  |
| _Roll_DEC |  |
| _Roll_RA |  |
| Veto Counter | 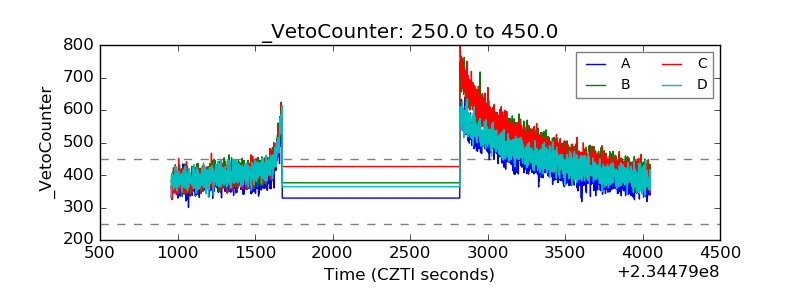 |