| Param | Original file | Final file |
|---|---|---|
| Filename | modeM0/AS1C02_042T01_9000001278_09145cztM0_level2.evt | modeM0/AS1C02_042T01_9000001278_09145cztM0_level2_quad_clean.evt |
| Size (bytes) | 341,403,840 | 78,134,400 |
| Size | 325.6 MB | 74.5 MB |
| Events in quadrant A | 2,647,119 | 497,357 |
| Events in quadrant B | 2,433,079 | 520,929 |
| Events in quadrant C | 2,287,593 | 516,244 |
| Events in quadrant D | 2,628,467 | 479,488 |
| Mode M0 | |||
|---|---|---|---|
| Quadrant | BADHDUFLAG | Total packets | Discarded packets |
| A | 0 | 13931 | 2854 |
| B | 0 | 13108 | 2394 |
| C | 0 | 12700 | 2356 |
| D | 0 | 14485 | 3129 |
| Mode M9 | |||
|---|---|---|---|
| Quadrant | BADHDUFLAG | Total packets | Discarded packets |
| A | 0 | 21 | 1 |
| B | 0 | 21 | 2 |
| C | 0 | 21 | 2 |
| D | 0 | 22 | 2 |
| Mode SS | |||
|---|---|---|---|
| Quadrant | BADHDUFLAG | Total packets | Discarded packets |
| A | 0 | 126 | 34 |
| B | 0 | 126 | 18 |
| C | 0 | 126 | 22 |
| D | 0 | 125 | 24 |
| Quadrant | Total seconds | Saturated seconds | Saturation percentage |
|---|---|---|---|
| A | 4975 | 20 | 0.402010% |
| B | 5069 | 31 | 0.611560% |
| C | 5029 | 10 | 0.198847% |
| D | 4962 | 95 | 1.914551% |
Noise dominated data is calculated using 1-second bins in cleaned event files. If a bin has >2000 counts, and if more than 50% of those come from <1% of pixels, then it is considered to be noise-dominated and hence unusable.
| Quadrant | # 1 sec bins | Bins with >0 counts | Bins with >2000 counts | High rate bins dominated by noise | Noise dominated (total time) | Noise dominated (detector-on time) | Marked lightcurve |
|---|---|---|---|---|---|---|---|
| A | 7416 | 5819 | 6 | 6 | 0.08% | 0.10% | 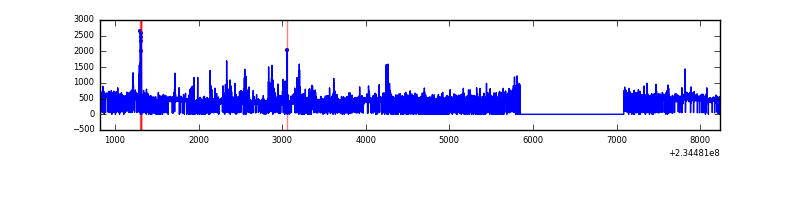 |
| B | 7416 | 5894 | 4 | 4 | 0.05% | 0.07% | 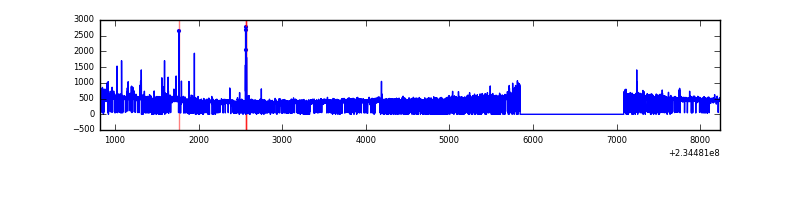 |
| C | 7415 | 5834 | 0 | 0 | 0.00% | 0.00% | 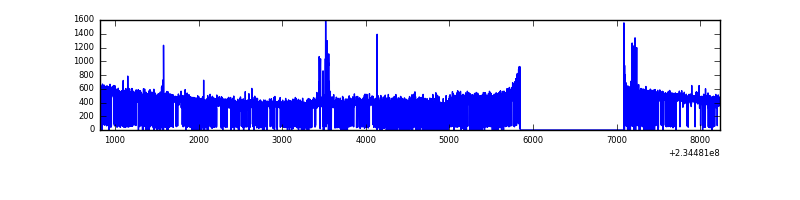 |
| D | 7416 | 5796 | 81 | 81 | 1.09% | 1.40% | 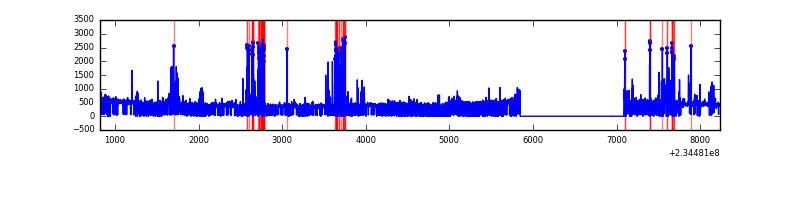 |
Top three noisy pixels from each quadrant. If the there are fewer than three noisy pixels in the level2.evt file, extra rows are filled as -1
| Pixel properties | Quadrant properties | ||||||
|---|---|---|---|---|---|---|---|
| Quadrant | DetID | PixID | Counts | Sigma | Mean | Median | Sigma |
| A | 8 | 5 | 354387 | 3016.85 | 574 | 562 | 117.3 |
| A | 13 | 251 | 46825 | 394.46 | 574 | 562 | 117.3 |
| A | 1 | 162 | 18572 | 153.56 | 574 | 562 | 117.3 |
| B | 0 | 219 | 30708 | 268.71 | 596 | 583 | 112.1 |
| B | 4 | 48 | 24997 | 217.77 | 596 | 583 | 112.1 |
| B | 4 | 80 | 24350 | 212.0 | 596 | 583 | 112.1 |
| C | 4 | 239 | 35898 | 265.69 | 576 | 579 | 132.9 |
| C | 13 | 61 | 4390 | 28.67 | 576 | 579 | 132.9 |
| C | 9 | 68 | 3021 | 18.37 | 576 | 579 | 132.9 |
| D | 1 | 52 | 176807 | 1296.13 | 557 | 539 | 136.0 |
| D | 2 | 14 | 170795 | 1251.92 | 557 | 539 | 136.0 |
| D | 7 | 71 | 65778 | 479.71 | 557 | 539 | 136.0 |
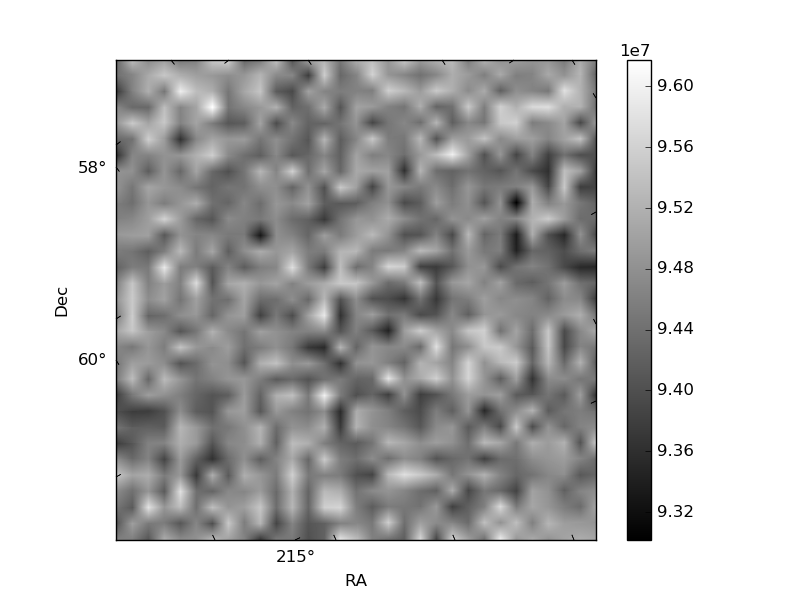
Histogram calculated using DETX and DETY for each event in the final _common_clean file
| Quadrant A |  |
 |
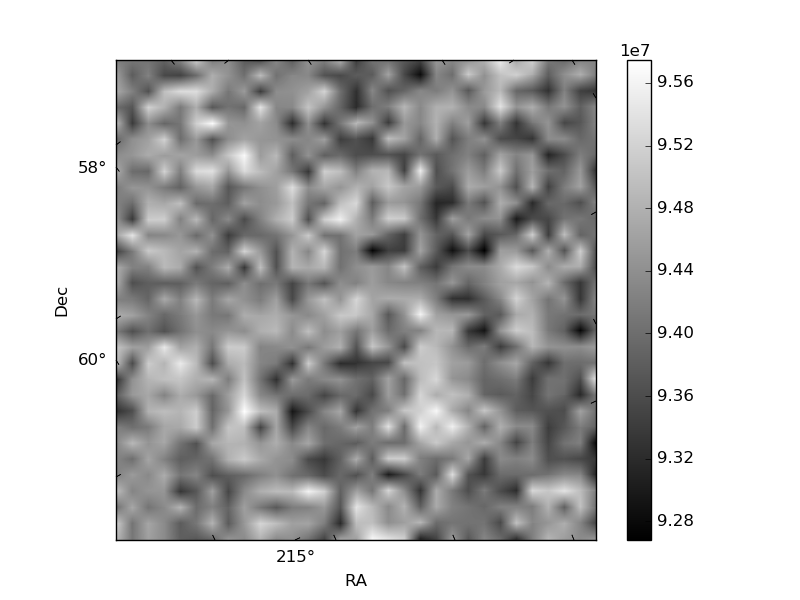
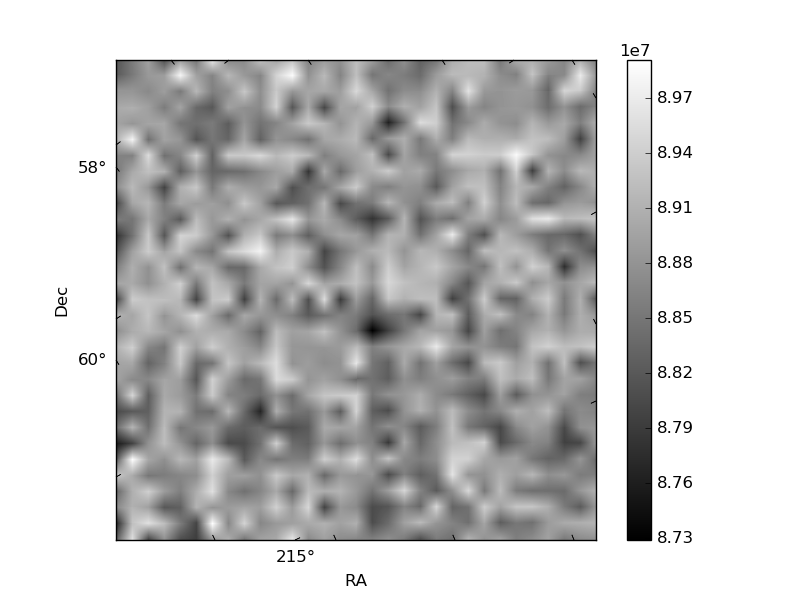
Quadrant B |
|---|---|---|---|
| Quadrant D |  |
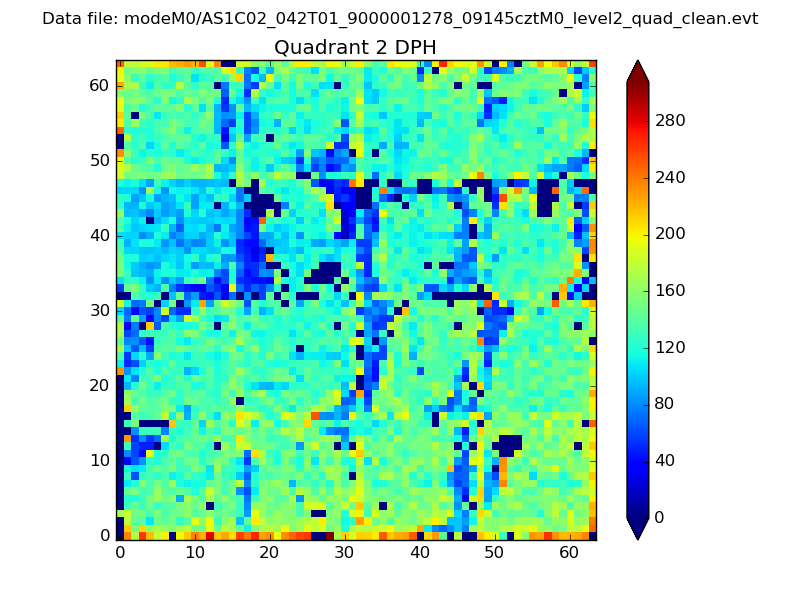 |
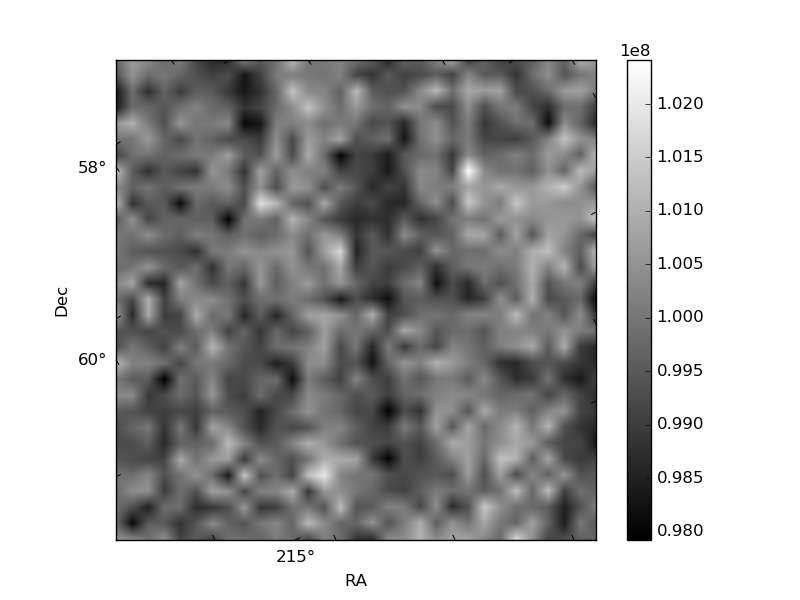
Quadrant C |
| Plot type | Count rate plots | Images |
|---|---|---|
| Comparison with Poisson distribution Blue bars denote a histogram of data divided into 1 sec bins. Red curve is a Poisson curve with rate = median count rate of data. |
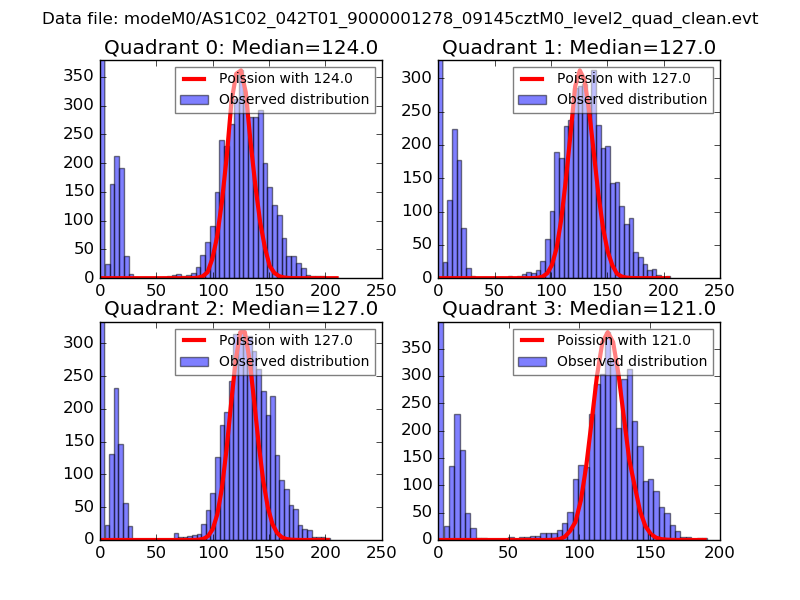 |
 |
| Quadrant-wise count rates Data is divided into 100 sec bins |
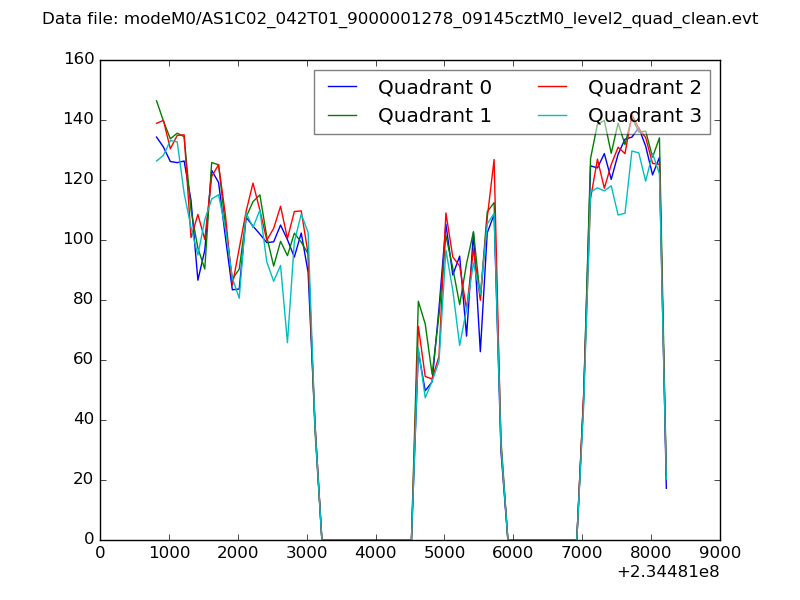 |
|
| Module-wise count rates for Quadrant A Data is divided into 100 sec bins |
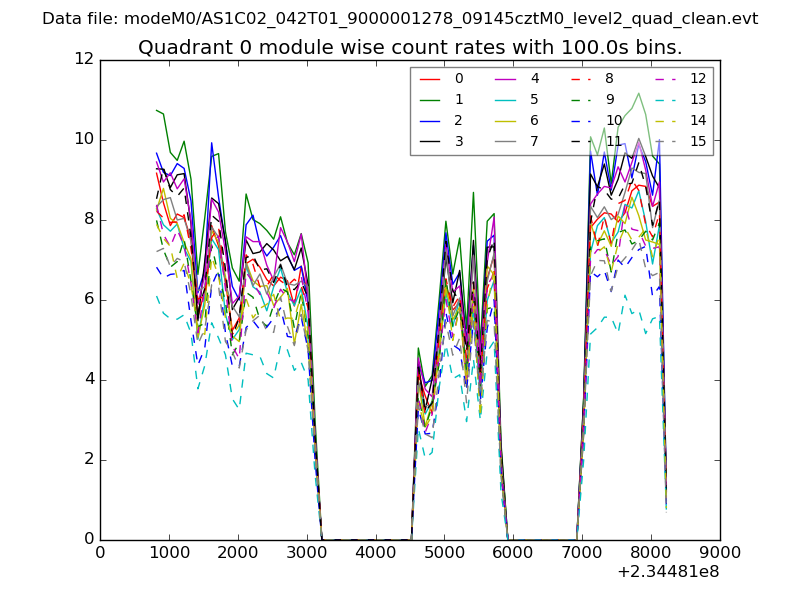 |
 |
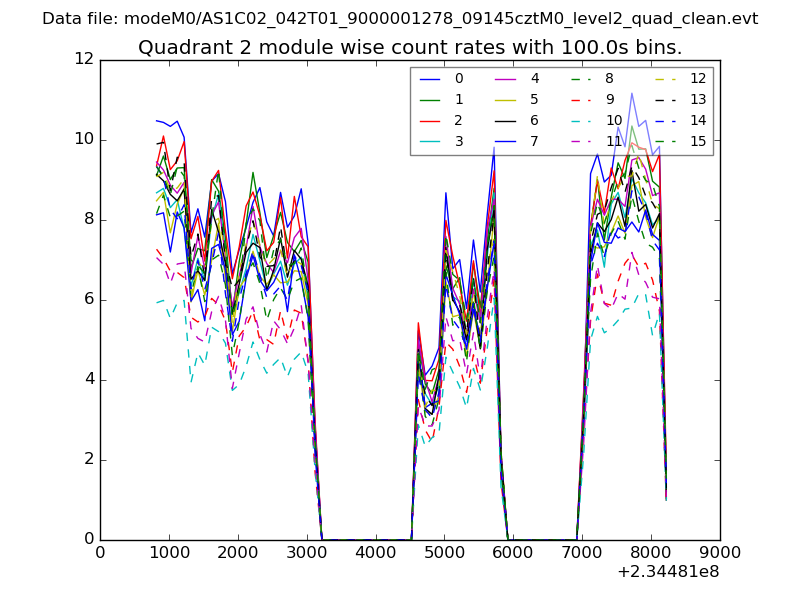
| Module-wise count rates for Quadrant B Data is divided into 100 sec bins |
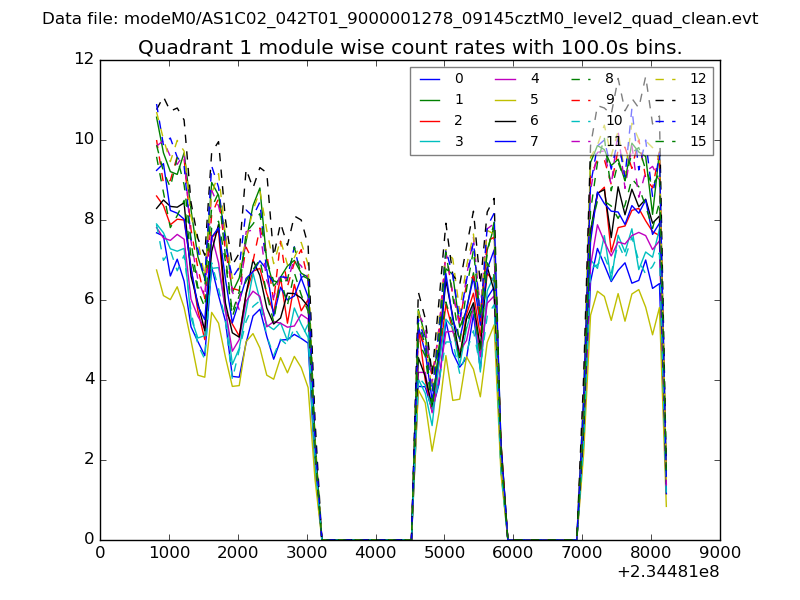 |
 |
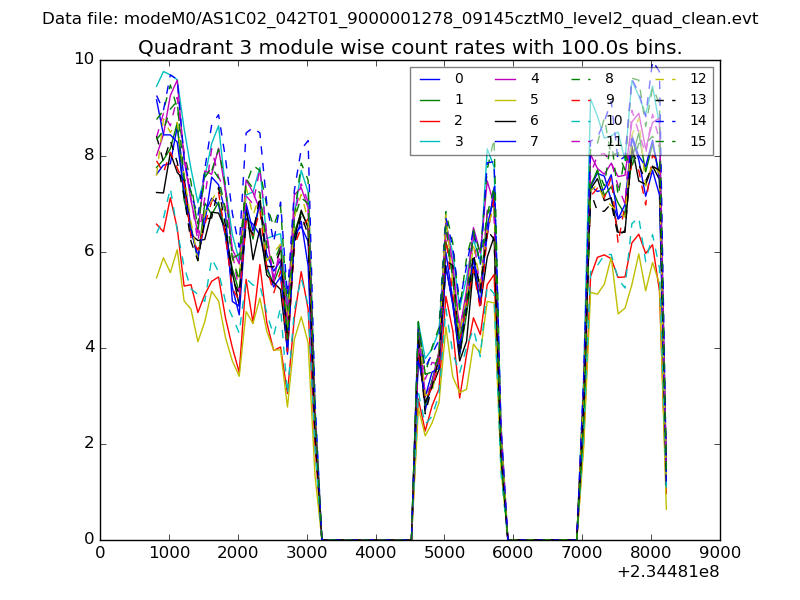
| Module-wise count rates for Quadrant C Data is divided into 100 sec bins |
 |
 |
| Module-wise count rates for Quadrant D Data is divided into 100 sec bins |
 |
 |
| Parameter | Plot |
|---|---|
| CZT HV Monitor |  |
| D_VDD | 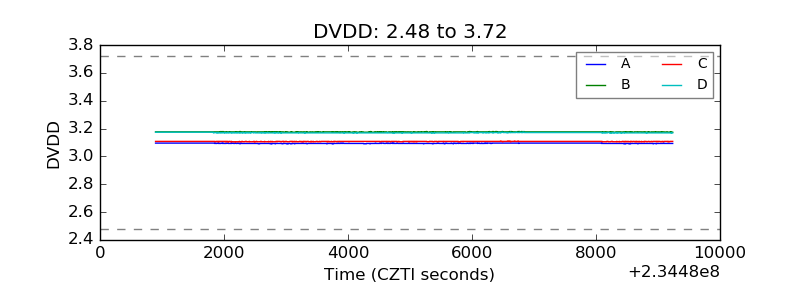 |
| Temperature 1 | 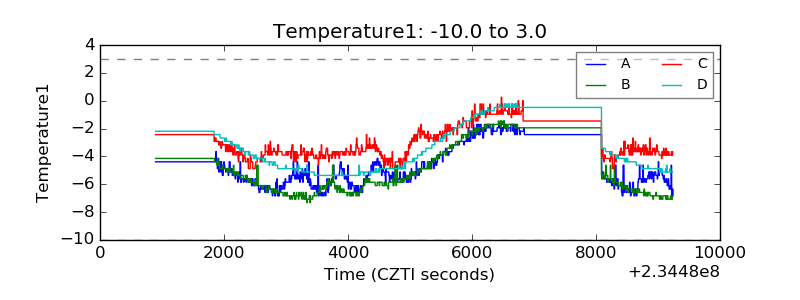 |
| Veto HV Monitor | 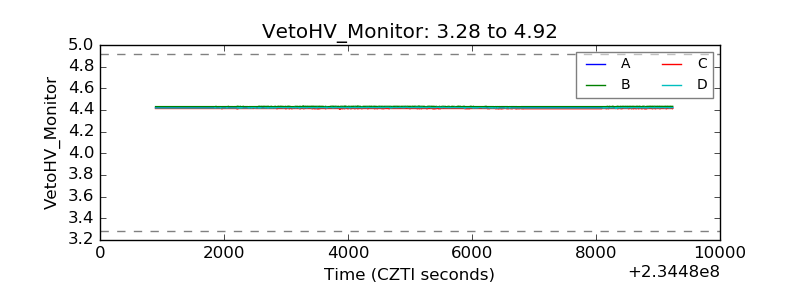 |
| Veto LLD | 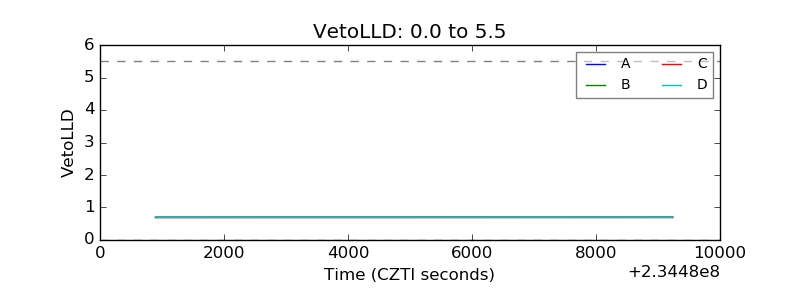 |
| Alpha Counter | 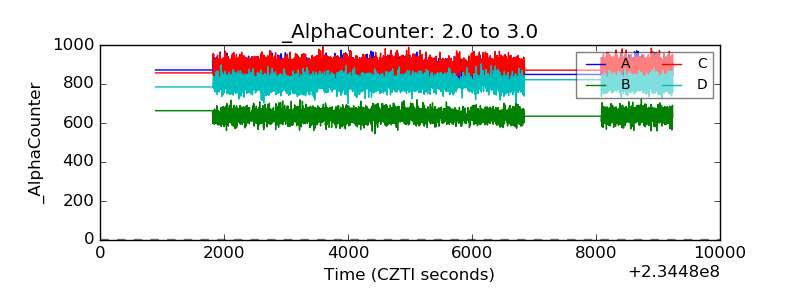 |
| _CPM_Rate | 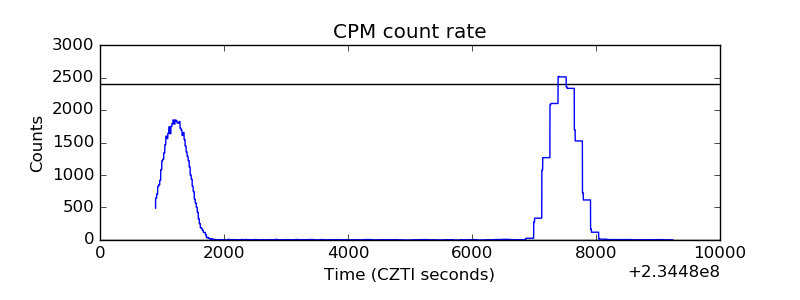 |
| CZT Counter | 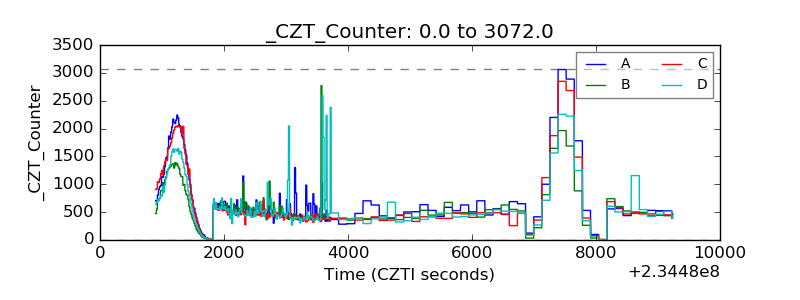 |
| +2.5 Volts monitor |  |
| +5 Volts monitor | 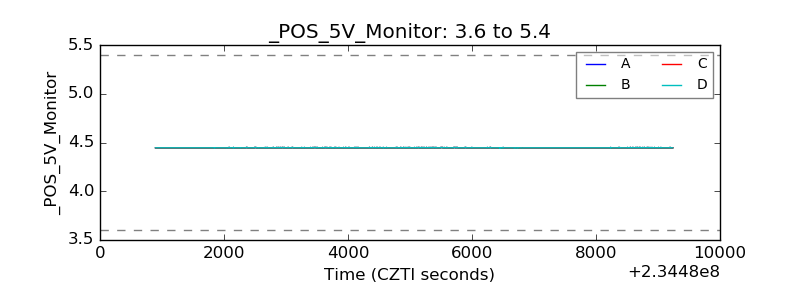 |
| _ROLL_ROT | 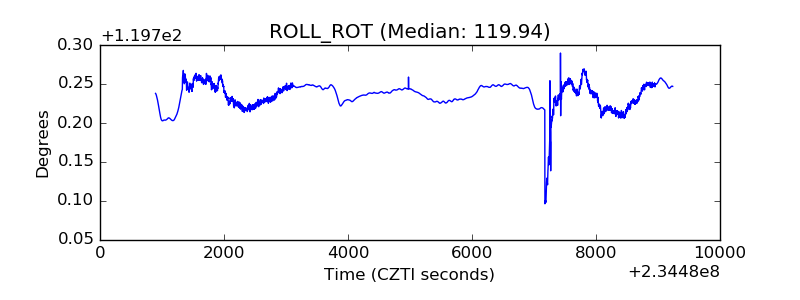 |
| _Roll_DEC | 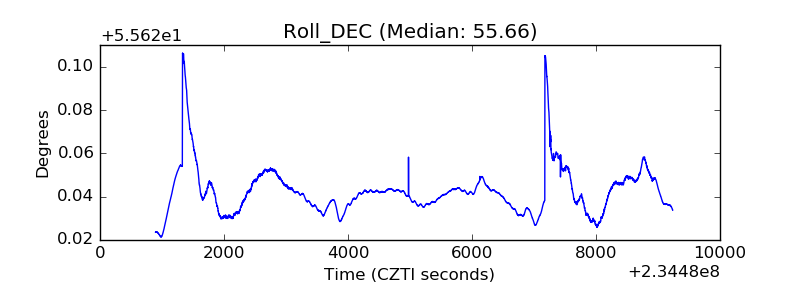 |
| _Roll_RA | 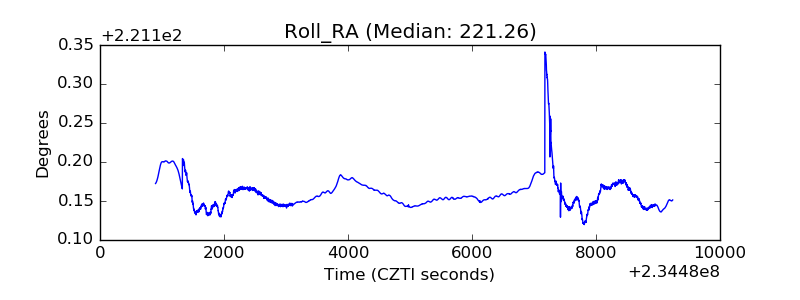 |
| Veto Counter | 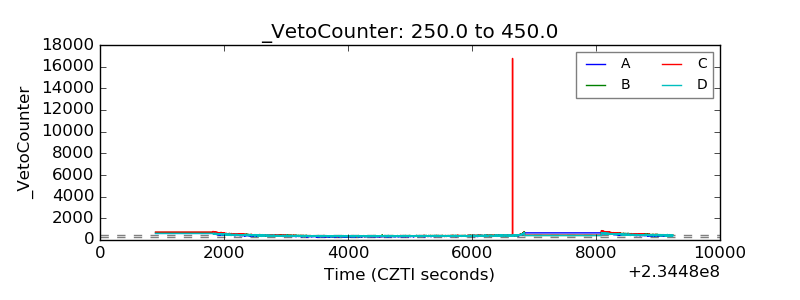 |