| Param | Original file | Final file |
|---|---|---|
| Filename | modeM0/AS1C02_042T01_9000001278_09146cztM0_level2.evt | modeM0/AS1C02_042T01_9000001278_09146cztM0_level2_quad_clean.evt |
| Size (bytes) | 686,085,120 | 143,527,680 |
| Size | 654.3 MB | 136.9 MB |
| Events in quadrant A | 5,345,190 | 919,465 |
| Events in quadrant B | 4,612,207 | 950,195 |
| Events in quadrant C | 4,369,027 | 940,162 |
| Events in quadrant D | 5,790,764 | 861,800 |
| Mode M0 | |||
|---|---|---|---|
| Quadrant | BADHDUFLAG | Total packets | Discarded packets |
| A | 0 | 24918 | 2759 |
| B | 0 | 22873 | 2559 |
| C | 0 | 22417 | 2493 |
| D | 0 | 27845 | 3706 |
| Mode M9 | |||
|---|---|---|---|
| Quadrant | BADHDUFLAG | Total packets | Discarded packets |
| A | 0 | 26 | 5 |
| B | 0 | 26 | 3 |
| C | 0 | 26 | 8 |
| D | 0 | 26 | 6 |
| Mode SS | |||
|---|---|---|---|
| Quadrant | BADHDUFLAG | Total packets | Discarded packets |
| A | 0 | 222 | 30 |
| B | 0 | 222 | 26 |
| C | 0 | 222 | 20 |
| D | 0 | 222 | 24 |
| Quadrant | Total seconds | Saturated seconds | Saturation percentage |
|---|---|---|---|
| A | 9739 | 63 | 0.646884% |
| B | 9773 | 35 | 0.358130% |
| C | 9779 | 17 | 0.173842% |
| D | 9644 | 473 | 4.904604% |
Noise dominated data is calculated using 1-second bins in cleaned event files. If a bin has >2000 counts, and if more than 50% of those come from <1% of pixels, then it is considered to be noise-dominated and hence unusable.
| Quadrant | # 1 sec bins | Bins with >0 counts | Bins with >2000 counts | High rate bins dominated by noise | Noise dominated (total time) | Noise dominated (detector-on time) | Marked lightcurve |
|---|---|---|---|---|---|---|---|
| A | 13528 | 10349 | 31 | 31 | 0.23% | 0.30% | 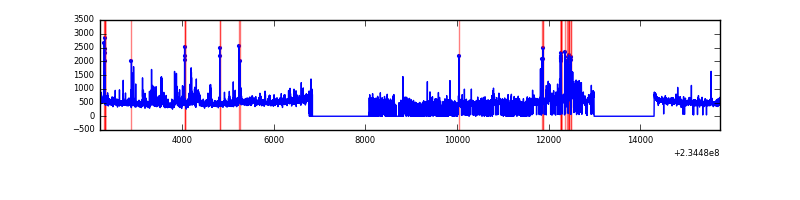 |
| B | 13528 | 10339 | 9 | 9 | 0.07% | 0.09% | 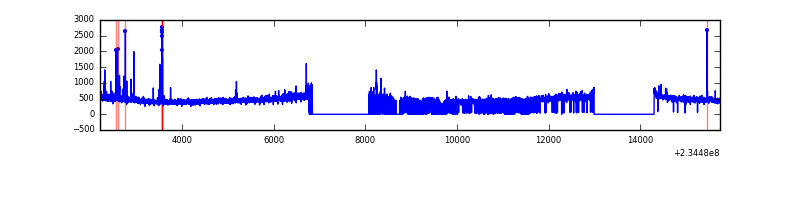 |
| C | 13528 | 10378 | 0 | 0 | 0.00% | 0.00% | 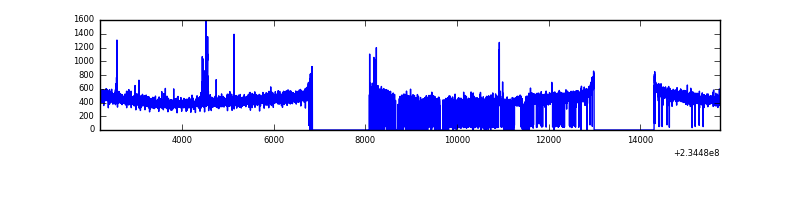 |
| D | 13528 | 10239 | 431 | 431 | 3.19% | 4.21% | 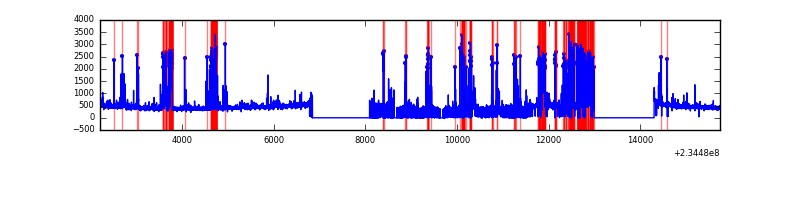 |
Top three noisy pixels from each quadrant. If the there are fewer than three noisy pixels in the level2.evt file, extra rows are filled as -1
| Pixel properties | Quadrant properties | ||||||
|---|---|---|---|---|---|---|---|
| Quadrant | DetID | PixID | Counts | Sigma | Mean | Median | Sigma |
| A | 8 | 5 | 856249 | 3791.87 | 1123 | 1103 | 225.5 |
| A | 13 | 251 | 66055 | 288.01 | 1123 | 1103 | 225.5 |
| A | 1 | 162 | 45884 | 198.57 | 1123 | 1103 | 225.5 |
| B | 0 | 219 | 64357 | 299.09 | 1143 | 1116 | 211.4 |
| B | 4 | 80 | 35161 | 161.01 | 1143 | 1116 | 211.4 |
| B | 4 | 48 | 27953 | 126.92 | 1143 | 1116 | 211.4 |
| C | 4 | 239 | 38695 | 148.1 | 1108 | 1114 | 253.8 |
| C | 13 | 61 | 8533 | 29.24 | 1108 | 1114 | 253.8 |
| C | 9 | 68 | 5363 | 16.74 | 1108 | 1114 | 253.8 |
| D | 1 | 52 | 1132177 | 4403.41 | 1060 | 1026 | 256.9 |
| D | 2 | 14 | 434807 | 1688.65 | 1060 | 1026 | 256.9 |
| D | 7 | 71 | 84775 | 326.02 | 1060 | 1026 | 256.9 |
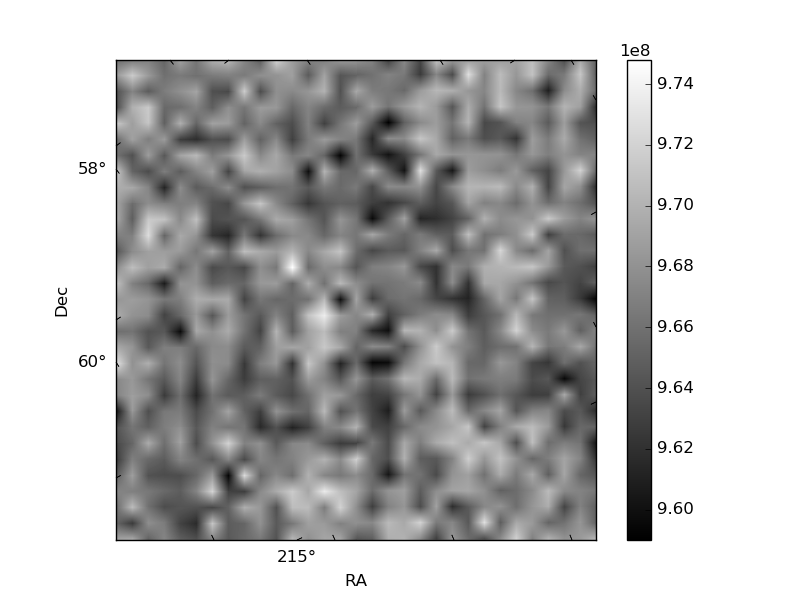
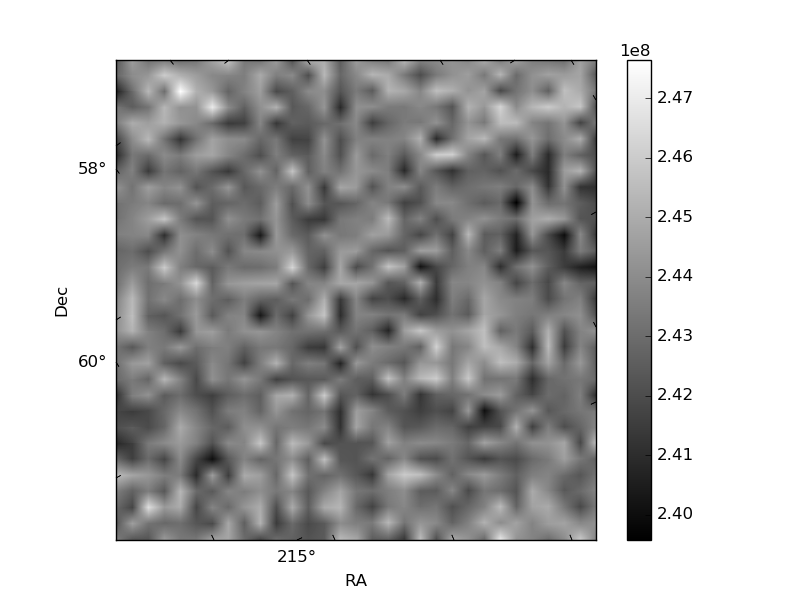
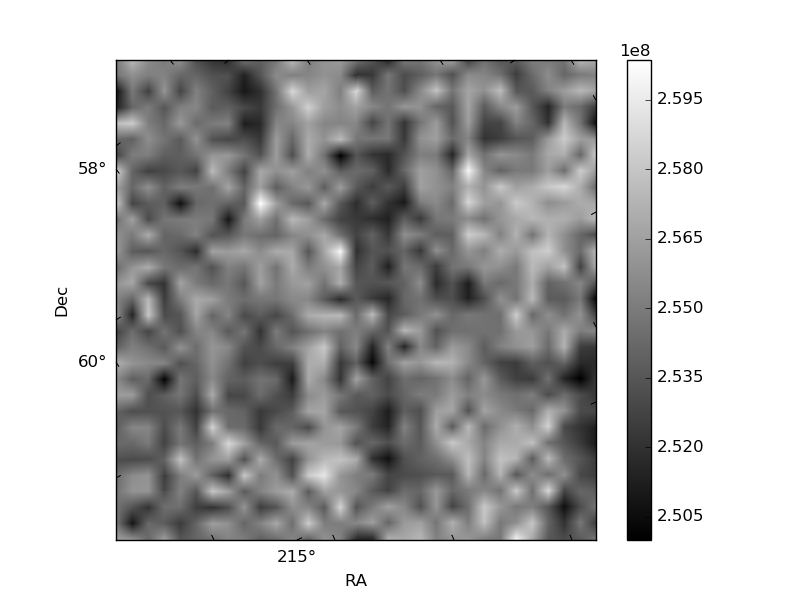
Histogram calculated using DETX and DETY for each event in the final _common_clean file
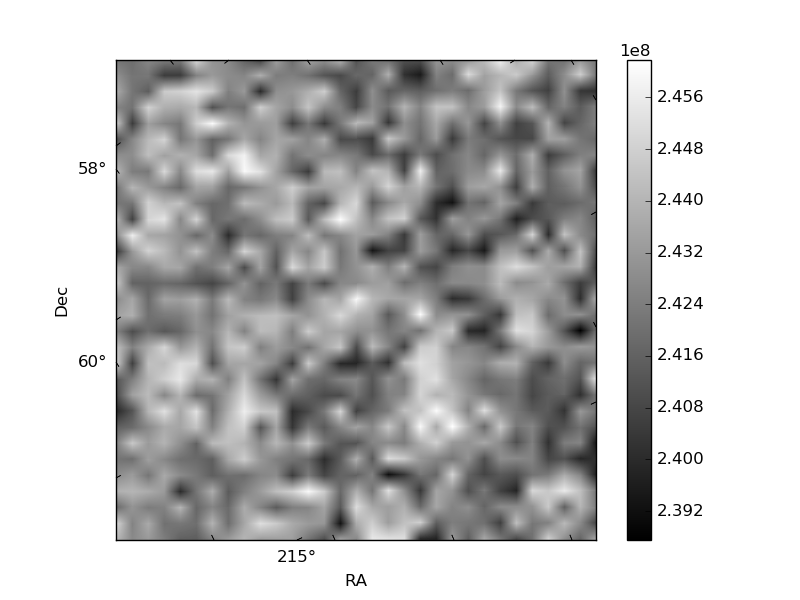
| Quadrant A | 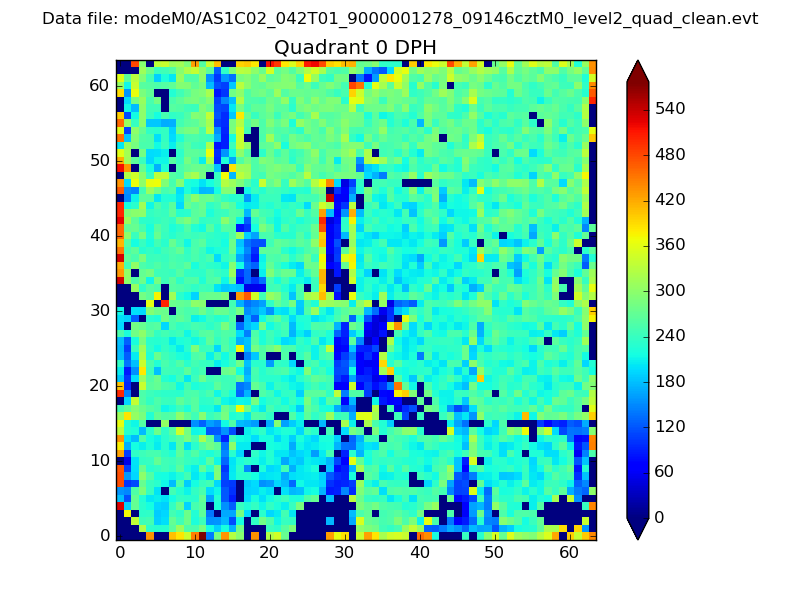 |
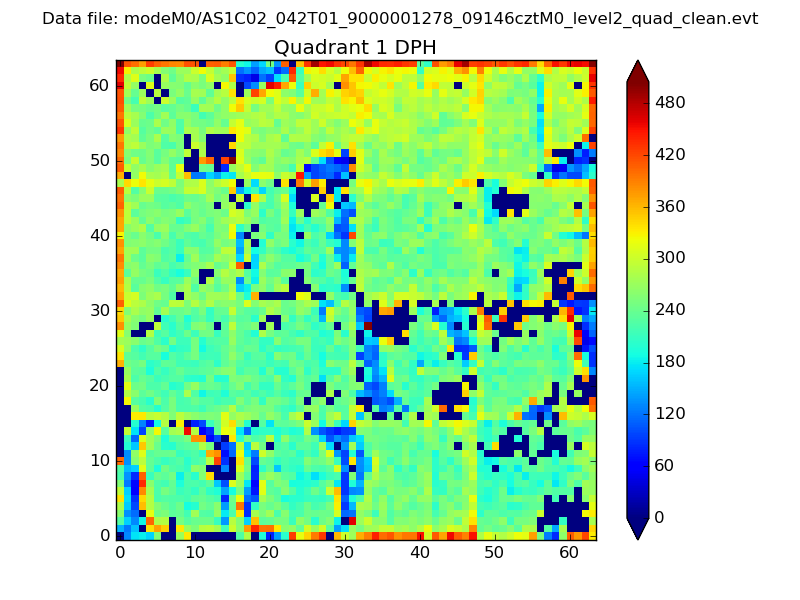 |
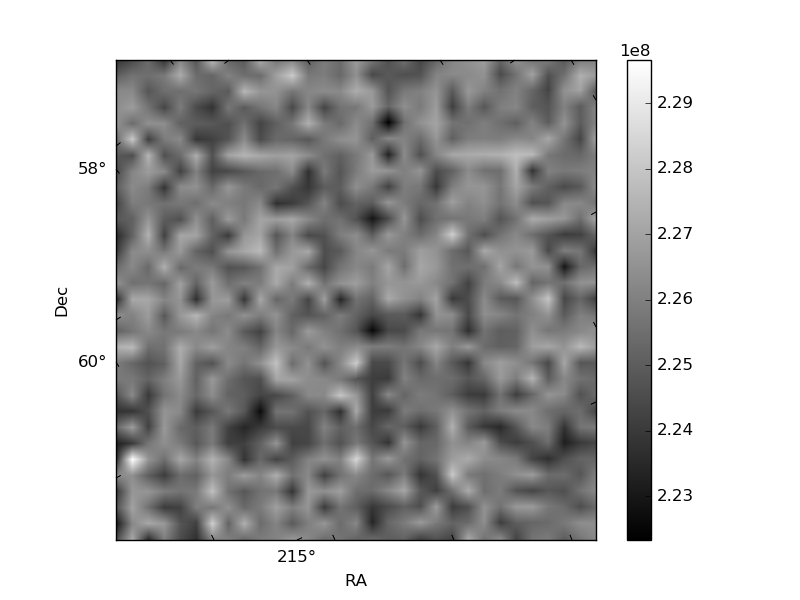
Quadrant B |
|---|---|---|---|
| Quadrant D |  |
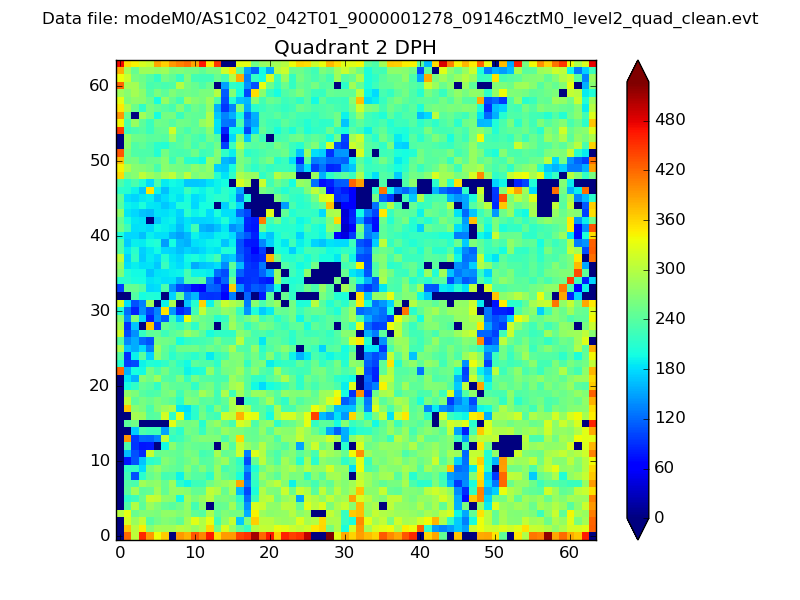 |
Quadrant C |
| Plot type | Count rate plots | Images |
|---|---|---|
| Comparison with Poisson distribution Blue bars denote a histogram of data divided into 1 sec bins. Red curve is a Poisson curve with rate = median count rate of data. |
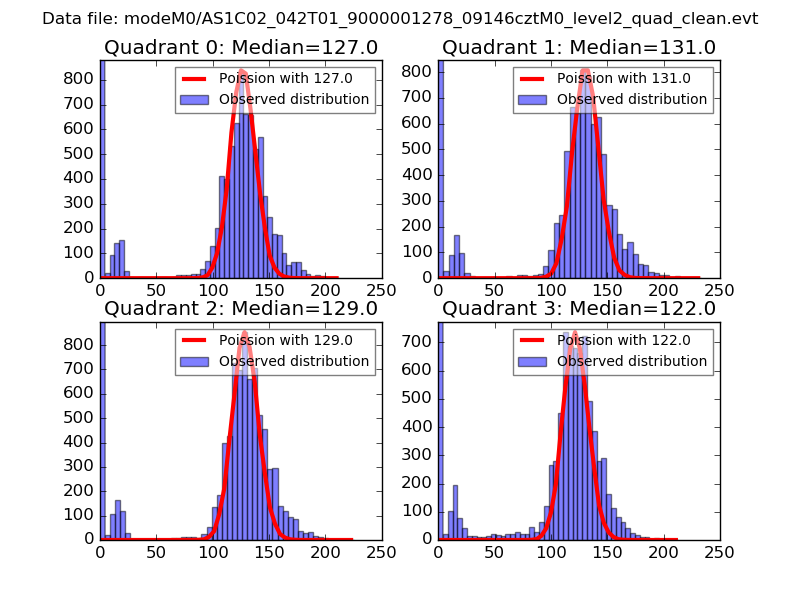 |
 |
| Quadrant-wise count rates Data is divided into 100 sec bins |
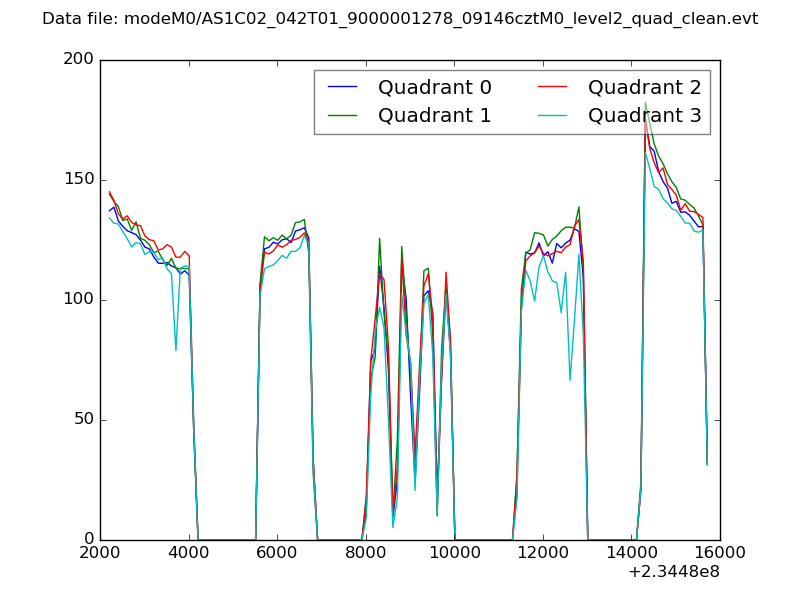 |
|
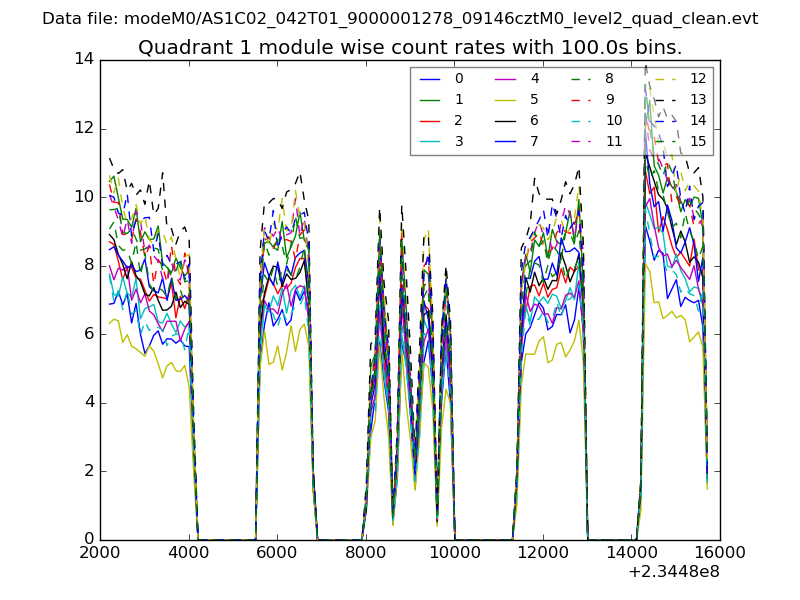
| Module-wise count rates for Quadrant A Data is divided into 100 sec bins |
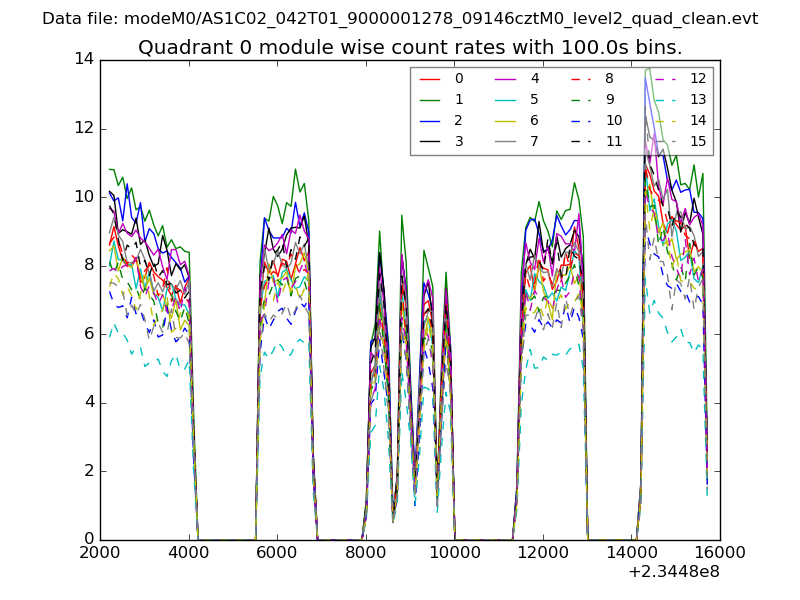 |
 |
| Module-wise count rates for Quadrant B Data is divided into 100 sec bins |
 |
 |
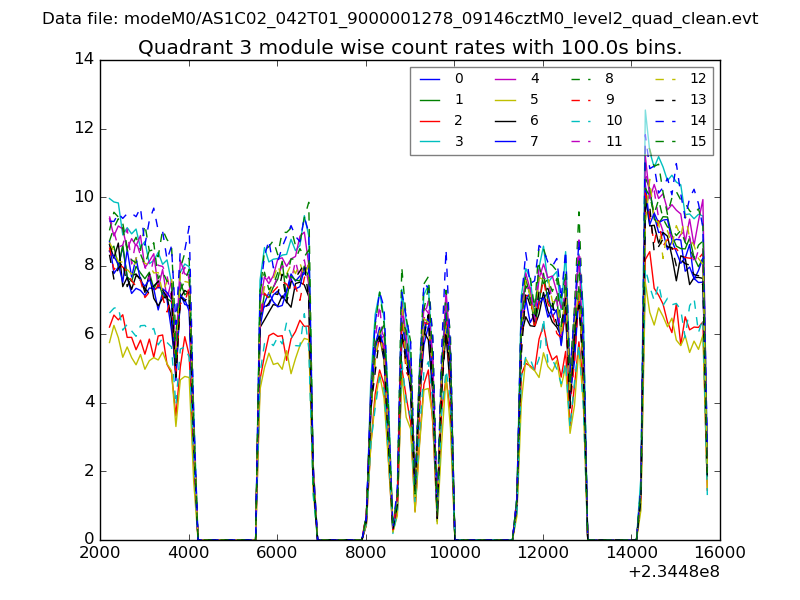
| Module-wise count rates for Quadrant C Data is divided into 100 sec bins |
 |
 |
| Module-wise count rates for Quadrant D Data is divided into 100 sec bins |
 |
 |
| Parameter | Plot |
|---|---|
| CZT HV Monitor | 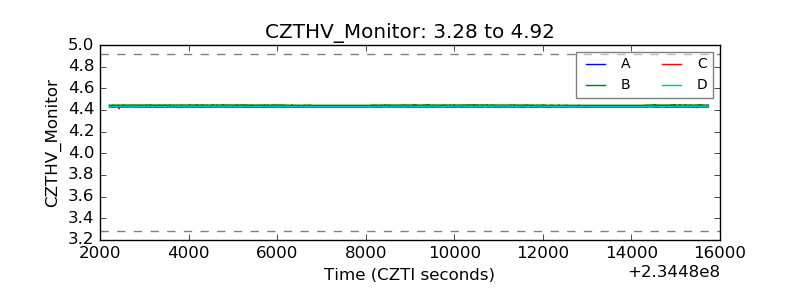 |
| D_VDD | 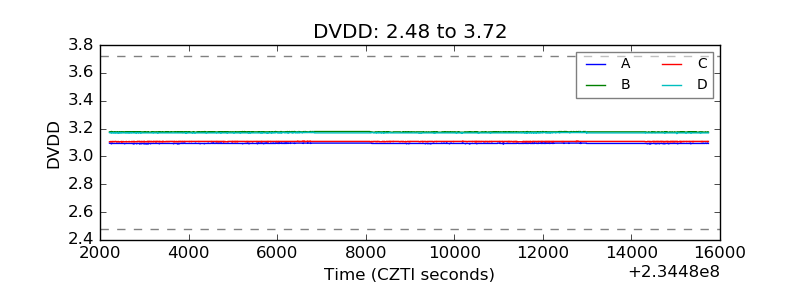 |
| Temperature 1 | 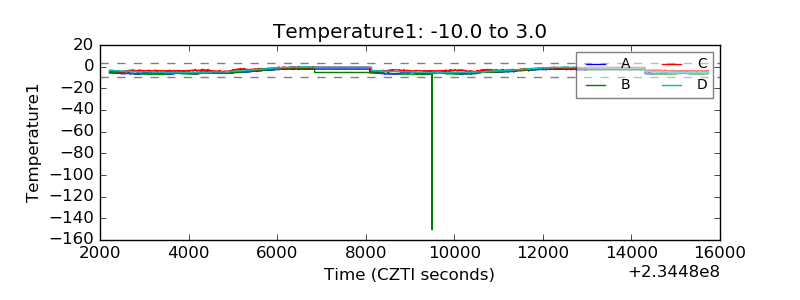 |
| Veto HV Monitor | 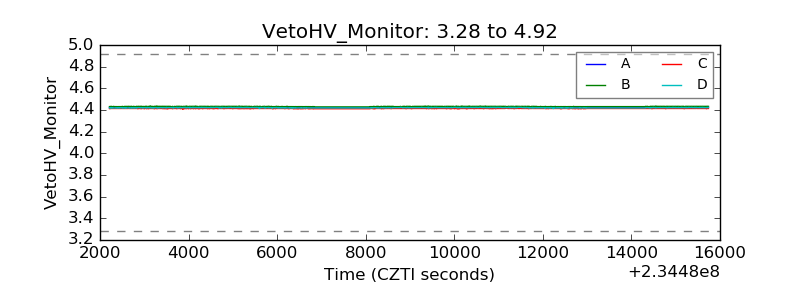 |
| Veto LLD | 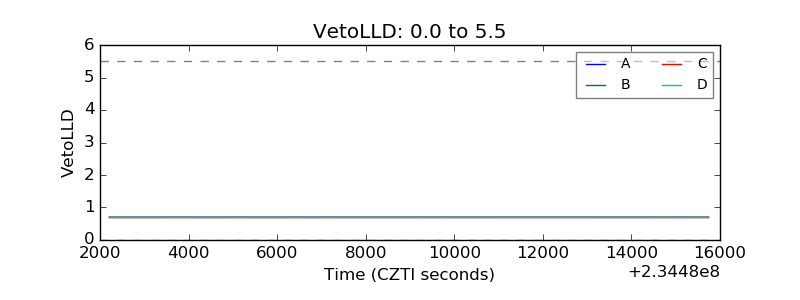 |
| Alpha Counter | 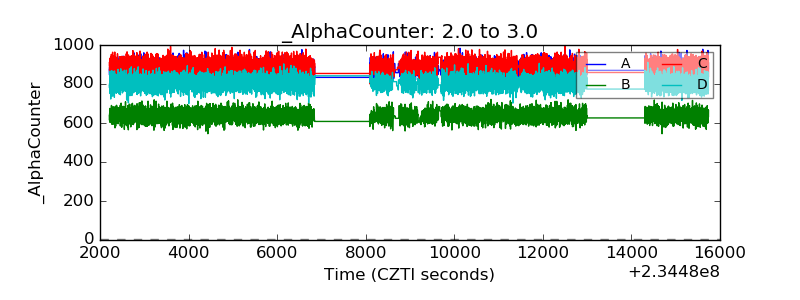 |
| _CPM_Rate | 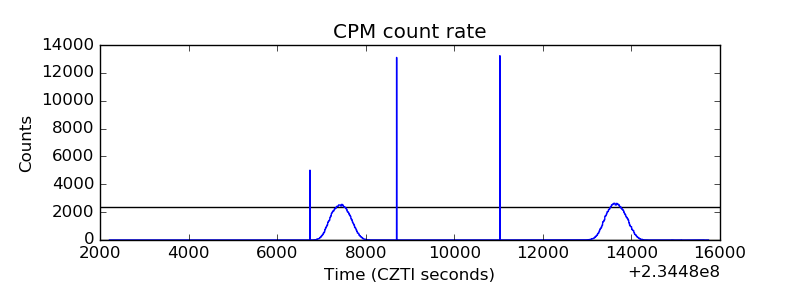 |
| CZT Counter |  |
| +2.5 Volts monitor |  |
| +5 Volts monitor | 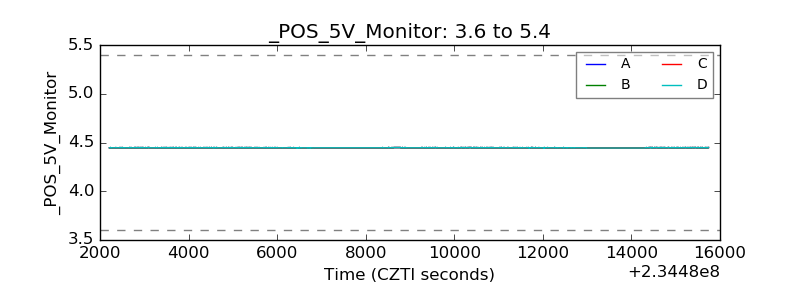 |
| _ROLL_ROT | 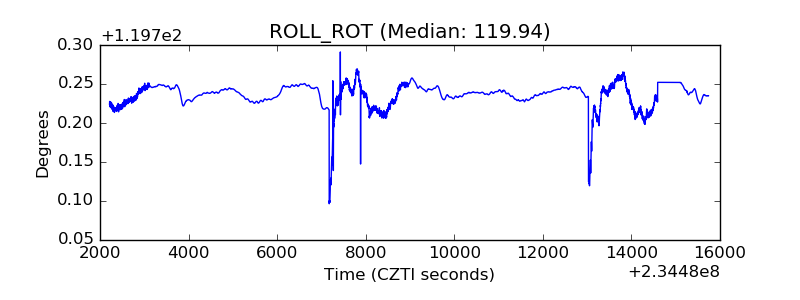 |
| _Roll_DEC | 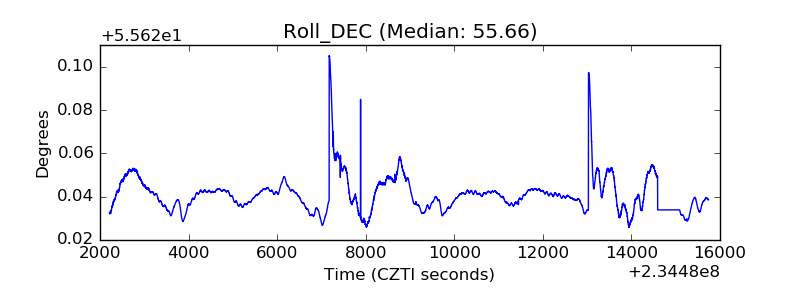 |
| _Roll_RA | 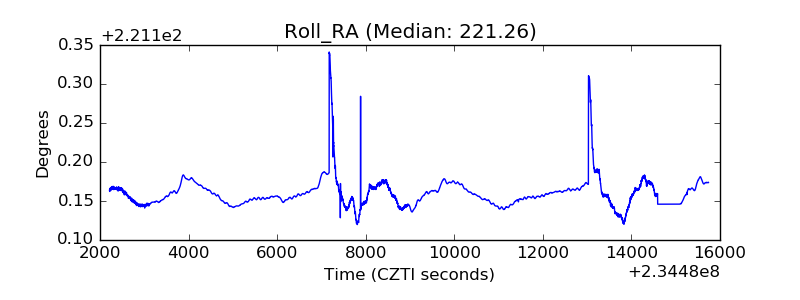 |
| Veto Counter | 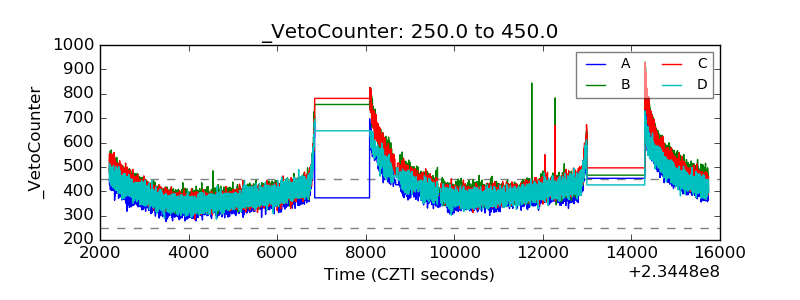 |