| Param | Original file | Final file |
|---|---|---|
| Filename | modeM0/AS1C02_042T01_9000001278_09147cztM0_level2.evt | modeM0/AS1C02_042T01_9000001278_09147cztM0_level2_quad_clean.evt |
| Size (bytes) | 422,654,400 | 99,288,000 |
| Size | 403.1 MB | 94.7 MB |
| Events in quadrant A | 3,228,079 | 643,361 |
| Events in quadrant B | 3,118,149 | 662,428 |
| Events in quadrant C | 2,931,927 | 644,027 |
| Events in quadrant D | 3,089,519 | 613,438 |
| Mode M0 | |||
|---|---|---|---|
| Quadrant | BADHDUFLAG | Total packets | Discarded packets |
| A | 0 | 13435 | 3 |
| B | 0 | 13293 | 2 |
| C | 0 | 13025 | 2 |
| D | 0 | 13701 | 2 |
| Mode M9 | |||
|---|---|---|---|
| Quadrant | BADHDUFLAG | Total packets | Discarded packets |
| A | 0 | 20 | 0 |
| B | 0 | 20 | 0 |
| C | 0 | 20 | 0 |
| D | 0 | 21 | 0 |
| Mode SS | |||
|---|---|---|---|
| Quadrant | BADHDUFLAG | Total packets | Discarded packets |
| A | 0 | 128 | 0 |
| B | 0 | 128 | 0 |
| C | 0 | 128 | 0 |
| D | 0 | 128 | 0 |
| Quadrant | Total seconds | Saturated seconds | Saturation percentage |
|---|---|---|---|
| A | 6364 | 32 | 0.502828% |
| B | 6364 | 42 | 0.659962% |
| C | 6364 | 23 | 0.361408% |
| D | 6364 | 22 | 0.345695% |
Noise dominated data is calculated using 1-second bins in cleaned event files. If a bin has >2000 counts, and if more than 50% of those come from <1% of pixels, then it is considered to be noise-dominated and hence unusable.
| Quadrant | # 1 sec bins | Bins with >0 counts | Bins with >2000 counts | High rate bins dominated by noise | Noise dominated (total time) | Noise dominated (detector-on time) | Marked lightcurve |
|---|---|---|---|---|---|---|---|
| A | 7709 | 6365 | 0 | 0 | 0.00% | 0.00% | 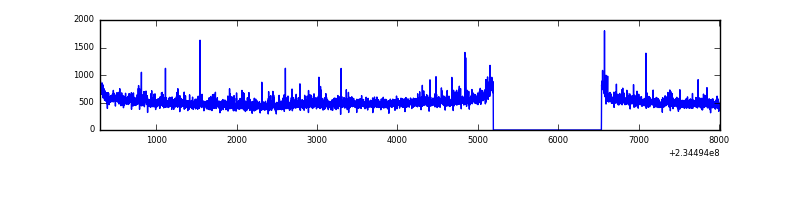 |
| B | 7709 | 6365 | 3 | 3 | 0.04% | 0.05% | 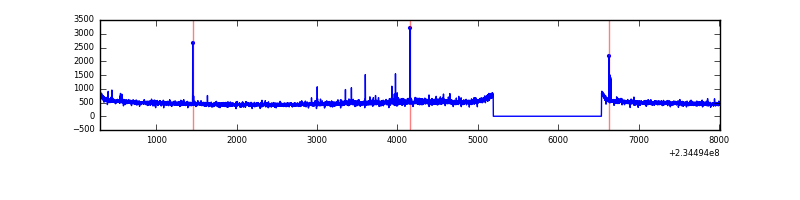 |
| C | 7709 | 6365 | 0 | 0 | 0.00% | 0.00% | 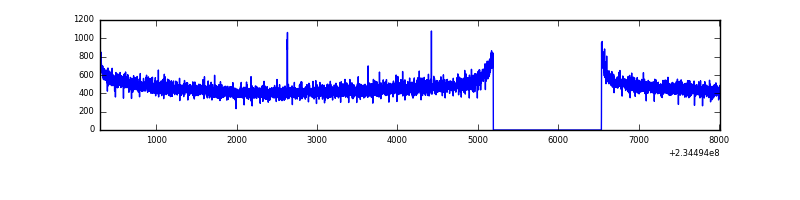 |
| D | 7709 | 6365 | 11 | 11 | 0.14% | 0.17% | 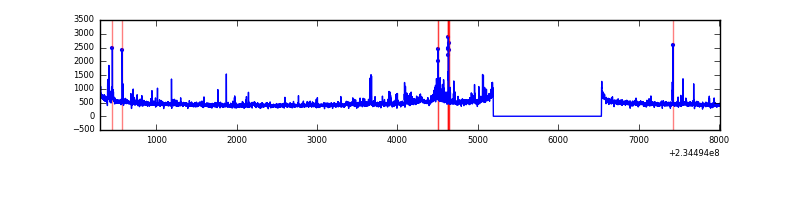 |
Top three noisy pixels from each quadrant. If the there are fewer than three noisy pixels in the level2.evt file, extra rows are filled as -1
| Pixel properties | Quadrant properties | ||||||
|---|---|---|---|---|---|---|---|
| Quadrant | DetID | PixID | Counts | Sigma | Mean | Median | Sigma |
| A | 8 | 5 | 159326 | 1019.63 | 771 | 756 | 155.5 |
| A | 1 | 162 | 53355 | 338.22 | 771 | 756 | 155.5 |
| A | 13 | 248 | 14108 | 85.86 | 771 | 756 | 155.5 |
| B | 0 | 214 | 61227 | 416.24 | 782 | 764 | 145.3 |
| B | 12 | 111 | 15499 | 101.44 | 782 | 764 | 145.3 |
| B | 11 | 111 | 12506 | 80.83 | 782 | 764 | 145.3 |
| C | 13 | 61 | 5669 | 28.64 | 750 | 755 | 171.6 |
| C | 9 | 68 | 4556 | 22.15 | 750 | 755 | 171.6 |
| C | 4 | 239 | 4323 | 20.79 | 750 | 755 | 171.6 |
| D | 1 | 52 | 94545 | 481.89 | 734 | 717 | 194.7 |
| D | 13 | 104 | 70972 | 360.82 | 734 | 717 | 194.7 |
| D | 6 | 225 | 42320 | 213.67 | 734 | 717 | 194.7 |
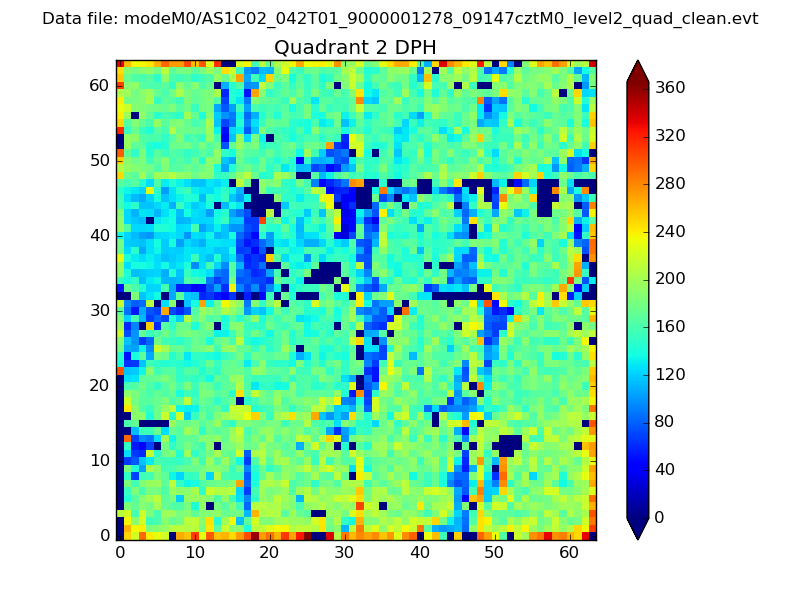
Histogram calculated using DETX and DETY for each event in the final _common_clean file
| Quadrant A | 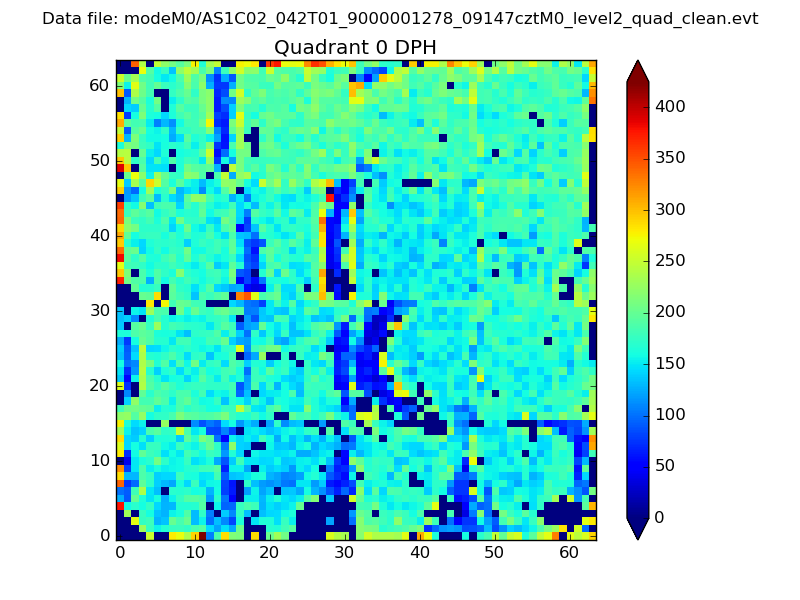 |
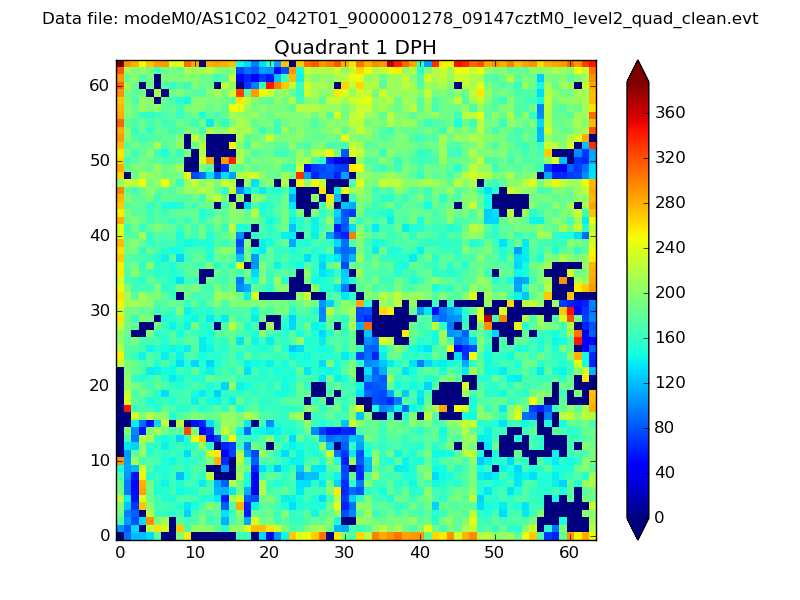 |
Quadrant B |
|---|---|---|---|
| Quadrant D | 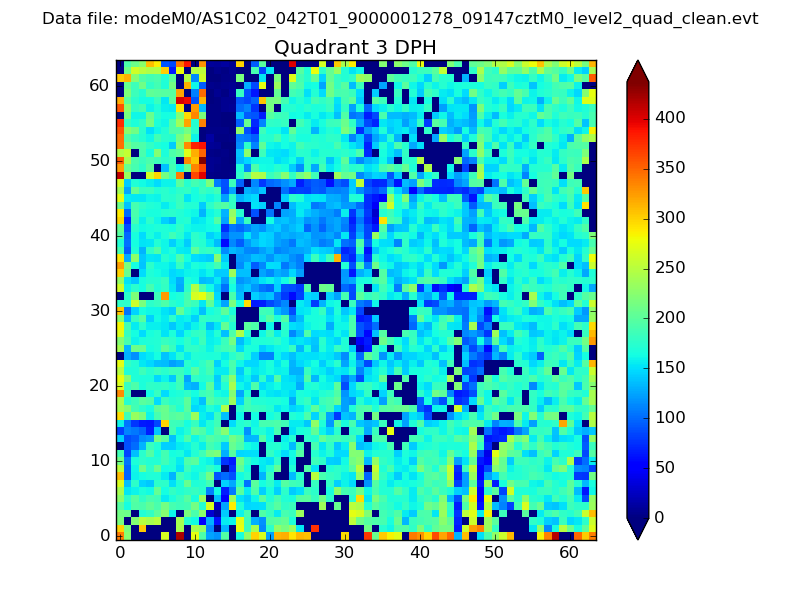 |
 |
Quadrant C |
| Plot type | Count rate plots | Images |
|---|---|---|
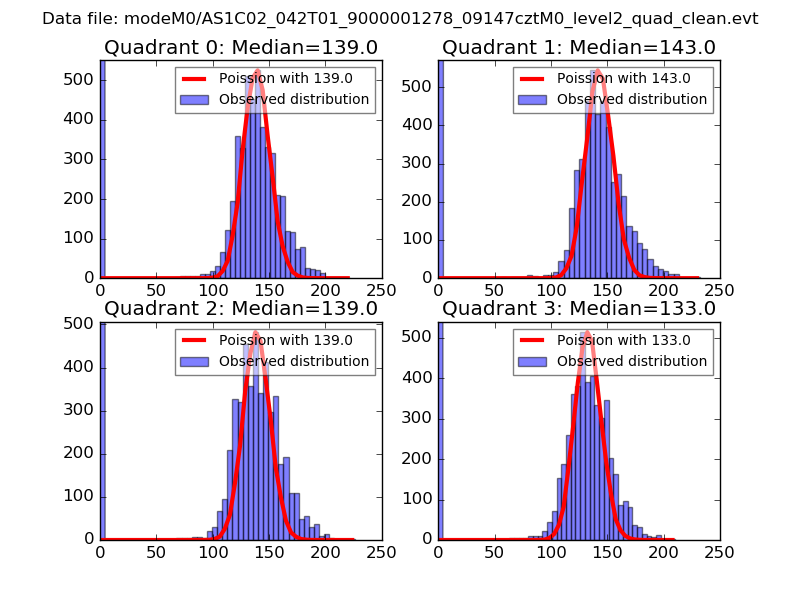
| Comparison with Poisson distribution Blue bars denote a histogram of data divided into 1 sec bins. Red curve is a Poisson curve with rate = median count rate of data. |
 |
 |
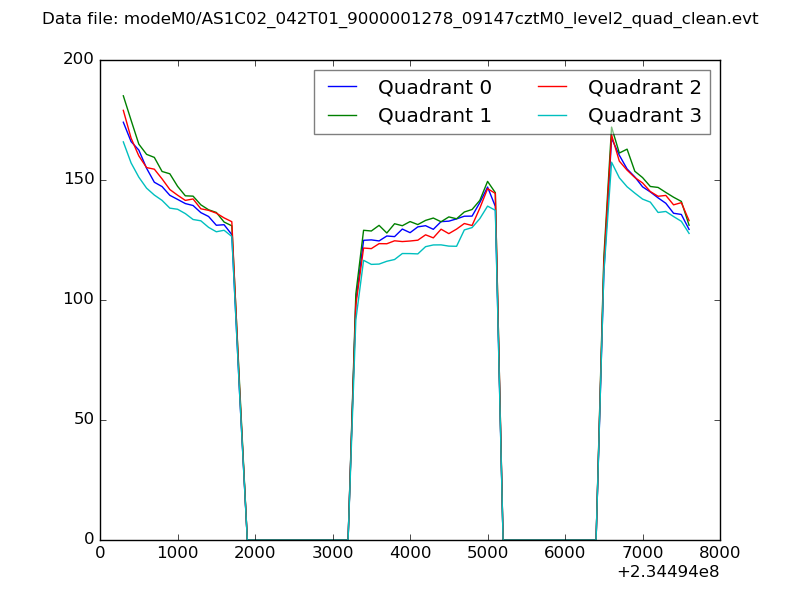
| Quadrant-wise count rates Data is divided into 100 sec bins |
 |
|
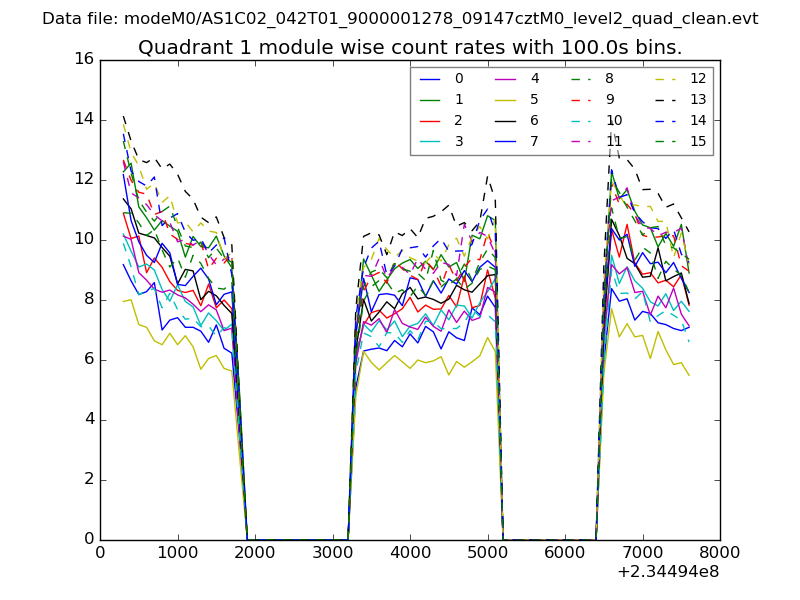
| Module-wise count rates for Quadrant A Data is divided into 100 sec bins |
 |
 |
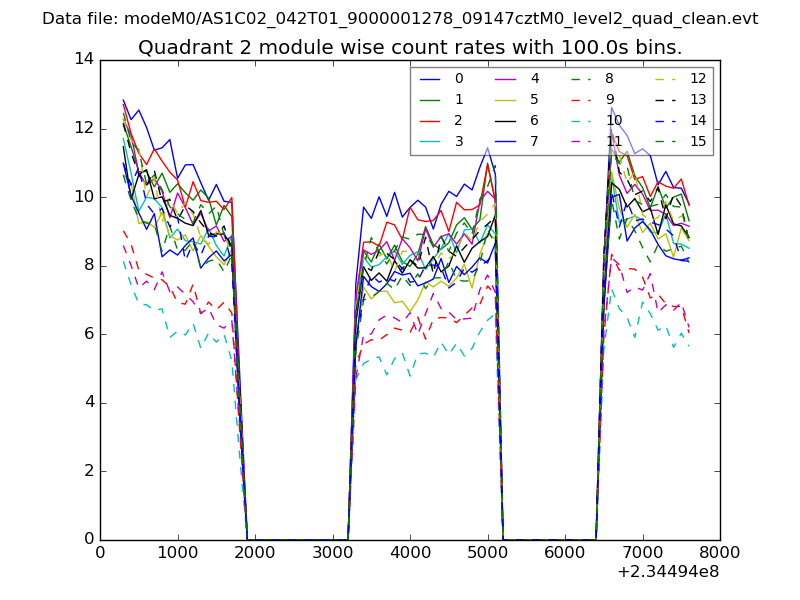
| Module-wise count rates for Quadrant B Data is divided into 100 sec bins |
 |
 |
| Module-wise count rates for Quadrant C Data is divided into 100 sec bins |
 |
 |
| Module-wise count rates for Quadrant D Data is divided into 100 sec bins |
 |
 |
| Parameter | Plot |
|---|---|
| CZT HV Monitor | 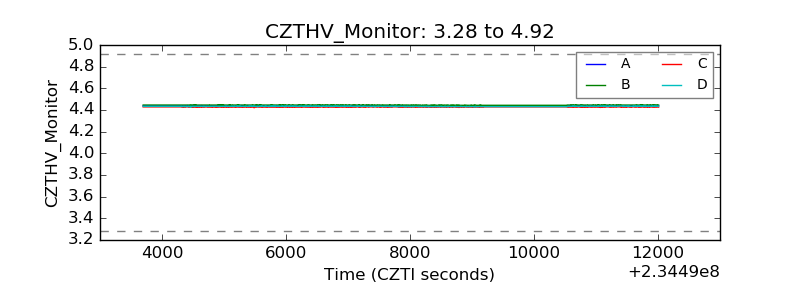 |
| D_VDD |  |
| Temperature 1 | 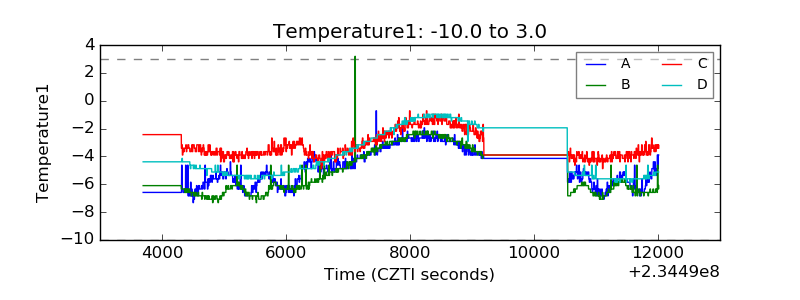 |
| Veto HV Monitor | 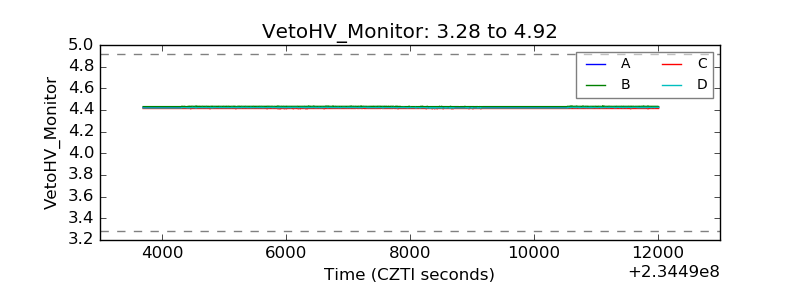 |
| Veto LLD |  |
| Alpha Counter | 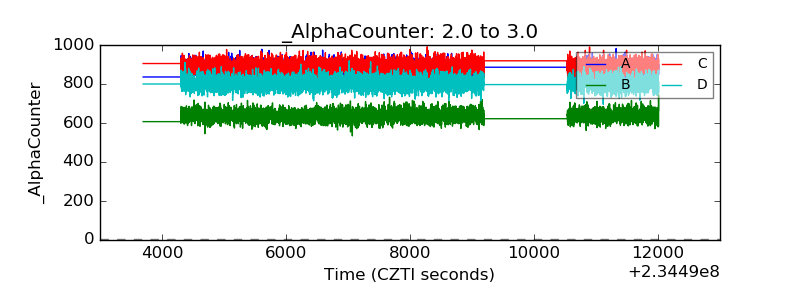 |
| _CPM_Rate | 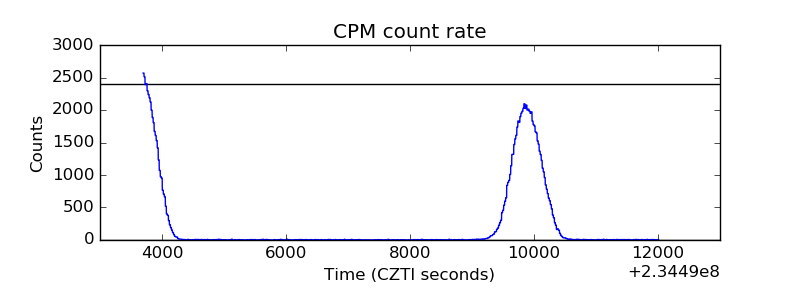 |
| CZT Counter | 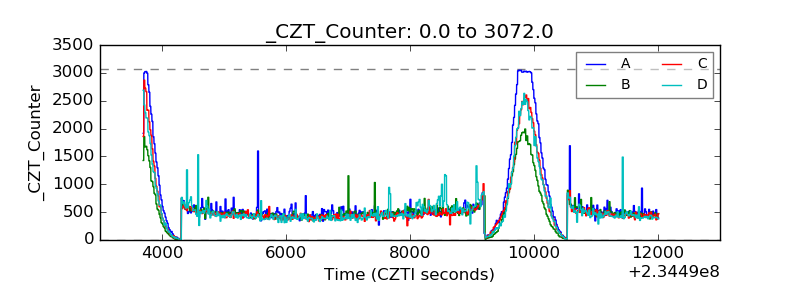 |
| +2.5 Volts monitor |  |
| +5 Volts monitor |  |
| _ROLL_ROT | 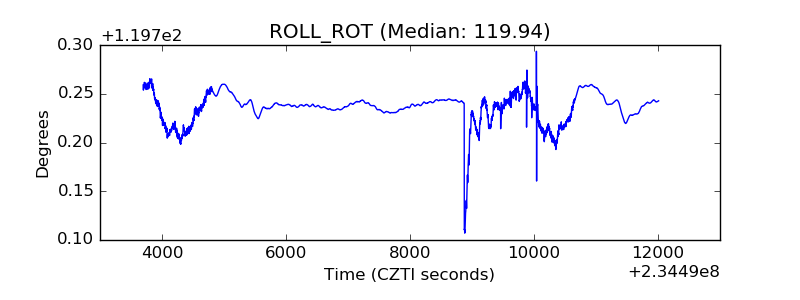 |
| _Roll_DEC | 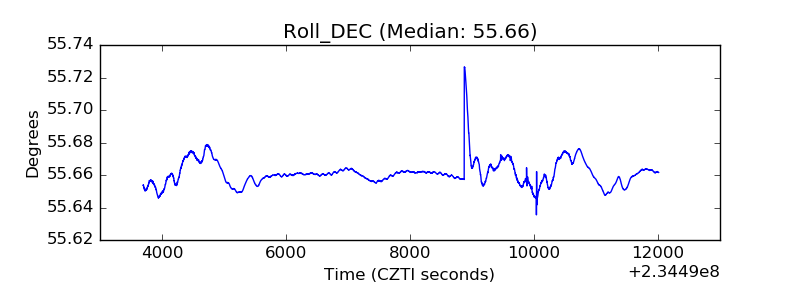 |
| _Roll_RA | 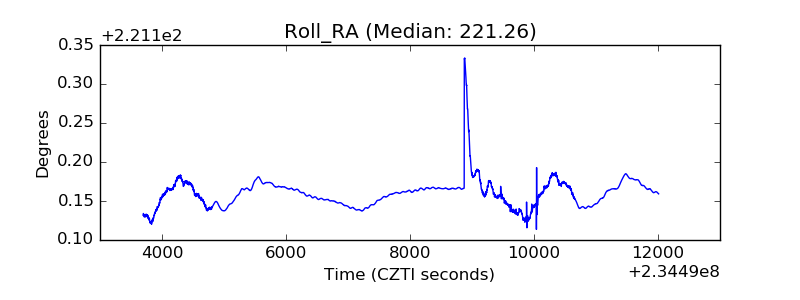 |
| Veto Counter |  |