| Param | Original file | Final file |
|---|---|---|
| Filename | modeM0/AS1C02_042T01_9000001278_09148cztM0_level2.evt | modeM0/AS1C02_042T01_9000001278_09148cztM0_level2_quad_clean.evt |
| Size (bytes) | 438,621,120 | 90,864,000 |
| Size | 418.3 MB | 86.7 MB |
| Events in quadrant A | 3,293,098 | 580,607 |
| Events in quadrant B | 3,102,037 | 595,861 |
| Events in quadrant C | 2,961,123 | 577,446 |
| Events in quadrant D | 3,487,796 | 546,799 |
| Mode M0 | |||
|---|---|---|---|
| Quadrant | BADHDUFLAG | Total packets | Discarded packets |
| A | 0 | 13732 | 3 |
| B | 0 | 13329 | 2 |
| C | 0 | 13224 | 2 |
| D | 0 | 14884 | 2 |
| Mode M9 | |||
|---|---|---|---|
| Quadrant | BADHDUFLAG | Total packets | Discarded packets |
| A | 0 | 20 | 0 |
| B | 0 | 20 | 0 |
| C | 0 | 20 | 0 |
| D | 0 | 21 | 0 |
| Mode SS | |||
|---|---|---|---|
| Quadrant | BADHDUFLAG | Total packets | Discarded packets |
| A | 0 | 132 | 0 |
| B | 0 | 132 | 0 |
| C | 0 | 132 | 0 |
| D | 0 | 132 | 0 |
| Quadrant | Total seconds | Saturated seconds | Saturation percentage |
|---|---|---|---|
| A | 6462 | 57 | 0.882080% |
| B | 6462 | 55 | 0.851130% |
| C | 6462 | 28 | 0.433302% |
| D | 6462 | 165 | 2.553389% |
Noise dominated data is calculated using 1-second bins in cleaned event files. If a bin has >2000 counts, and if more than 50% of those come from <1% of pixels, then it is considered to be noise-dominated and hence unusable.
| Quadrant | # 1 sec bins | Bins with >0 counts | Bins with >2000 counts | High rate bins dominated by noise | Noise dominated (total time) | Noise dominated (detector-on time) | Marked lightcurve |
|---|---|---|---|---|---|---|---|
| A | 7802 | 6464 | 1 | 1 | 0.01% | 0.02% | 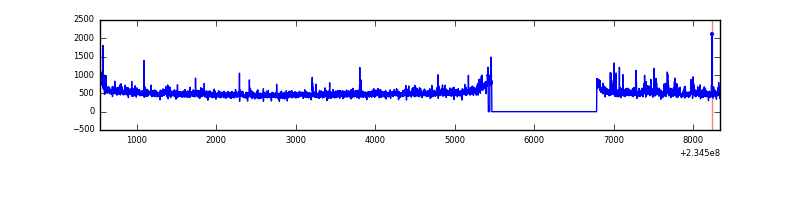 |
| B | 7802 | 6463 | 1 | 1 | 0.01% | 0.02% | 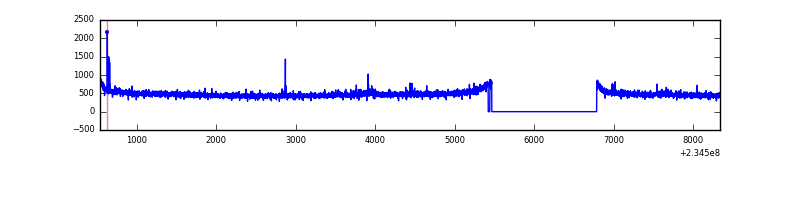 |
| C | 7802 | 6463 | 1 | 1 | 0.01% | 0.02% | 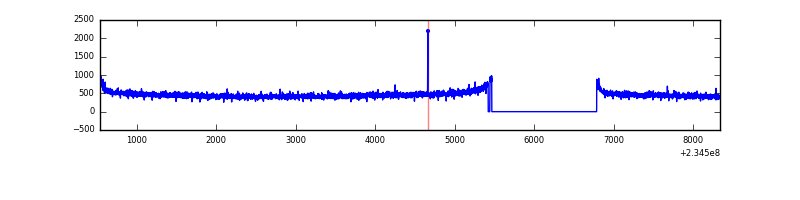 |
| D | 7802 | 6463 | 138 | 138 | 1.77% | 2.14% | 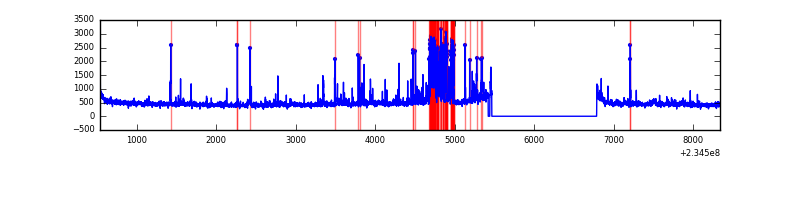 |
Top three noisy pixels from each quadrant. If the there are fewer than three noisy pixels in the level2.evt file, extra rows are filled as -1
| Pixel properties | Quadrant properties | ||||||
|---|---|---|---|---|---|---|---|
| Quadrant | DetID | PixID | Counts | Sigma | Mean | Median | Sigma |
| A | 8 | 5 | 210485 | 1334.98 | 781 | 766 | 157.1 |
| A | 1 | 162 | 45381 | 284.0 | 781 | 766 | 157.1 |
| A | 1 | 178 | 8937 | 52.01 | 781 | 766 | 157.1 |
| B | 12 | 111 | 15796 | 102.35 | 791 | 773 | 146.8 |
| B | 0 | 187 | 13767 | 88.53 | 791 | 773 | 146.8 |
| B | 11 | 111 | 12538 | 80.15 | 791 | 773 | 146.8 |
| C | 13 | 61 | 5801 | 29.16 | 757 | 762 | 172.8 |
| C | 1 | 3 | 4404 | 21.07 | 757 | 762 | 172.8 |
| C | 9 | 68 | 3711 | 17.06 | 757 | 762 | 172.8 |
| D | 1 | 52 | 549420 | 2910.95 | 741 | 722 | 188.5 |
| D | 2 | 14 | 40270 | 209.81 | 741 | 722 | 188.5 |
| D | 13 | 104 | 21683 | 111.2 | 741 | 722 | 188.5 |
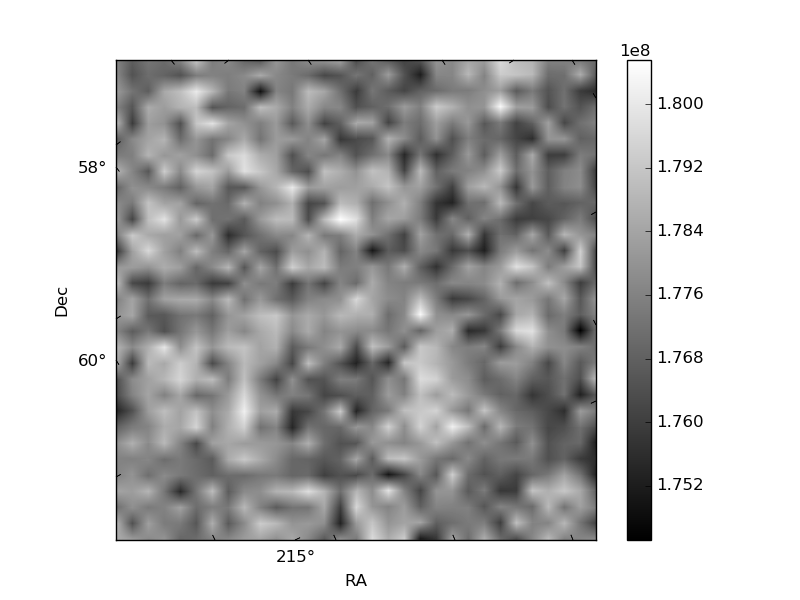
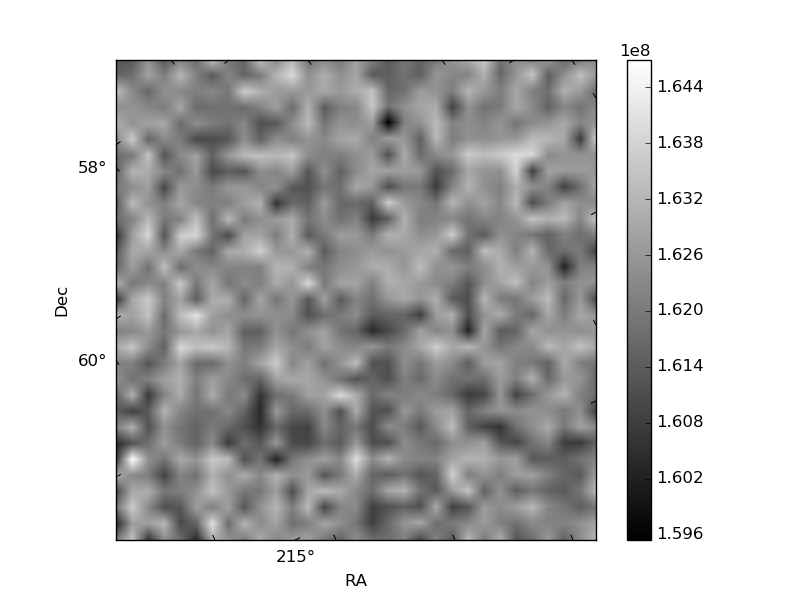
Histogram calculated using DETX and DETY for each event in the final _common_clean file
| Quadrant A | 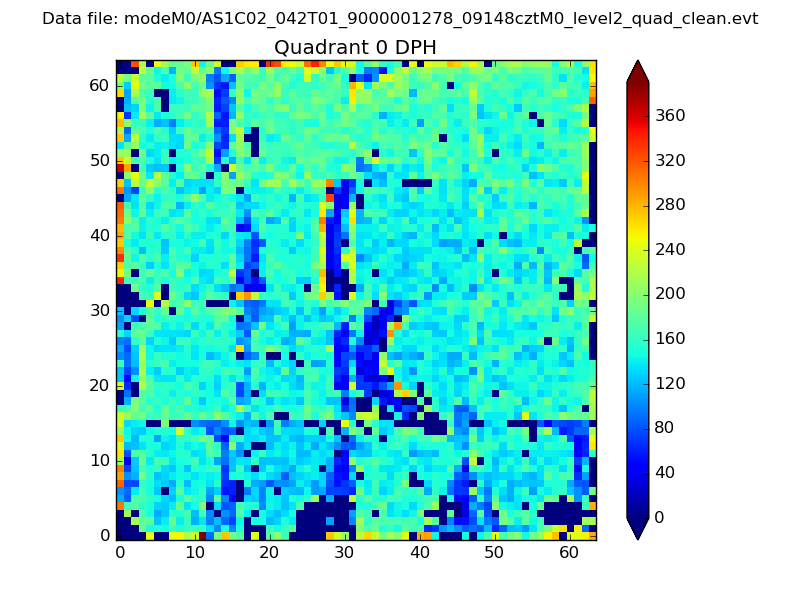 |
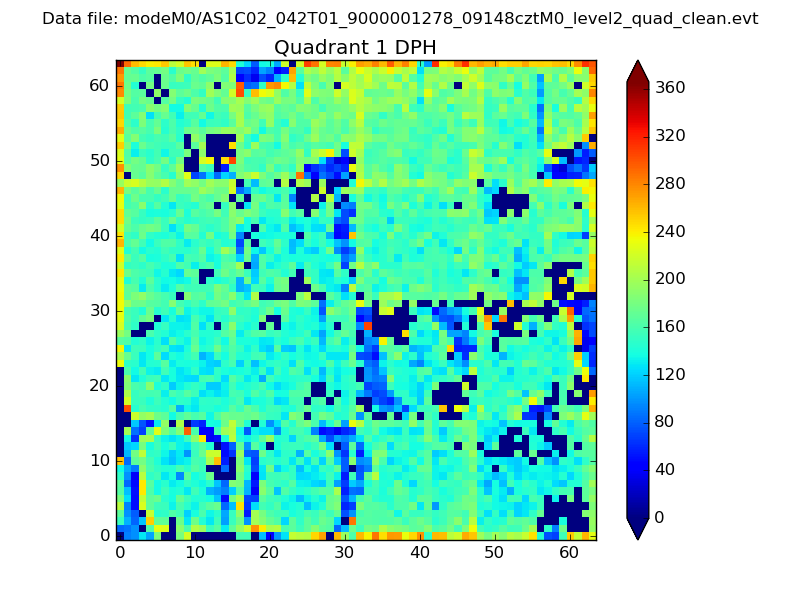 |
Quadrant B |
|---|---|---|---|
| Quadrant D |  |
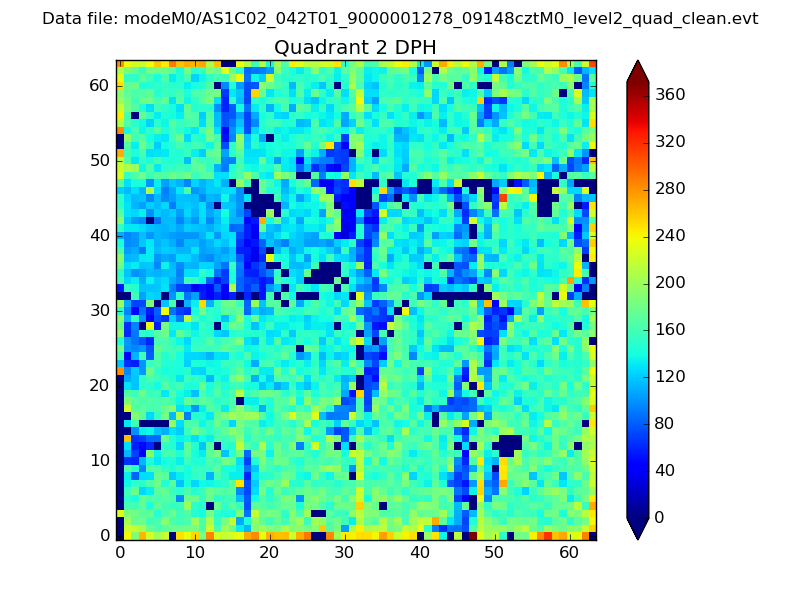 |
Quadrant C |
| Plot type | Count rate plots | Images |
|---|---|---|
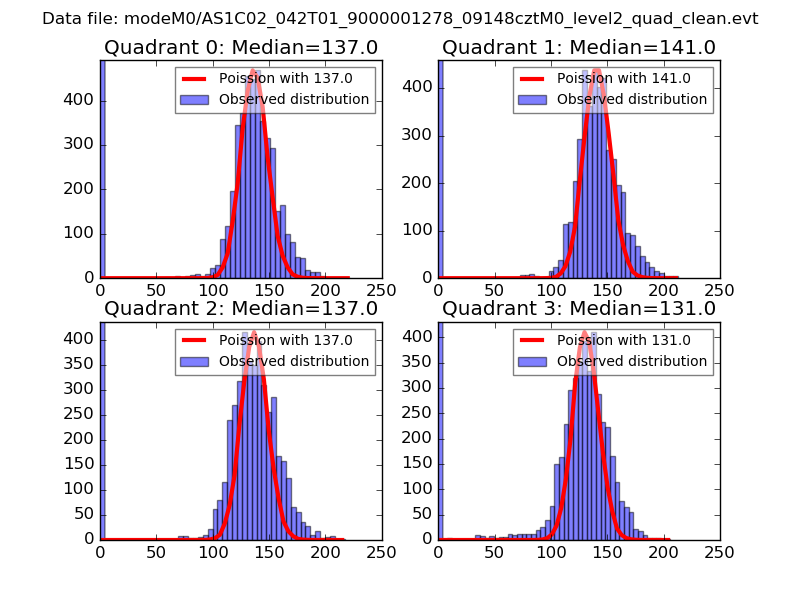
| Comparison with Poisson distribution Blue bars denote a histogram of data divided into 1 sec bins. Red curve is a Poisson curve with rate = median count rate of data. |
 |
 |
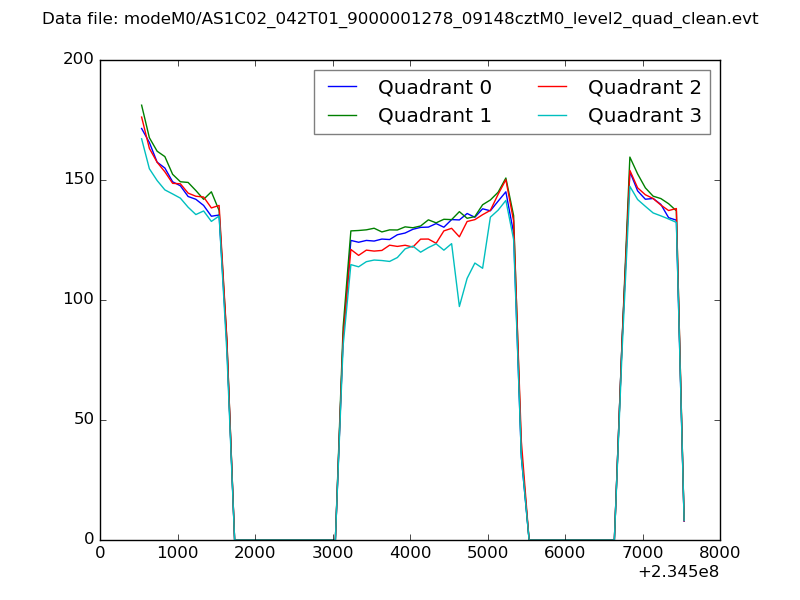
| Quadrant-wise count rates Data is divided into 100 sec bins |
 |
|
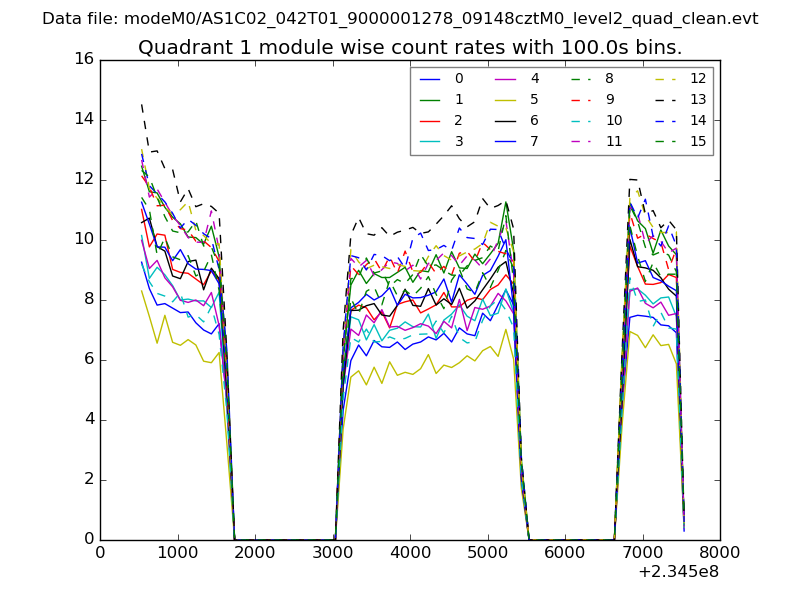
| Module-wise count rates for Quadrant A Data is divided into 100 sec bins |
 |
 |
| Module-wise count rates for Quadrant B Data is divided into 100 sec bins |
 |
 |
| Module-wise count rates for Quadrant C Data is divided into 100 sec bins |
 |
 |
| Module-wise count rates for Quadrant D Data is divided into 100 sec bins |
 |
 |
| Parameter | Plot |
|---|---|
| CZT HV Monitor | 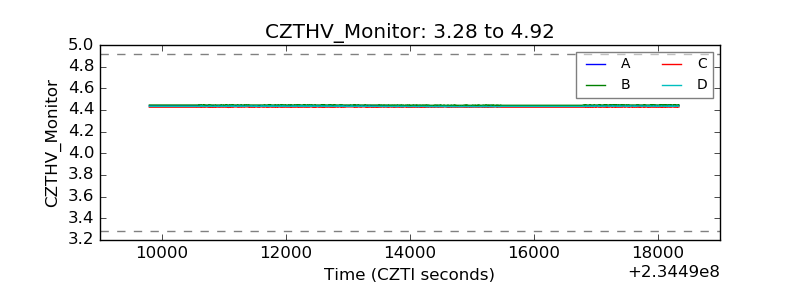 |
| D_VDD | 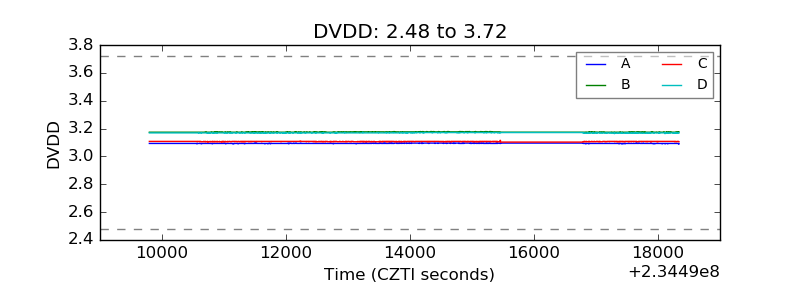 |
| Temperature 1 | 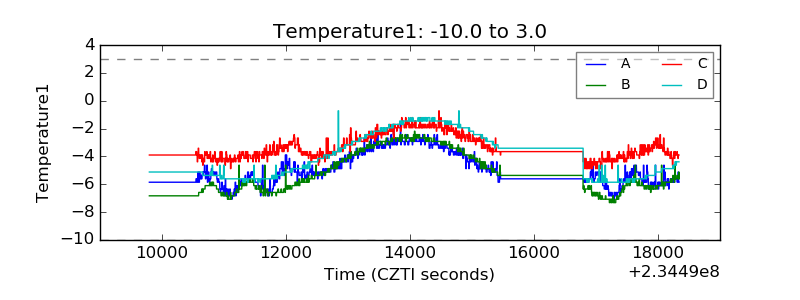 |
| Veto HV Monitor | 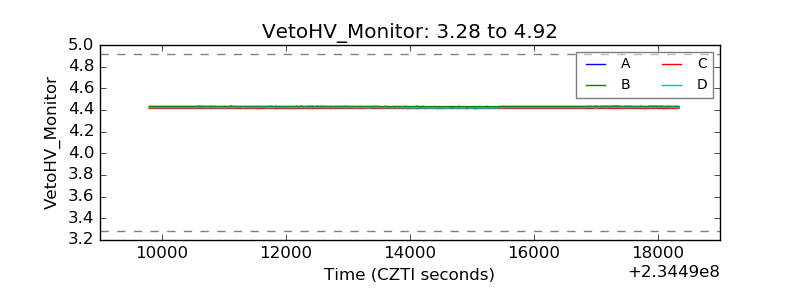 |
| Veto LLD | 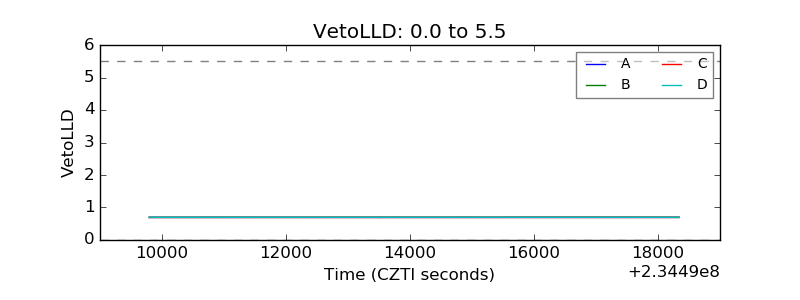 |
| Alpha Counter | 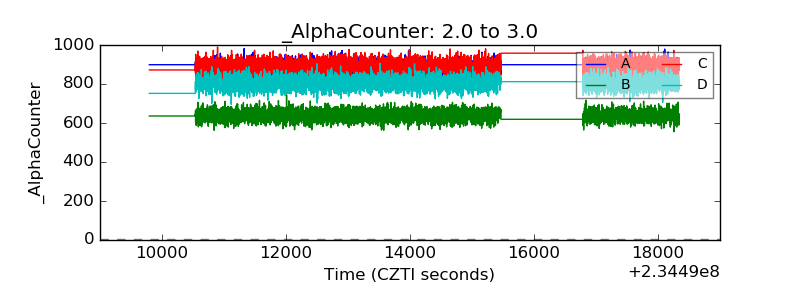 |
| _CPM_Rate | 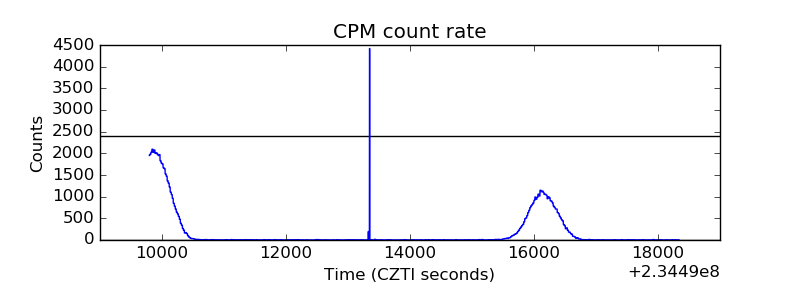 |
| CZT Counter | 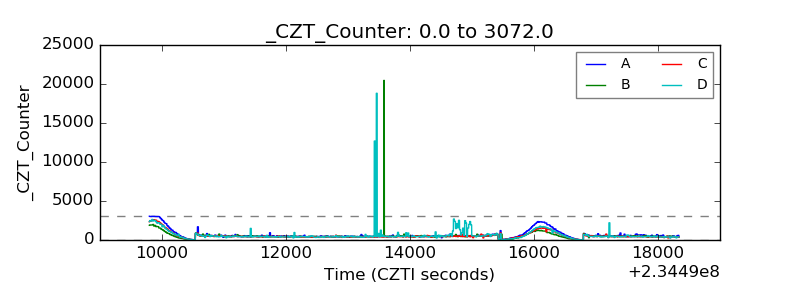 |
| +2.5 Volts monitor |  |
| +5 Volts monitor |  |
| _ROLL_ROT | 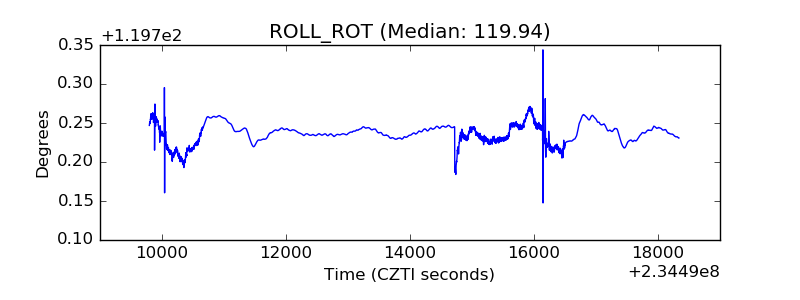 |
| _Roll_DEC | 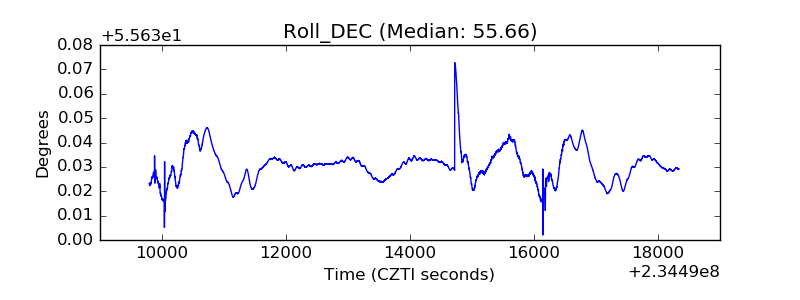 |
| _Roll_RA | 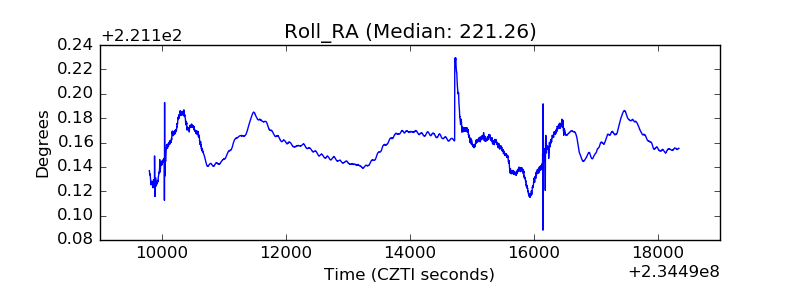 |
| Veto Counter | 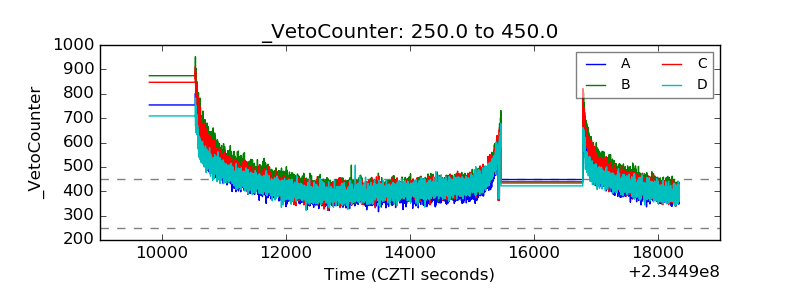 |