| Param | Original file | Final file |
|---|---|---|
| Filename | modeM0/AS1C02_042T01_9000001278_09149cztM0_level2.evt | modeM0/AS1C02_042T01_9000001278_09149cztM0_level2_quad_clean.evt |
| Size (bytes) | 389,658,240 | 74,684,160 |
| Size | 371.6 MB | 71.2 MB |
| Events in quadrant A | 3,120,017 | 462,457 |
| Events in quadrant B | 2,842,345 | 471,788 |
| Events in quadrant C | 2,709,858 | 460,159 |
| Events in quadrant D | 2,718,913 | 446,792 |
| Mode M0 | |||
|---|---|---|---|
| Quadrant | BADHDUFLAG | Total packets | Discarded packets |
| A | 0 | 13058 | 2 |
| B | 0 | 12409 | 7 |
| C | 0 | 12320 | 3 |
| D | 0 | 12440 | 1 |
| Mode M9 | |||
|---|---|---|---|
| Quadrant | BADHDUFLAG | Total packets | Discarded packets |
| A | 0 | 12 | 0 |
| B | 0 | 12 | 0 |
| C | 0 | 12 | 0 |
| D | 0 | 12 | 0 |
| Mode SS | |||
|---|---|---|---|
| Quadrant | BADHDUFLAG | Total packets | Discarded packets |
| A | 0 | 120 | 0 |
| B | 0 | 120 | 0 |
| C | 0 | 120 | 0 |
| D | 0 | 120 | 0 |
| Quadrant | Total seconds | Saturated seconds | Saturation percentage |
|---|---|---|---|
| A | 6027 | 79 | 1.310768% |
| B | 6024 | 83 | 1.377822% |
| C | 6026 | 38 | 0.630601% |
| D | 6027 | 49 | 0.813008% |
Noise dominated data is calculated using 1-second bins in cleaned event files. If a bin has >2000 counts, and if more than 50% of those come from <1% of pixels, then it is considered to be noise-dominated and hence unusable.
| Quadrant | # 1 sec bins | Bins with >0 counts | Bins with >2000 counts | High rate bins dominated by noise | Noise dominated (total time) | Noise dominated (detector-on time) | Marked lightcurve |
|---|---|---|---|---|---|---|---|
| A | 7177 | 6027 | 4 | 4 | 0.06% | 0.07% | 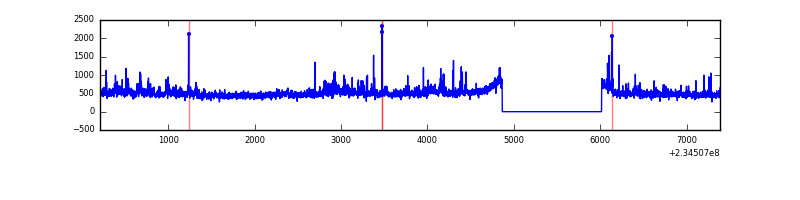 |
| B | 7177 | 6027 | 1 | 1 | 0.01% | 0.02% | 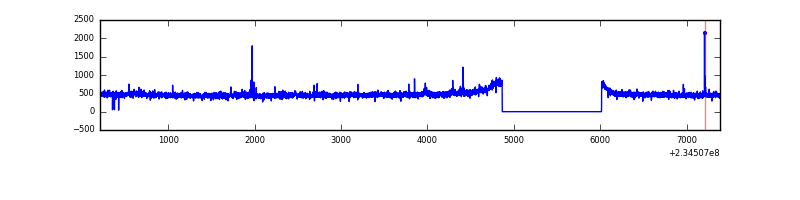 |
| C | 7177 | 6027 | 0 | 0 | 0.00% | 0.00% | 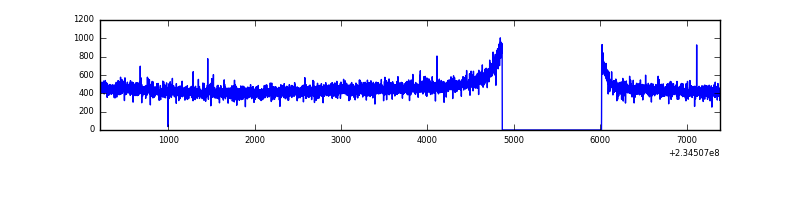 |
| D | 7177 | 6027 | 2 | 2 | 0.03% | 0.03% | 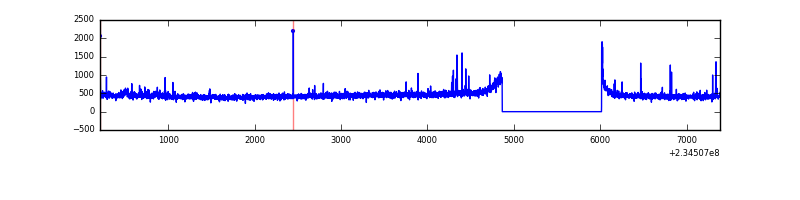 |
Top three noisy pixels from each quadrant. If the there are fewer than three noisy pixels in the level2.evt file, extra rows are filled as -1
| Pixel properties | Quadrant properties | ||||||
|---|---|---|---|---|---|---|---|
| Quadrant | DetID | PixID | Counts | Sigma | Mean | Median | Sigma |
| A | 8 | 5 | 252075 | 1735.71 | 716 | 700 | 144.8 |
| A | 1 | 162 | 50090 | 341.03 | 716 | 700 | 144.8 |
| A | 15 | 174 | 27798 | 187.11 | 716 | 700 | 144.8 |
| B | 0 | 214 | 25880 | 185.37 | 721 | 703 | 135.8 |
| B | 12 | 111 | 14854 | 104.19 | 721 | 703 | 135.8 |
| B | 11 | 111 | 12040 | 83.47 | 721 | 703 | 135.8 |
| C | 13 | 61 | 5375 | 29.53 | 693 | 697 | 158.4 |
| C | 9 | 68 | 4276 | 22.6 | 693 | 697 | 158.4 |
| C | 8 | 222 | 2162 | 9.25 | 693 | 697 | 158.4 |
| D | 1 | 52 | 47260 | 269.29 | 690 | 671 | 173.0 |
| D | 12 | 233 | 22885 | 128.4 | 690 | 671 | 173.0 |
| D | 2 | 234 | 19804 | 110.59 | 690 | 671 | 173.0 |
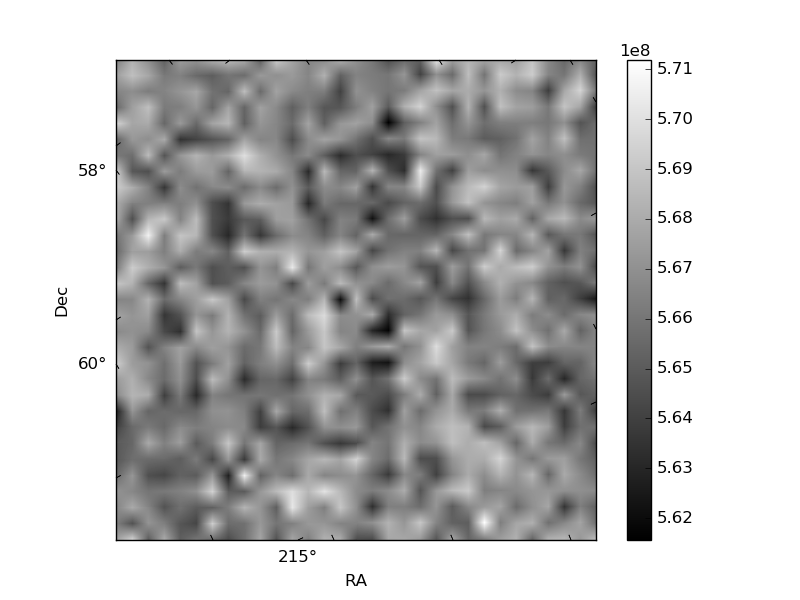
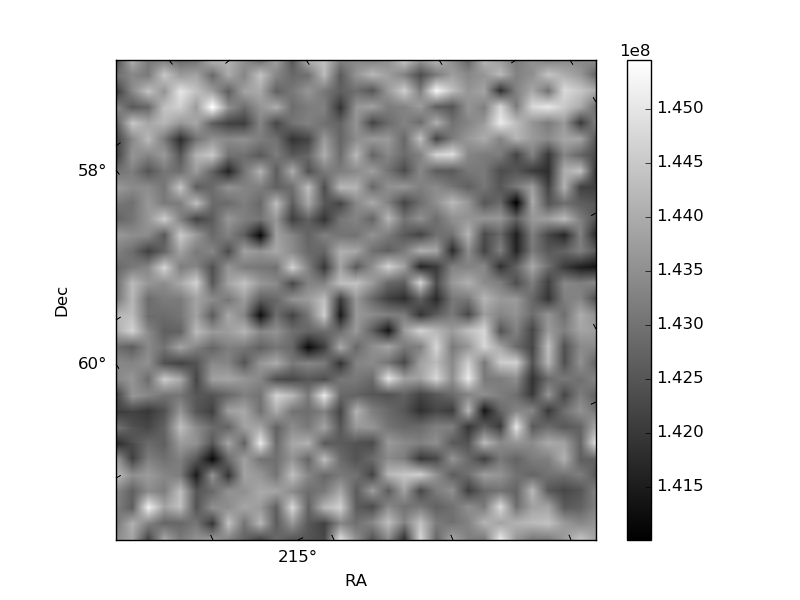
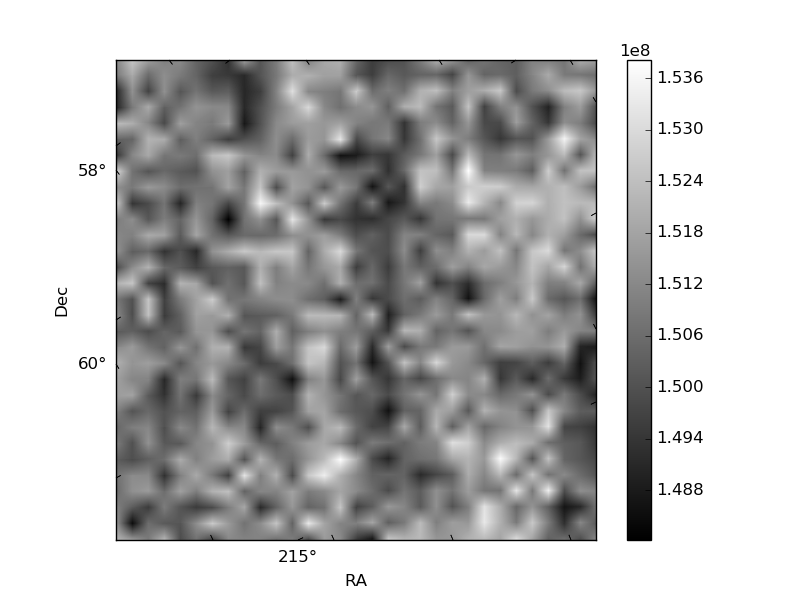
Histogram calculated using DETX and DETY for each event in the final _common_clean file
| Quadrant A | 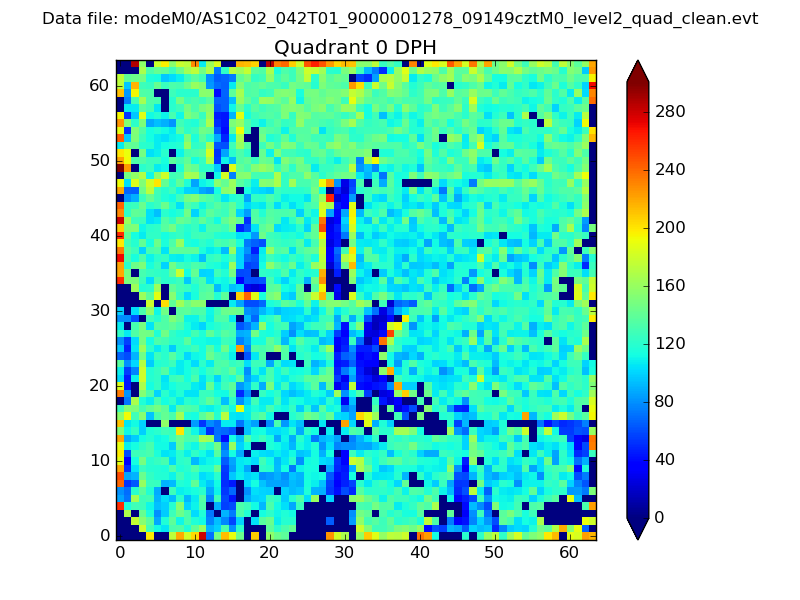 |
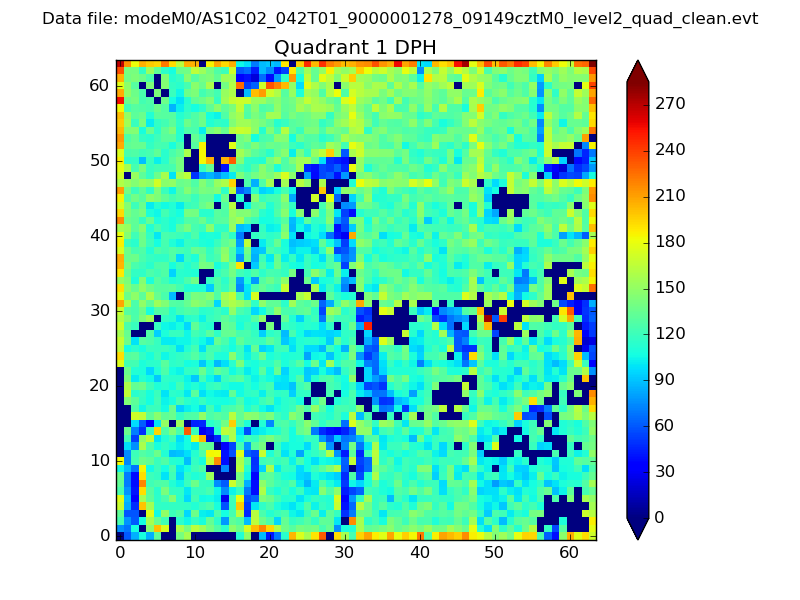 |
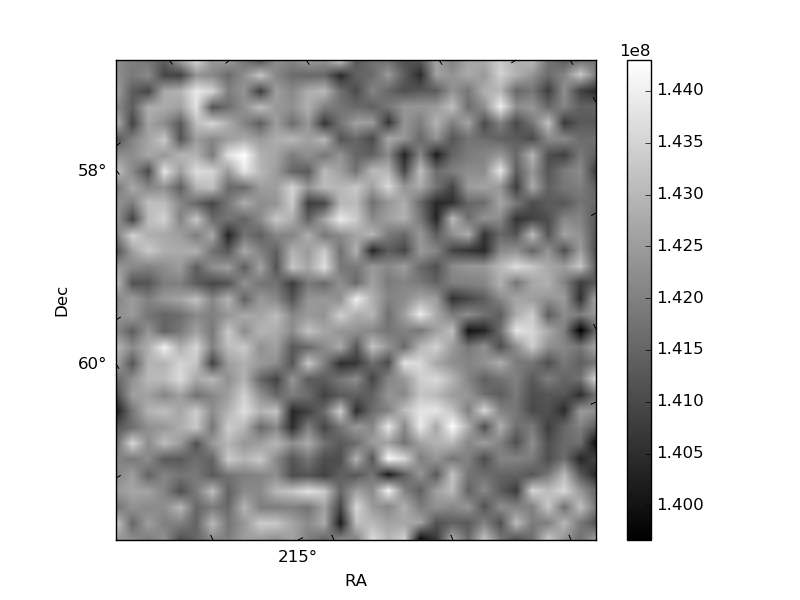
Quadrant B |
|---|---|---|---|
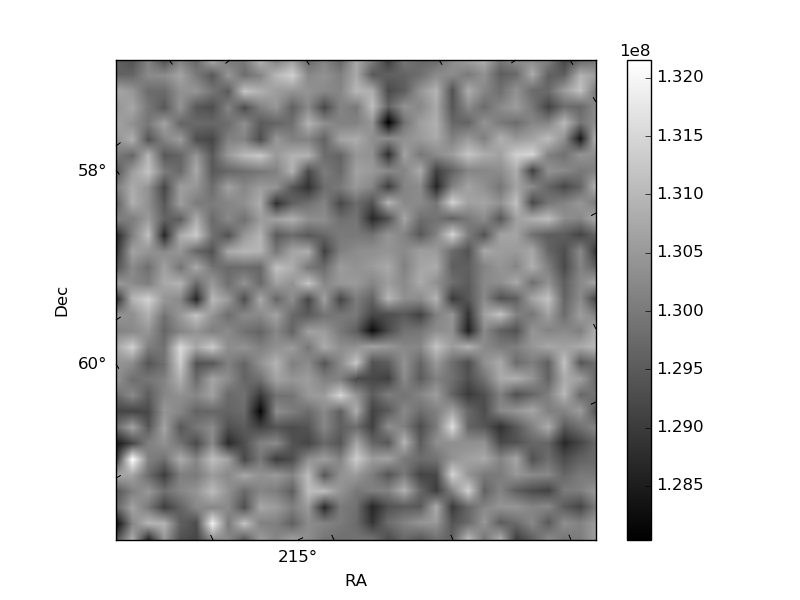
| Quadrant D | 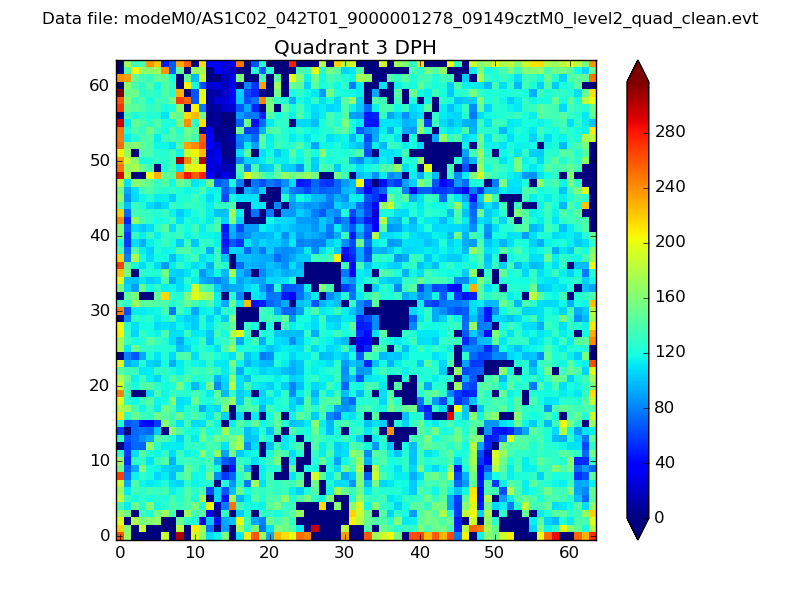 |
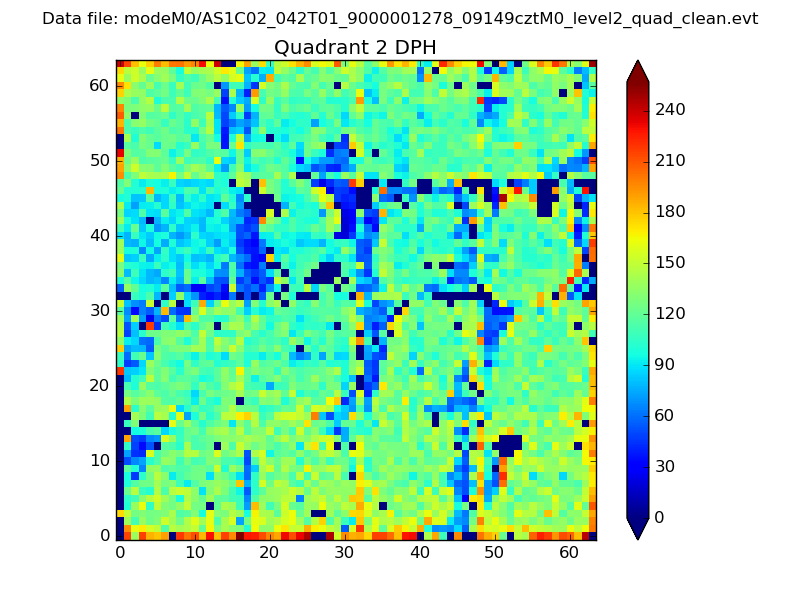 |
Quadrant C |
| Plot type | Count rate plots | Images |
|---|---|---|
| Comparison with Poisson distribution Blue bars denote a histogram of data divided into 1 sec bins. Red curve is a Poisson curve with rate = median count rate of data. |
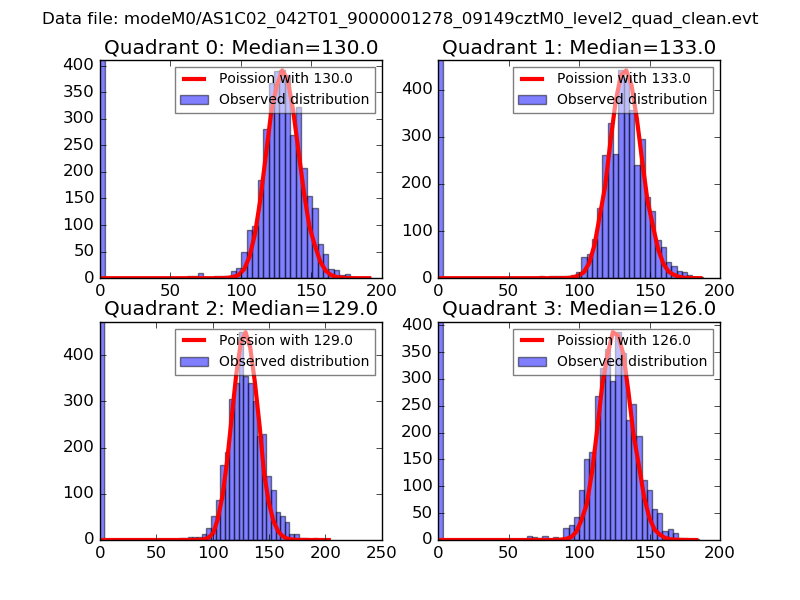 |
 |
| Quadrant-wise count rates Data is divided into 100 sec bins |
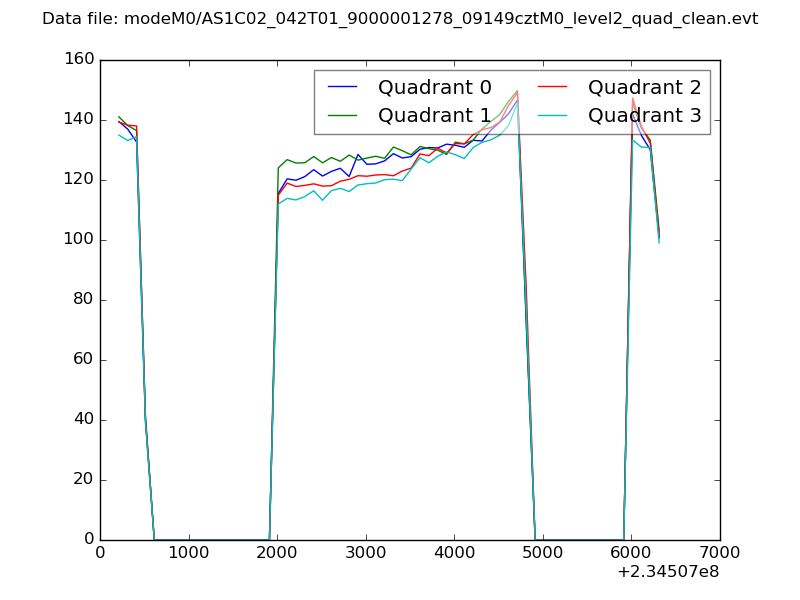 |
|
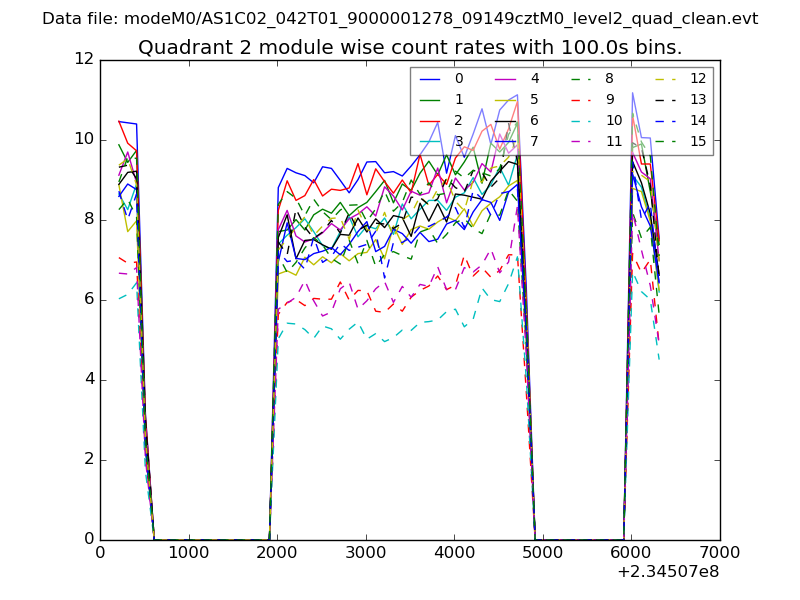
| Module-wise count rates for Quadrant A Data is divided into 100 sec bins |
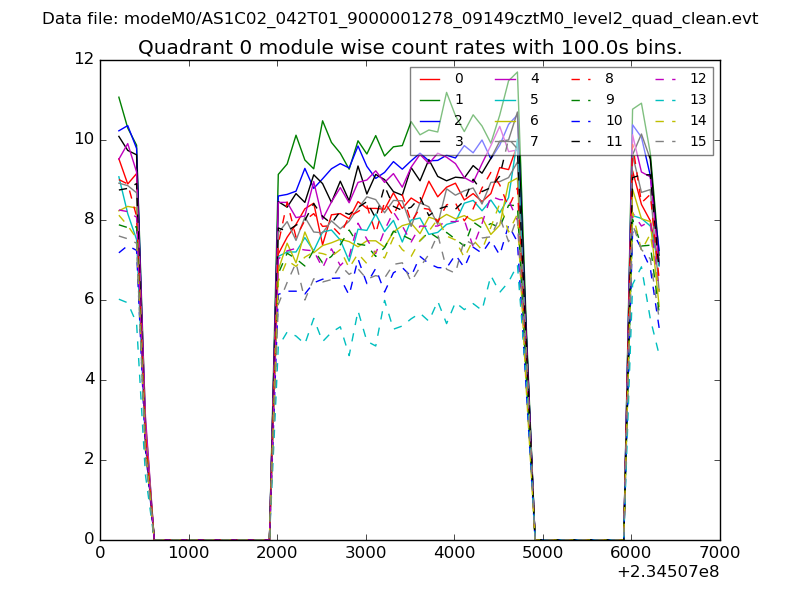 |
 |
| Module-wise count rates for Quadrant B Data is divided into 100 sec bins |
 |
 |
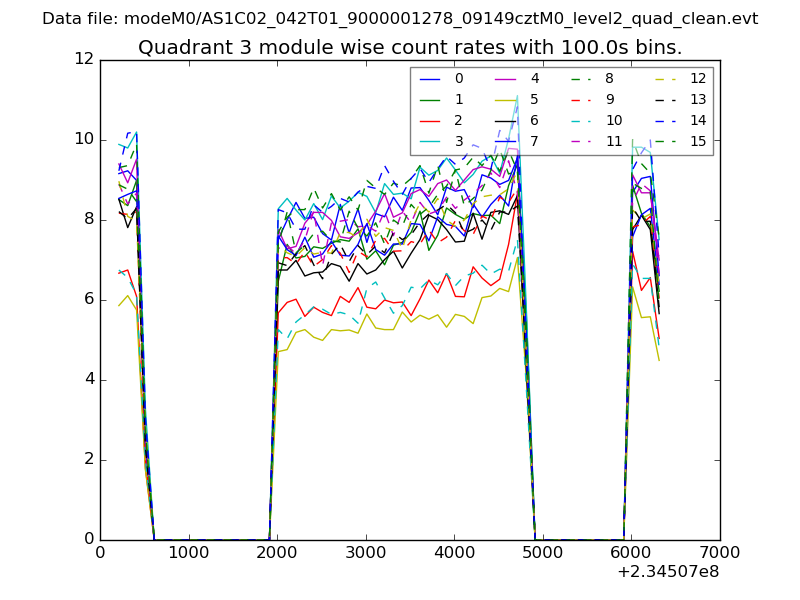
| Module-wise count rates for Quadrant C Data is divided into 100 sec bins |
 |
 |
| Module-wise count rates for Quadrant D Data is divided into 100 sec bins |
 |
 |
| Parameter | Plot |
|---|---|
| CZT HV Monitor | 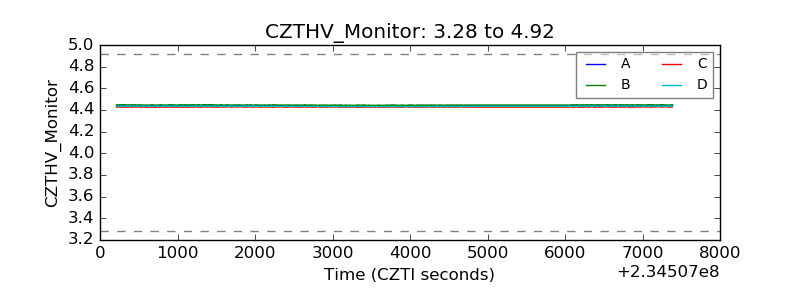 |
| D_VDD | 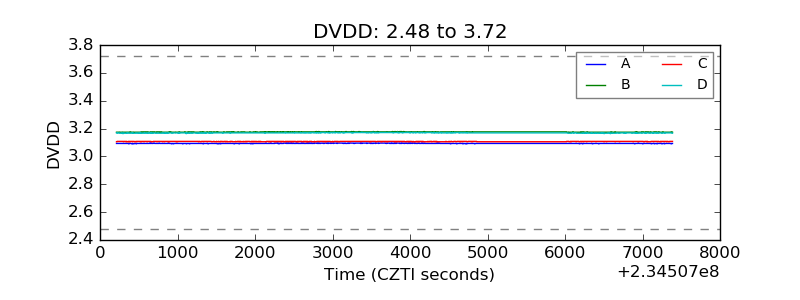 |
| Temperature 1 | 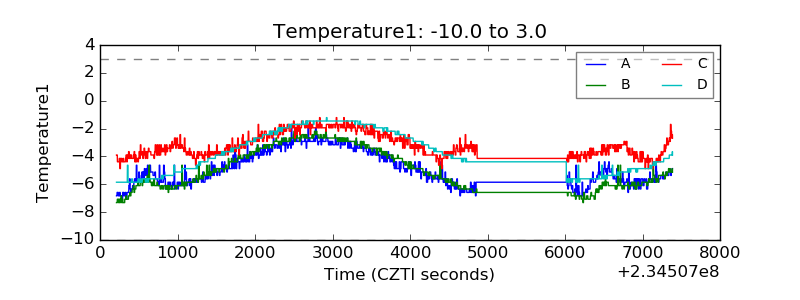 |
| Veto HV Monitor | 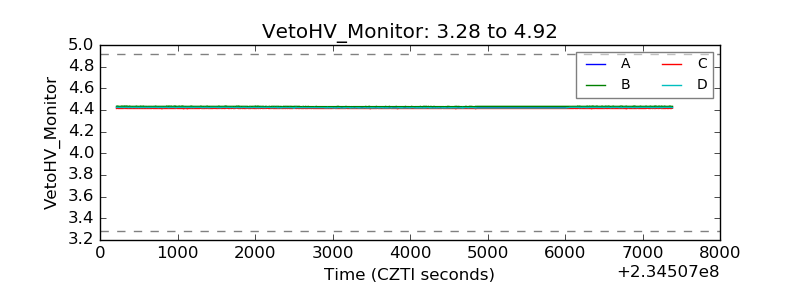 |
| Veto LLD | 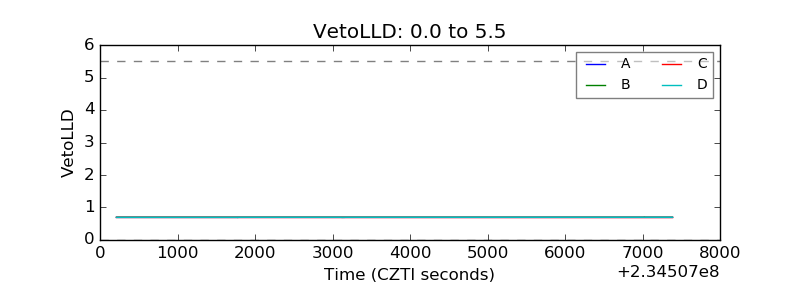 |
| Alpha Counter | 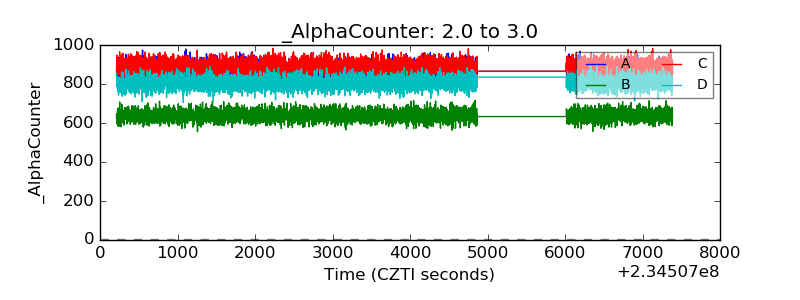 |
| _CPM_Rate | 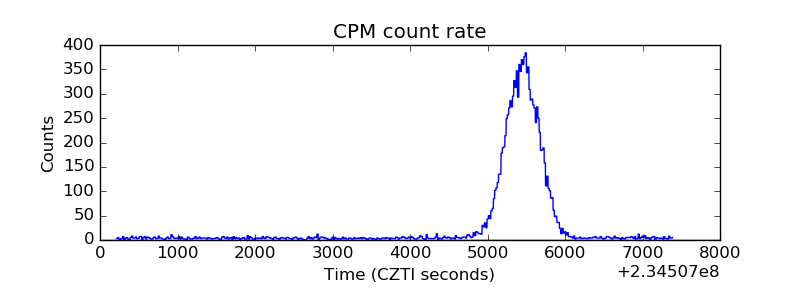 |
| CZT Counter | 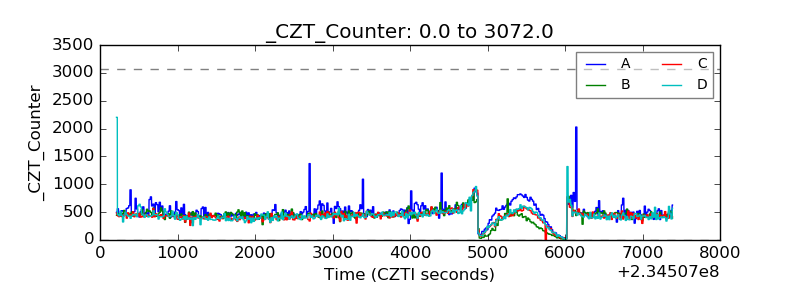 |
| +2.5 Volts monitor |  |
| +5 Volts monitor |  |
| _ROLL_ROT | 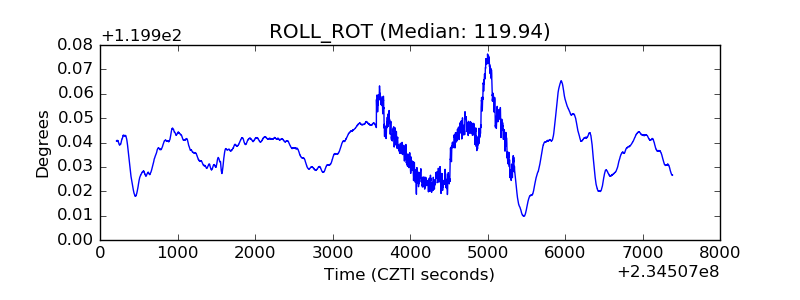 |
| _Roll_DEC | 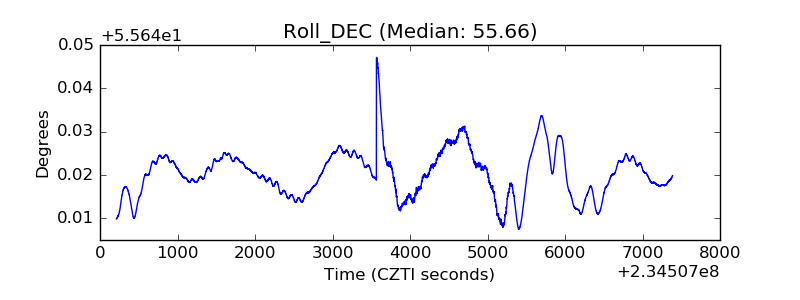 |
| _Roll_RA | 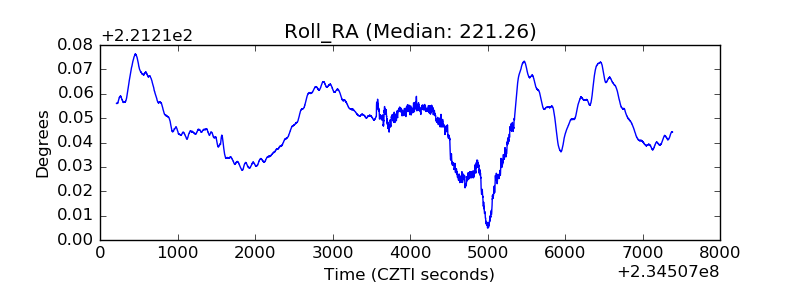 |
| Veto Counter | 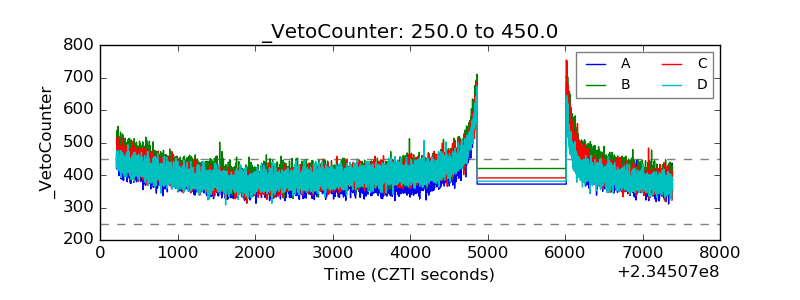 |