| Param | Original file | Final file |
|---|---|---|
| Filename | modeM0/AS1C02_042T01_9000001278_09150cztM0_level2.evt | modeM0/AS1C02_042T01_9000001278_09150cztM0_level2_quad_clean.evt |
| Size (bytes) | 495,270,720 | 84,176,640 |
| Size | 472.3 MB | 80.3 MB |
| Events in quadrant A | 3,805,097 | 519,222 |
| Events in quadrant B | 3,320,048 | 531,740 |
| Events in quadrant C | 3,183,977 | 523,162 |
| Events in quadrant D | 4,212,051 | 484,766 |
| Mode M0 | |||
|---|---|---|---|
| Quadrant | BADHDUFLAG | Total packets | Discarded packets |
| A | 0 | 15936 | 67 |
| B | 0 | 14650 | 39 |
| C | 0 | 14587 | 69 |
| D | 0 | 17616 | 53 |
| Mode M9 | |||
|---|---|---|---|
| Quadrant | BADHDUFLAG | Total packets | Discarded packets |
| A | 0 | 20 | 0 |
| B | 0 | 20 | 0 |
| C | 0 | 20 | 0 |
| D | 0 | 20 | 0 |
| Mode SS | |||
|---|---|---|---|
| Quadrant | BADHDUFLAG | Total packets | Discarded packets |
| A | 0 | 144 | 0 |
| B | 0 | 144 | 0 |
| C | 0 | 144 | 0 |
| D | 0 | 144 | 0 |
| Quadrant | Total seconds | Saturated seconds | Saturation percentage |
|---|---|---|---|
| A | 7033 | 216 | 3.071236% |
| B | 7041 | 201 | 2.854708% |
| C | 7027 | 122 | 1.736161% |
| D | 7039 | 384 | 5.455320% |
Noise dominated data is calculated using 1-second bins in cleaned event files. If a bin has >2000 counts, and if more than 50% of those come from <1% of pixels, then it is considered to be noise-dominated and hence unusable.
| Quadrant | # 1 sec bins | Bins with >0 counts | Bins with >2000 counts | High rate bins dominated by noise | Noise dominated (total time) | Noise dominated (detector-on time) | Marked lightcurve |
|---|---|---|---|---|---|---|---|
| A | 8994 | 7049 | 14 | 14 | 0.16% | 0.20% | 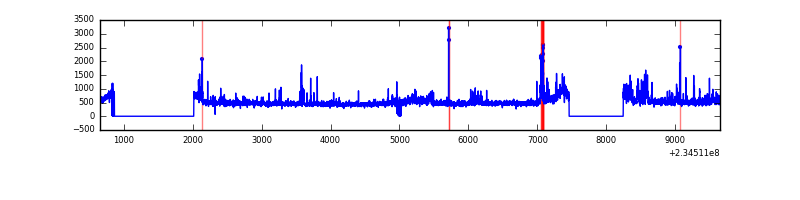 |
| B | 8994 | 7052 | 1 | 1 | 0.01% | 0.01% | 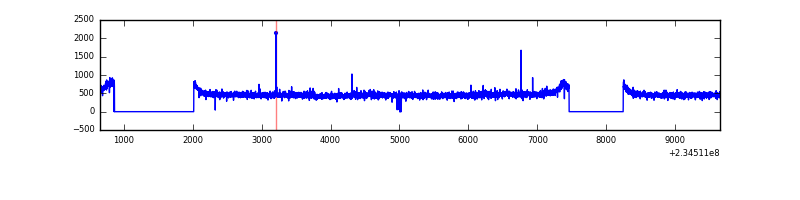 |
| C | 8994 | 7050 | 0 | 0 | 0.00% | 0.00% | 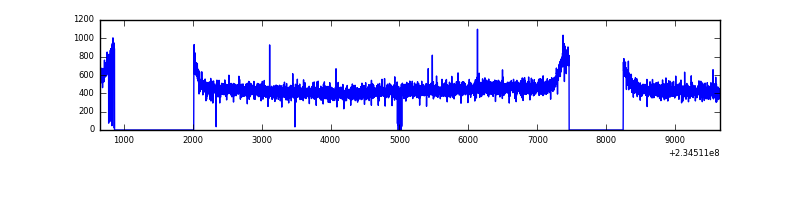 |
| D | 8994 | 7052 | 242 | 242 | 2.69% | 3.43% | 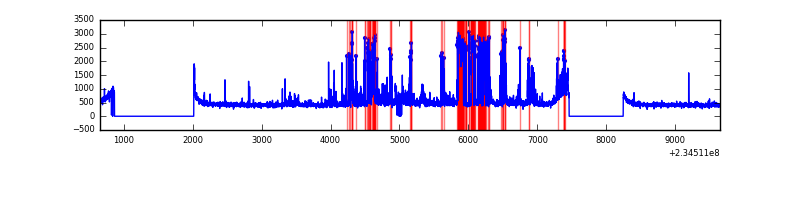 |
Top three noisy pixels from each quadrant. If the there are fewer than three noisy pixels in the level2.evt file, extra rows are filled as -1
| Pixel properties | Quadrant properties | ||||||
|---|---|---|---|---|---|---|---|
| Quadrant | DetID | PixID | Counts | Sigma | Mean | Median | Sigma |
| A | 8 | 5 | 461553 | 2721.91 | 834 | 817 | 169.3 |
| A | 1 | 162 | 50708 | 294.74 | 834 | 817 | 169.3 |
| A | 15 | 174 | 29553 | 169.76 | 834 | 817 | 169.3 |
| B | 0 | 214 | 20407 | 122.48 | 841 | 819 | 159.9 |
| B | 12 | 111 | 17790 | 106.12 | 841 | 819 | 159.9 |
| B | 0 | 219 | 16156 | 95.9 | 841 | 819 | 159.9 |
| C | 9 | 68 | 8859 | 43.12 | 812 | 814 | 186.6 |
| C | 13 | 61 | 6297 | 29.39 | 812 | 814 | 186.6 |
| C | 8 | 222 | 3815 | 16.08 | 812 | 814 | 186.6 |
| D | 1 | 52 | 886289 | 4358.35 | 793 | 769 | 203.2 |
| D | 12 | 233 | 148028 | 724.78 | 793 | 769 | 203.2 |
| D | 2 | 14 | 100256 | 489.65 | 793 | 769 | 203.2 |
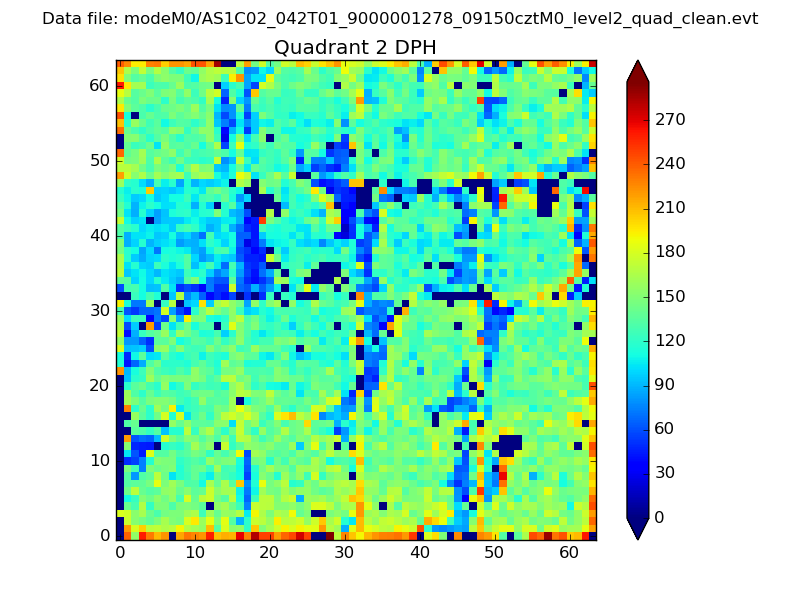
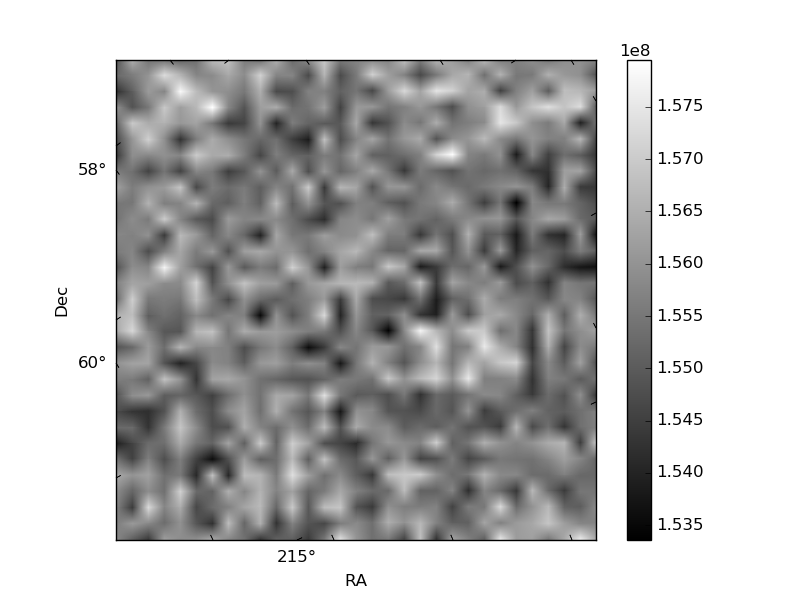
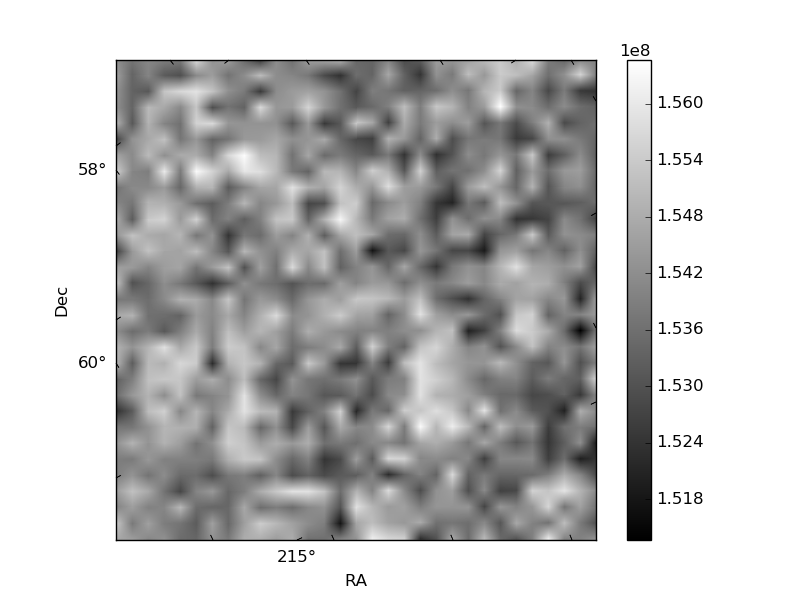
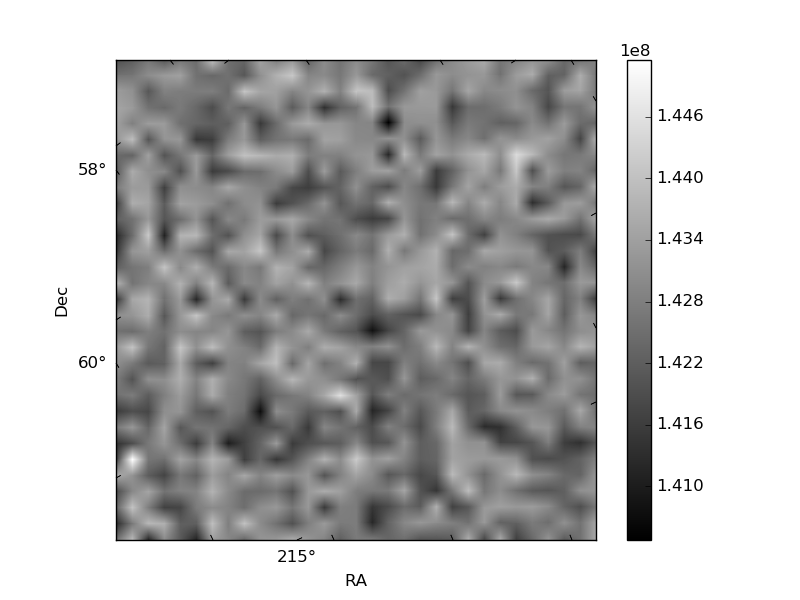
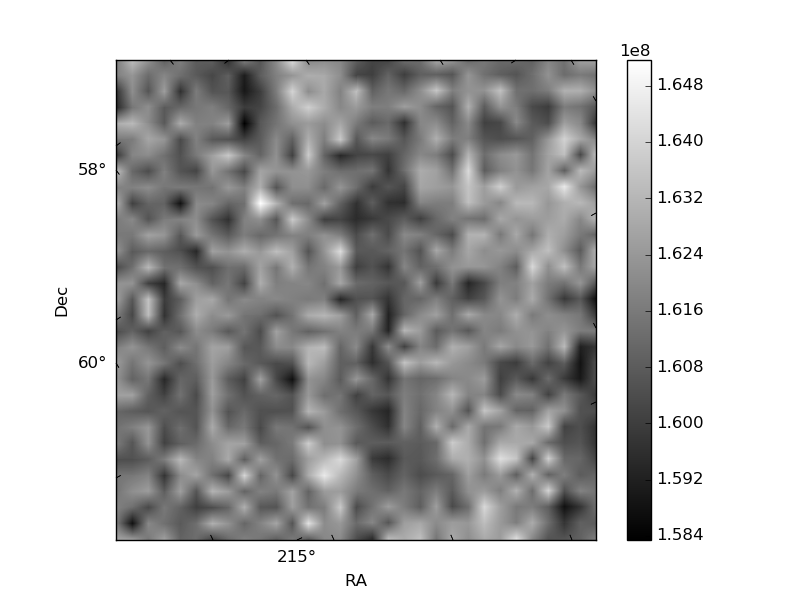
Histogram calculated using DETX and DETY for each event in the final _common_clean file
| Quadrant A | 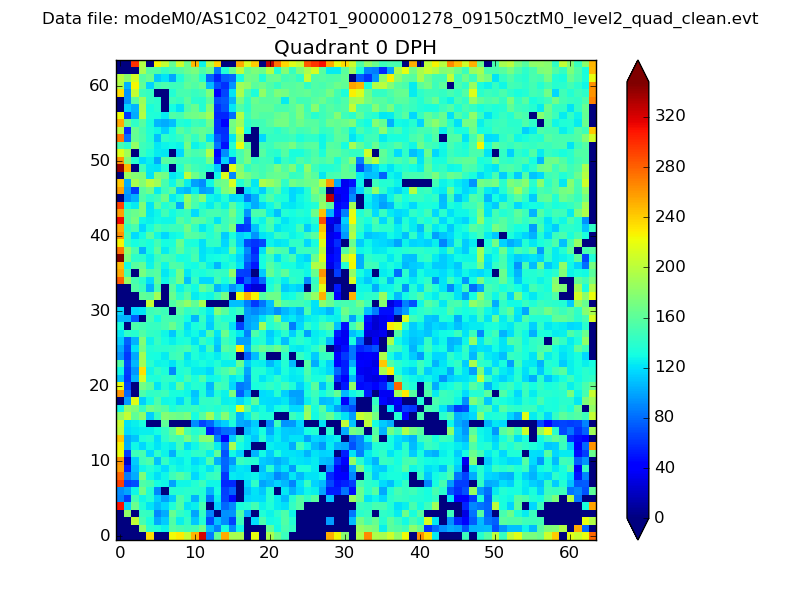 |
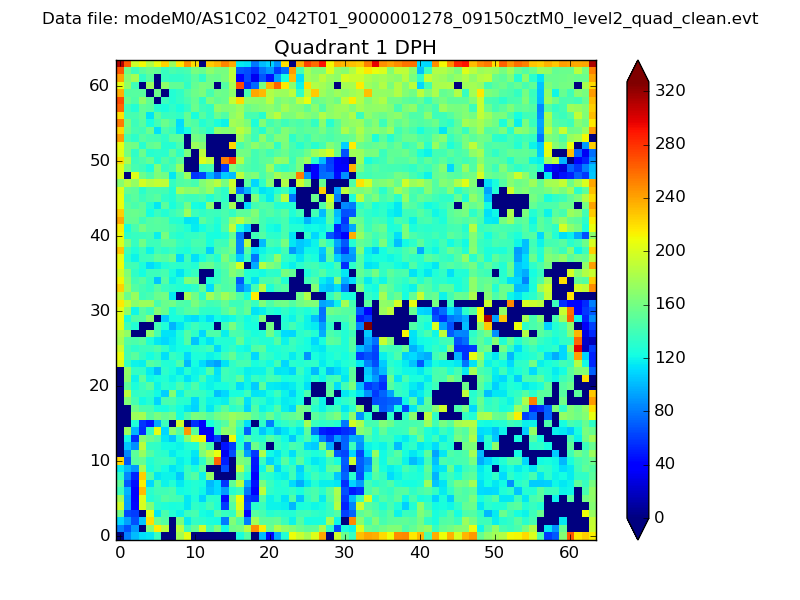 |
Quadrant B |
|---|---|---|---|
| Quadrant D | 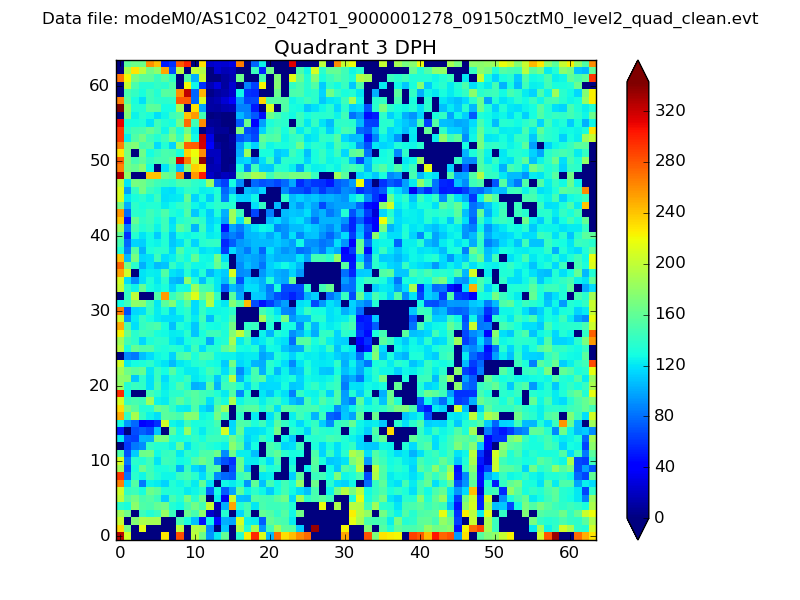 |
 |
Quadrant C |
| Plot type | Count rate plots | Images |
|---|---|---|
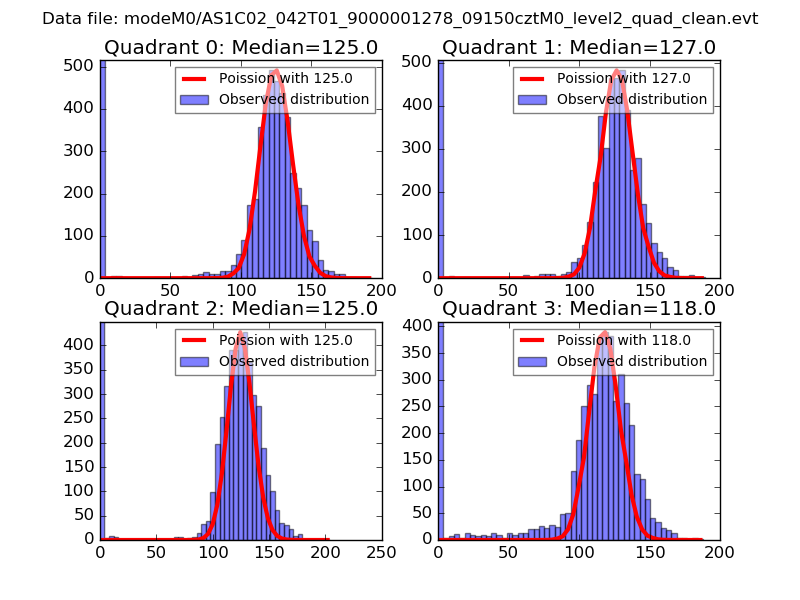
| Comparison with Poisson distribution Blue bars denote a histogram of data divided into 1 sec bins. Red curve is a Poisson curve with rate = median count rate of data. |
 |
 |
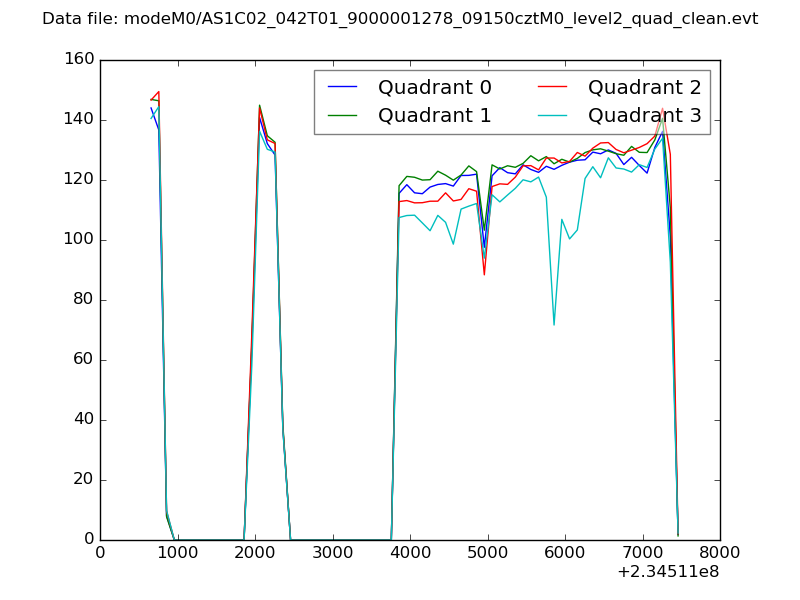
| Quadrant-wise count rates Data is divided into 100 sec bins |
 |
|
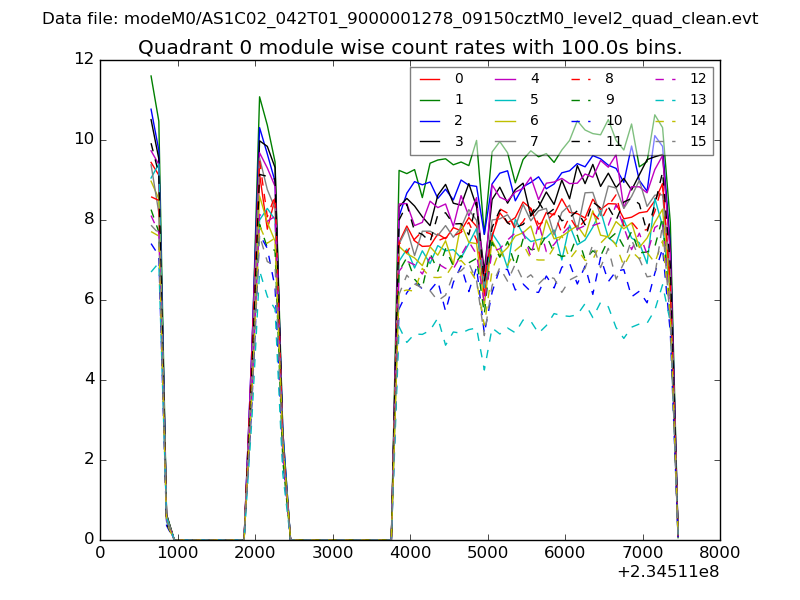
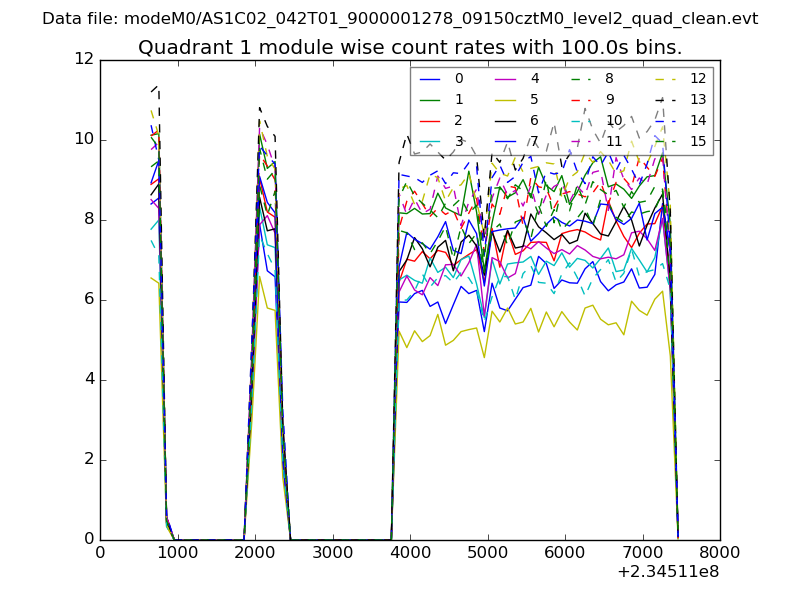
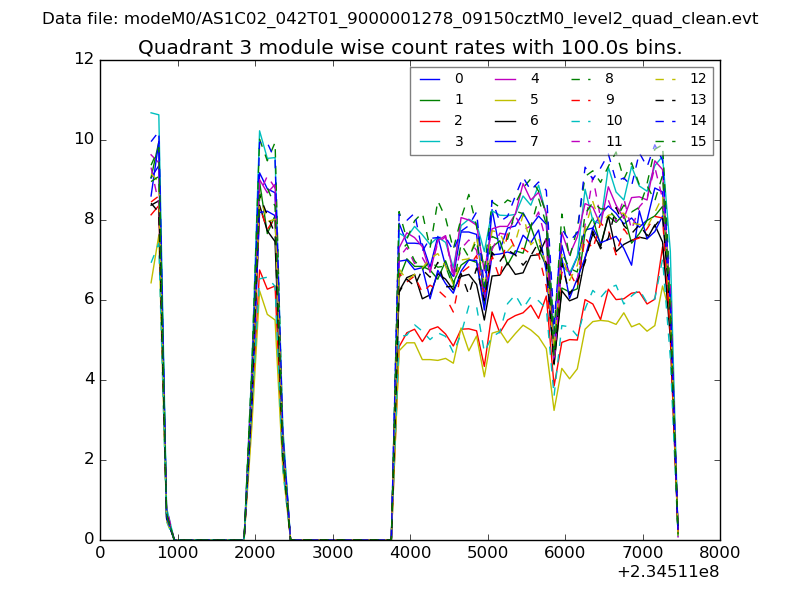
| Module-wise count rates for Quadrant A Data is divided into 100 sec bins |
 |
 |
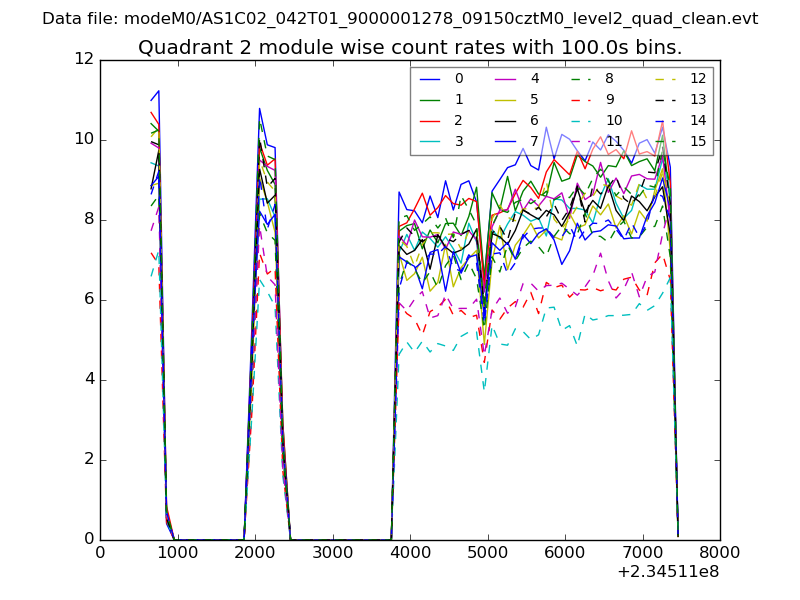
| Module-wise count rates for Quadrant B Data is divided into 100 sec bins |
 |
 |
| Module-wise count rates for Quadrant C Data is divided into 100 sec bins |
 |
 |
| Module-wise count rates for Quadrant D Data is divided into 100 sec bins |
 |
 |
| Parameter | Plot |
|---|---|
| CZT HV Monitor | 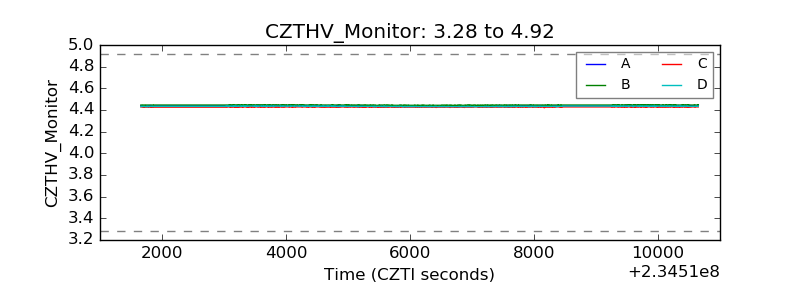 |
| D_VDD | 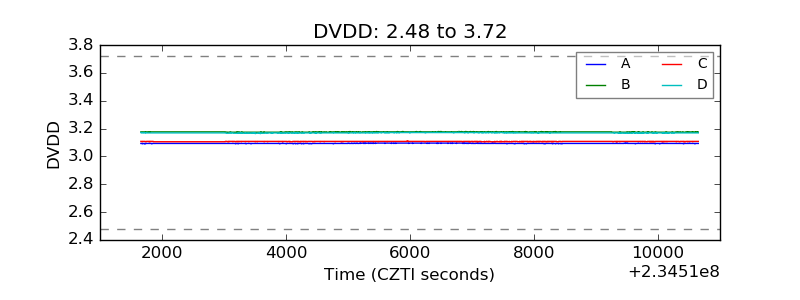 |
| Temperature 1 | 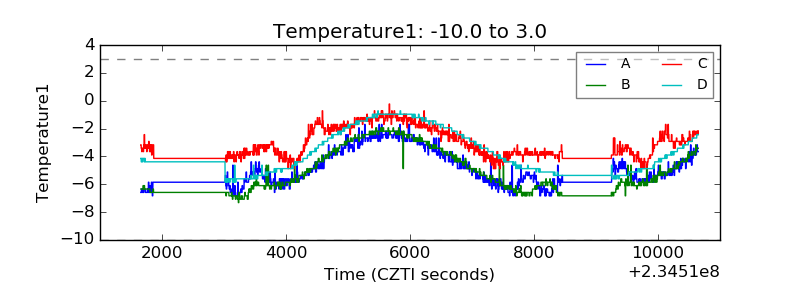 |
| Veto HV Monitor | 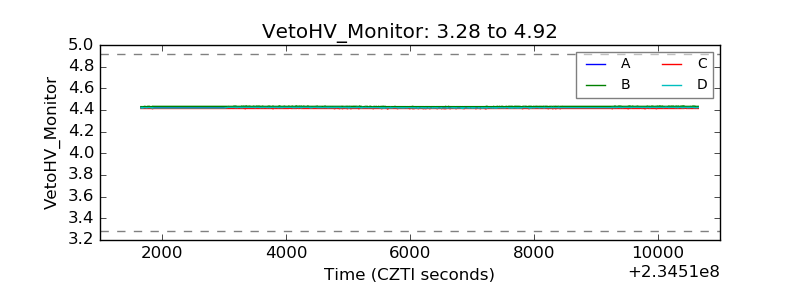 |
| Veto LLD | 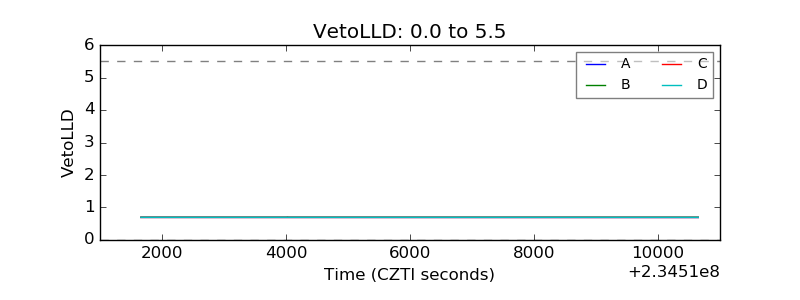 |
| Alpha Counter | 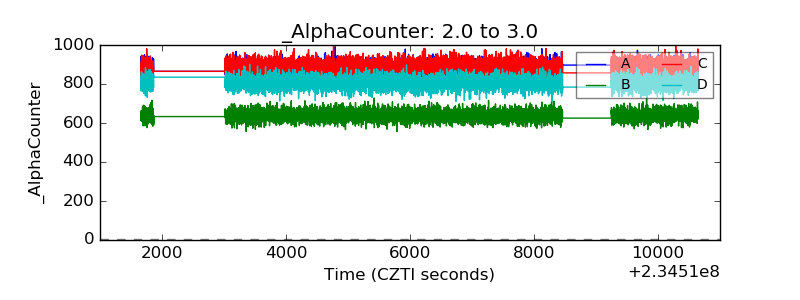 |
| _CPM_Rate | 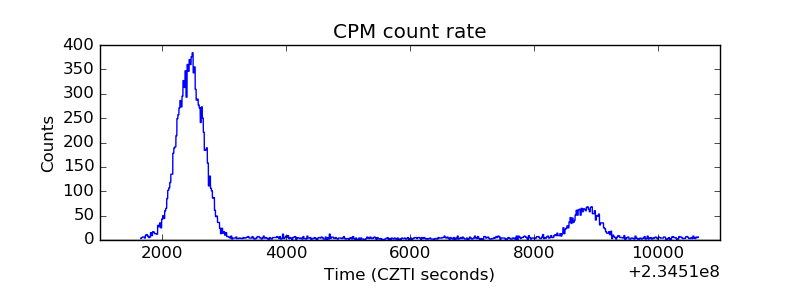 |
| CZT Counter | 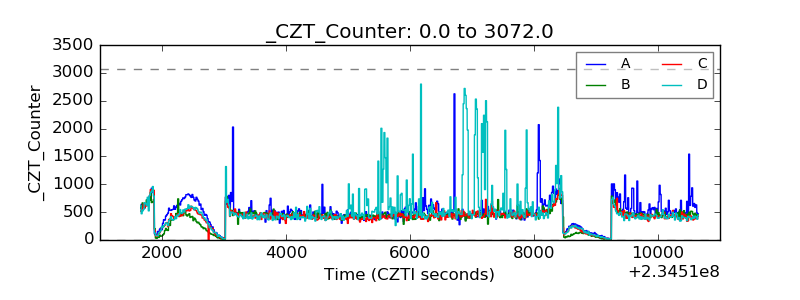 |
| +2.5 Volts monitor |  |
| +5 Volts monitor | 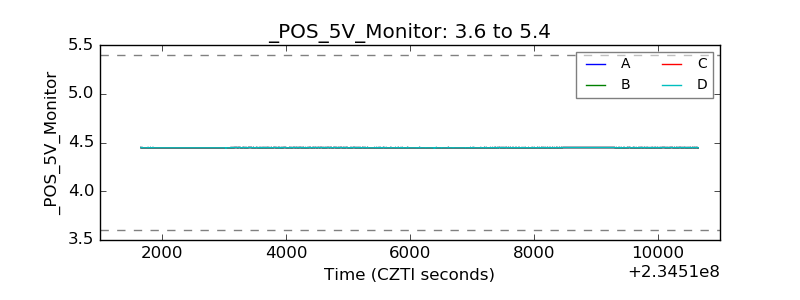 |
| _ROLL_ROT | 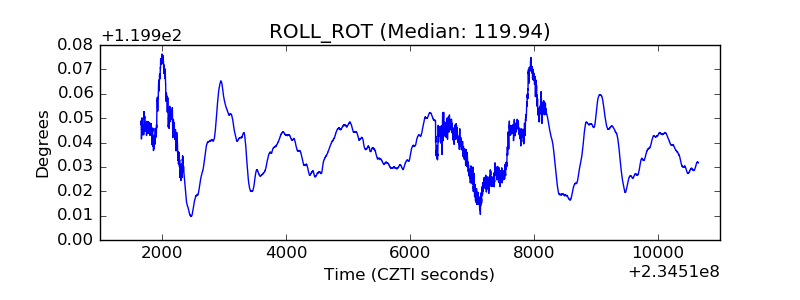 |
| _Roll_DEC | 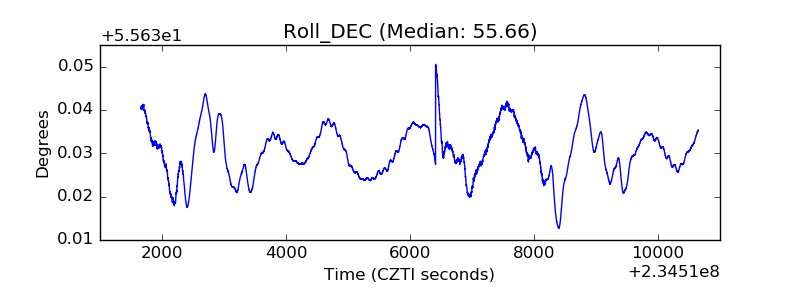 |
| _Roll_RA | 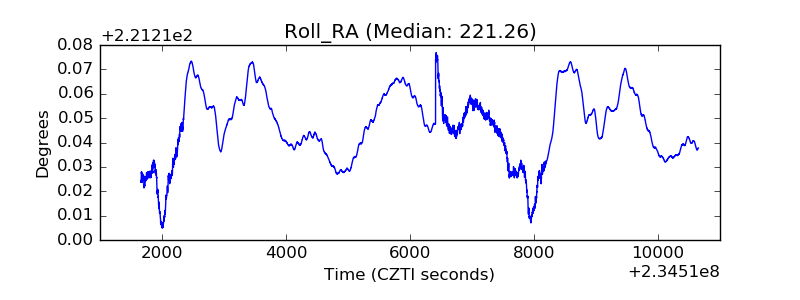 |
| Veto Counter | 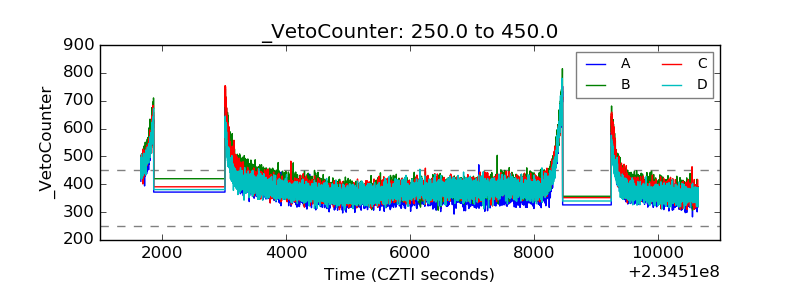 |