| Param | Original file | Final file |
|---|---|---|
| Filename | modeM0/AS1C02_042T01_9000001278_09151cztM0_level2.evt | modeM0/AS1C02_042T01_9000001278_09151cztM0_level2_quad_clean.evt |
| Size (bytes) | 557,438,400 | 103,996,800 |
| Size | 531.6 MB | 99.2 MB |
| Events in quadrant A | 5,024,596 | 643,738 |
| Events in quadrant B | 3,801,589 | 661,177 |
| Events in quadrant C | 3,660,802 | 652,207 |
| Events in quadrant D | 3,844,967 | 629,008 |
| Mode M0 | |||
|---|---|---|---|
| Quadrant | BADHDUFLAG | Total packets | Discarded packets |
| A | 0 | 20138 | 3 |
| B | 0 | 16798 | 2 |
| C | 0 | 16794 | 2 |
| D | 0 | 17289 | 2 |
| Mode M9 | |||
|---|---|---|---|
| Quadrant | BADHDUFLAG | Total packets | Discarded packets |
| A | 0 | 11 | 0 |
| B | 0 | 11 | 0 |
| C | 0 | 11 | 0 |
| D | 0 | 11 | 0 |
| Mode SS | |||
|---|---|---|---|
| Quadrant | BADHDUFLAG | Total packets | Discarded packets |
| A | 0 | 164 | 0 |
| B | 0 | 164 | 0 |
| C | 0 | 164 | 0 |
| D | 0 | 164 | 0 |
| Quadrant | Total seconds | Saturated seconds | Saturation percentage |
|---|---|---|---|
| A | 8108 | 352 | 4.341391% |
| B | 8108 | 316 | 3.897385% |
| C | 8108 | 209 | 2.577701% |
| D | 8108 | 239 | 2.947706% |
Noise dominated data is calculated using 1-second bins in cleaned event files. If a bin has >2000 counts, and if more than 50% of those come from <1% of pixels, then it is considered to be noise-dominated and hence unusable.
| Quadrant | # 1 sec bins | Bins with >0 counts | Bins with >2000 counts | High rate bins dominated by noise | Noise dominated (total time) | Noise dominated (detector-on time) | Marked lightcurve |
|---|---|---|---|---|---|---|---|
| A | 9163 | 8108 | 27 | 27 | 0.29% | 0.33% | 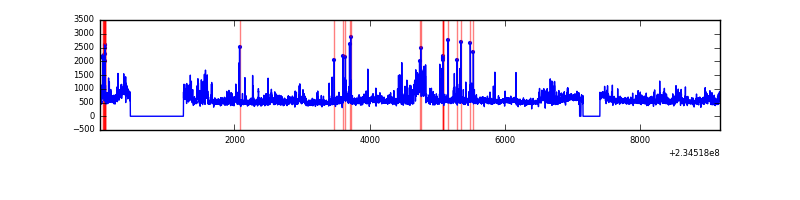 |
| B | 9163 | 8108 | 0 | 0 | 0.00% | 0.00% | 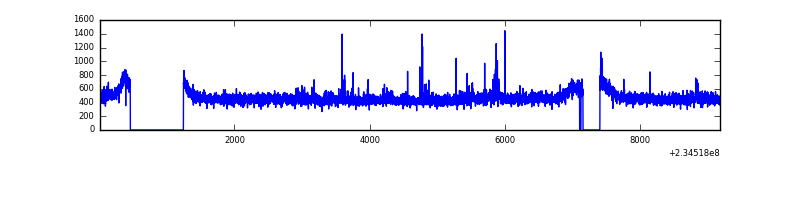 |
| C | 9163 | 8108 | 0 | 0 | 0.00% | 0.00% | 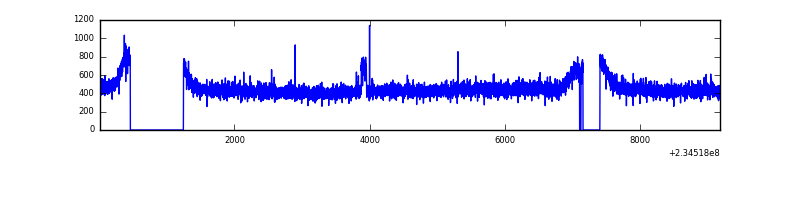 |
| D | 9163 | 8108 | 17 | 17 | 0.19% | 0.21% | 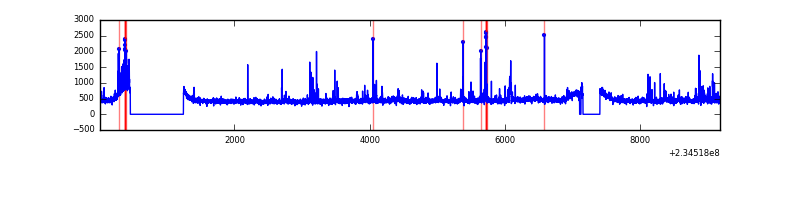 |
Top three noisy pixels from each quadrant. If the there are fewer than three noisy pixels in the level2.evt file, extra rows are filled as -1
| Pixel properties | Quadrant properties | ||||||
|---|---|---|---|---|---|---|---|
| Quadrant | DetID | PixID | Counts | Sigma | Mean | Median | Sigma |
| A | 8 | 5 | 1203067 | 6185.99 | 947 | 923 | 194.3 |
| A | 5 | 16 | 84616 | 430.67 | 947 | 923 | 194.3 |
| A | 1 | 162 | 49050 | 247.65 | 947 | 923 | 194.3 |
| B | 0 | 219 | 41173 | 219.93 | 956 | 932 | 183.0 |
| B | 12 | 111 | 20341 | 106.08 | 956 | 932 | 183.0 |
| B | 11 | 111 | 16590 | 85.58 | 956 | 932 | 183.0 |
| C | 9 | 68 | 27050 | 122.25 | 926 | 925 | 213.7 |
| C | 13 | 61 | 6877 | 27.85 | 926 | 925 | 213.7 |
| C | 8 | 128 | 6404 | 25.64 | 926 | 925 | 213.7 |
| D | 1 | 52 | 139619 | 581.77 | 916 | 887 | 238.5 |
| D | 2 | 14 | 109871 | 457.02 | 916 | 887 | 238.5 |
| D | 7 | 71 | 45169 | 185.69 | 916 | 887 | 238.5 |
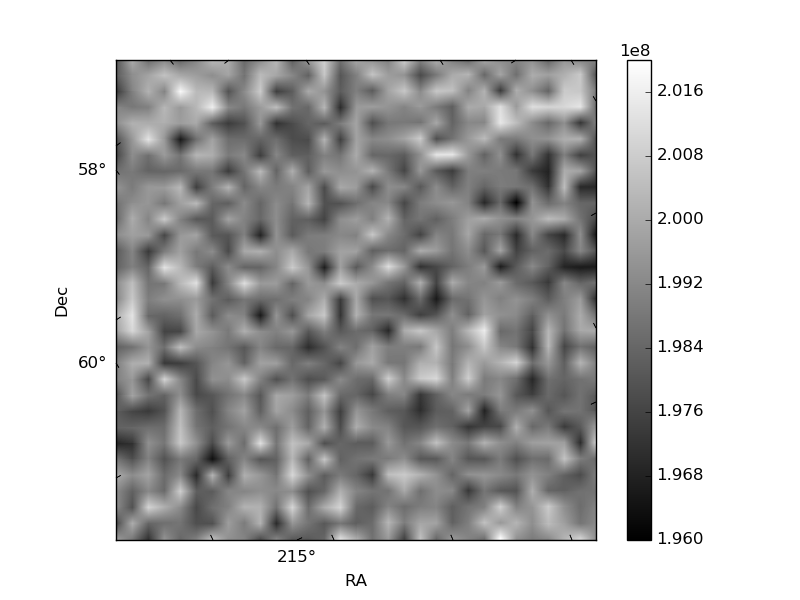
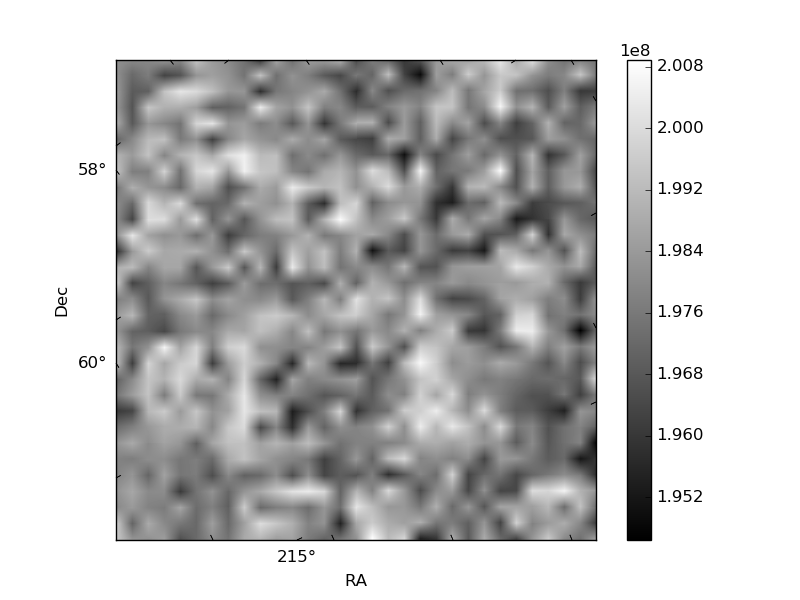
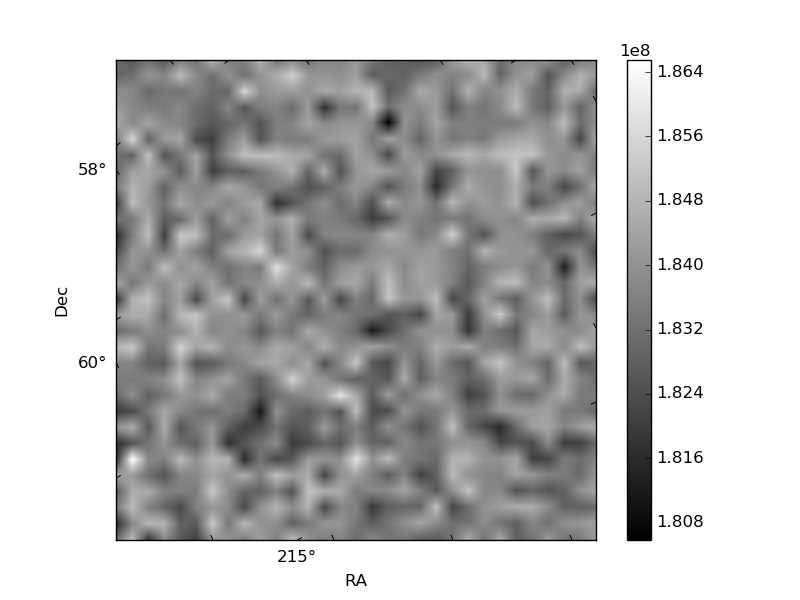
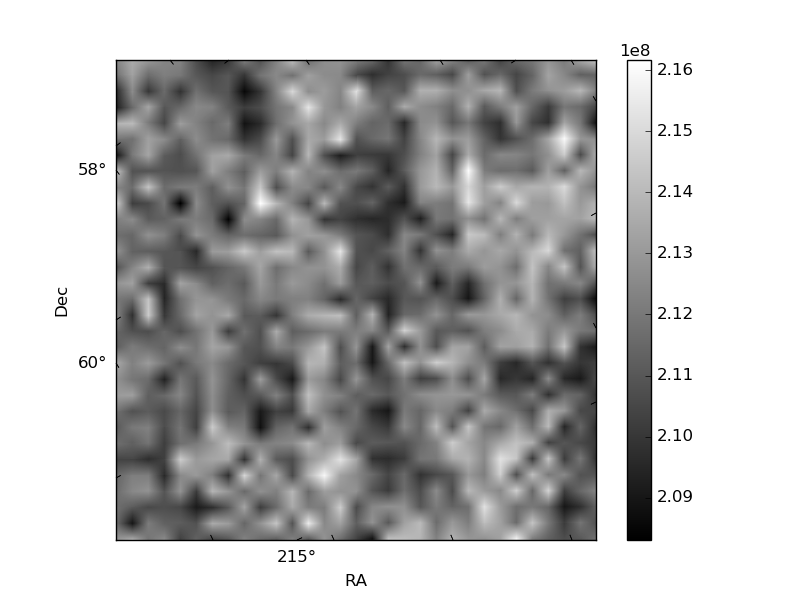
Histogram calculated using DETX and DETY for each event in the final _common_clean file
| Quadrant A | 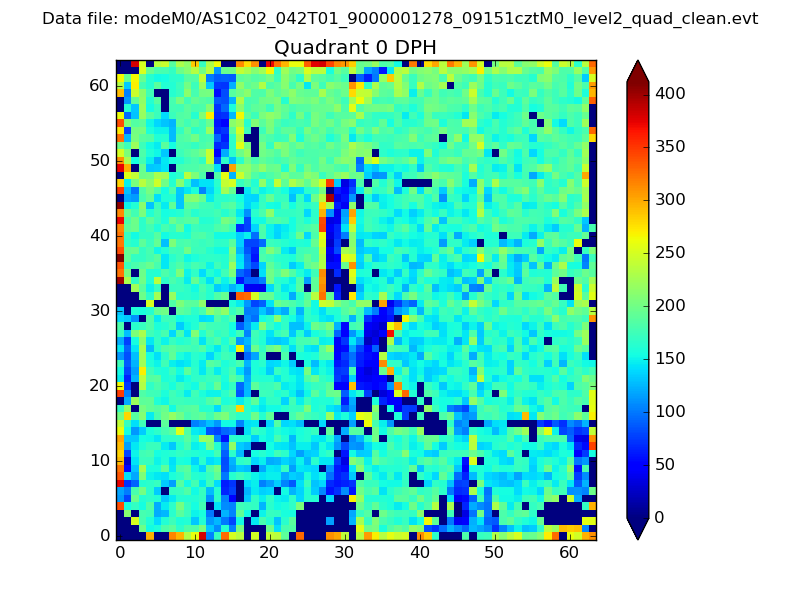 |
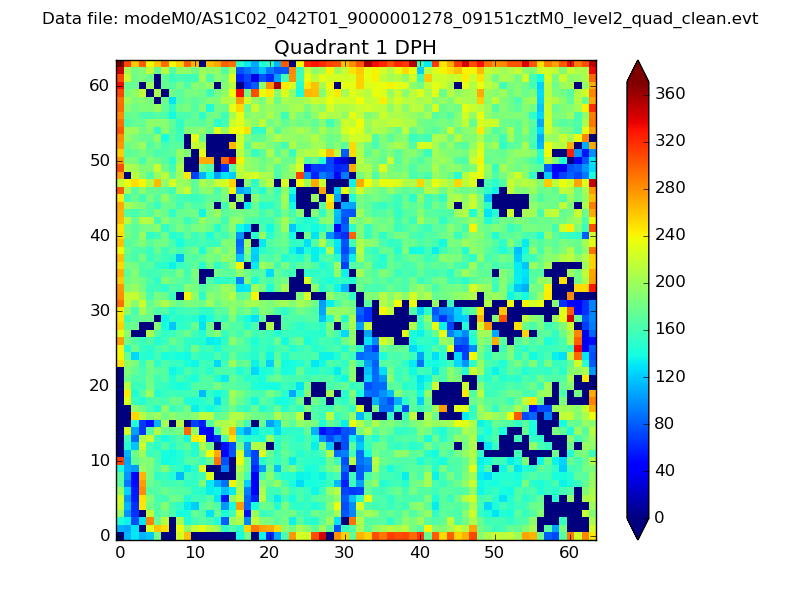 |
Quadrant B |
|---|---|---|---|
| Quadrant D |  |
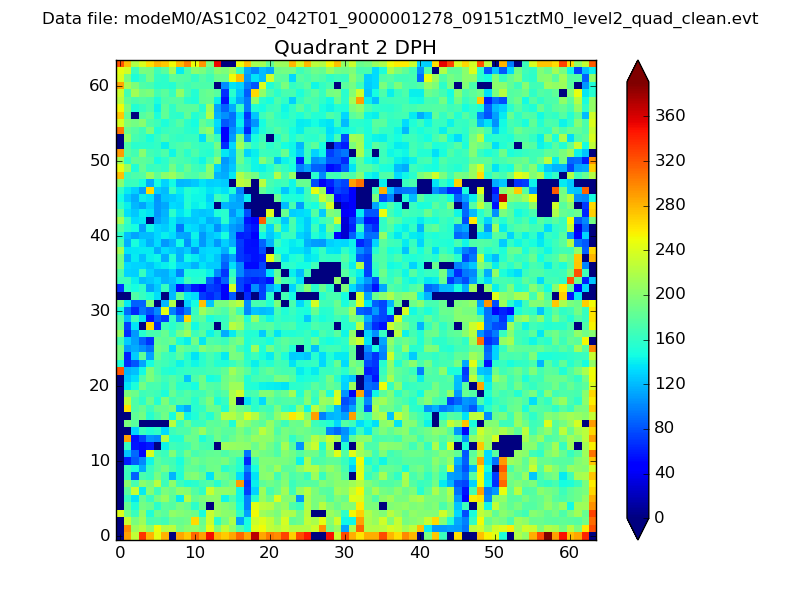 |
Quadrant C |
| Plot type | Count rate plots | Images |
|---|---|---|
| Comparison with Poisson distribution Blue bars denote a histogram of data divided into 1 sec bins. Red curve is a Poisson curve with rate = median count rate of data. |
 |
 |
| Quadrant-wise count rates Data is divided into 100 sec bins |
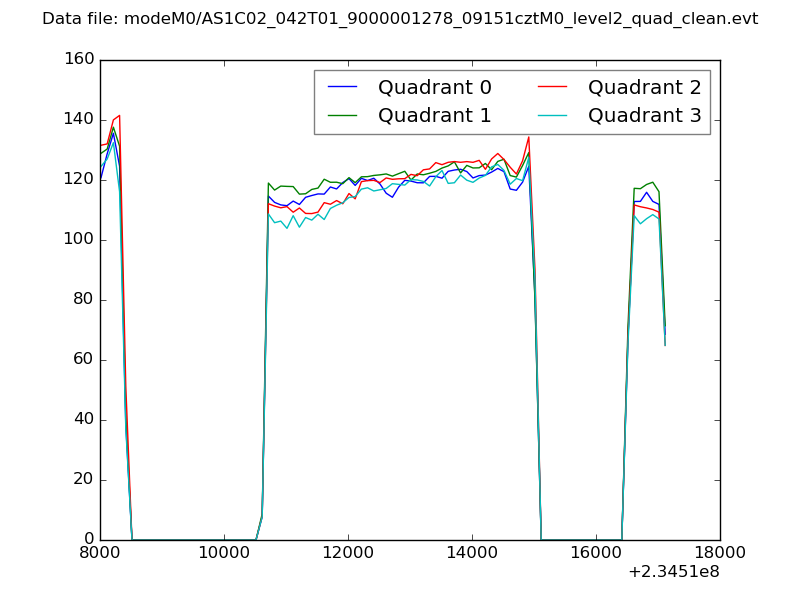 |
|
| Module-wise count rates for Quadrant A Data is divided into 100 sec bins |
 |
 |
| Module-wise count rates for Quadrant B Data is divided into 100 sec bins |
 |
 |
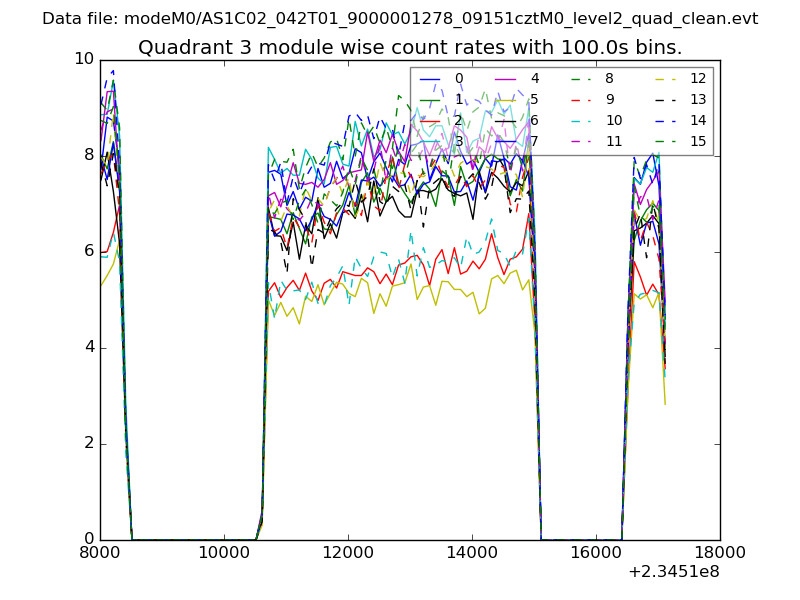
| Module-wise count rates for Quadrant C Data is divided into 100 sec bins |
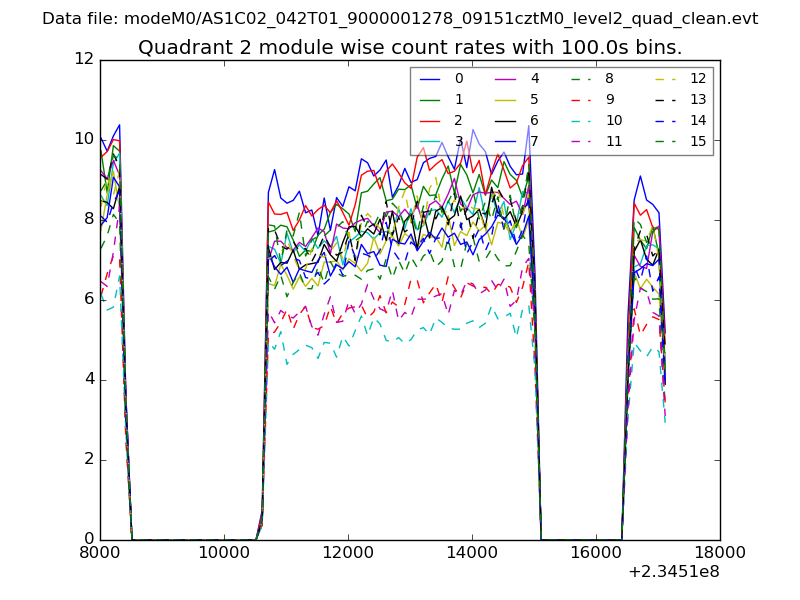 |
 |
| Module-wise count rates for Quadrant D Data is divided into 100 sec bins |
 |
 |
| Parameter | Plot |
|---|---|
| CZT HV Monitor |  |
| D_VDD | 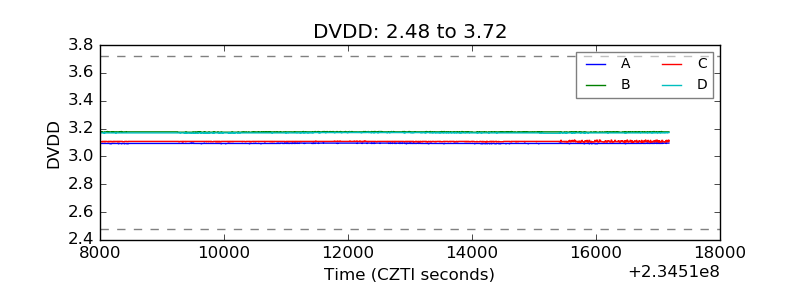 |
| Temperature 1 | 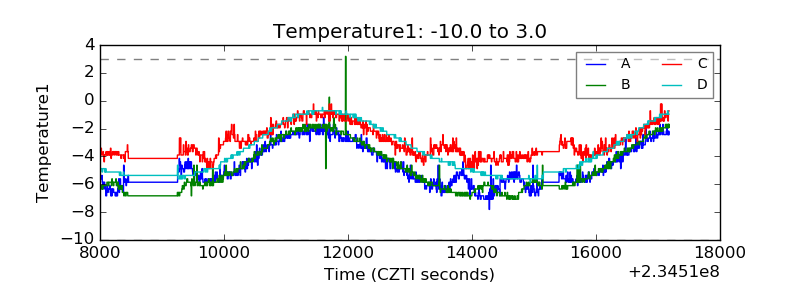 |
| Veto HV Monitor | 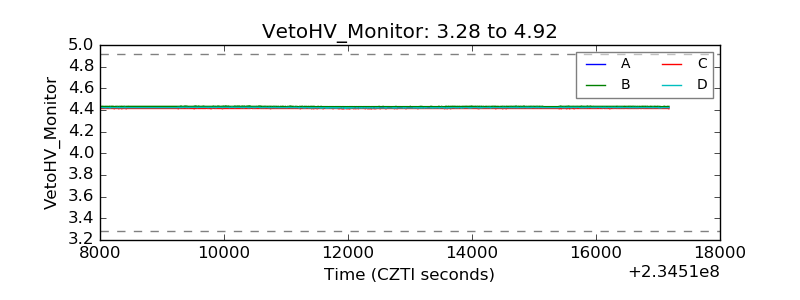 |
| Veto LLD |  |
| Alpha Counter | 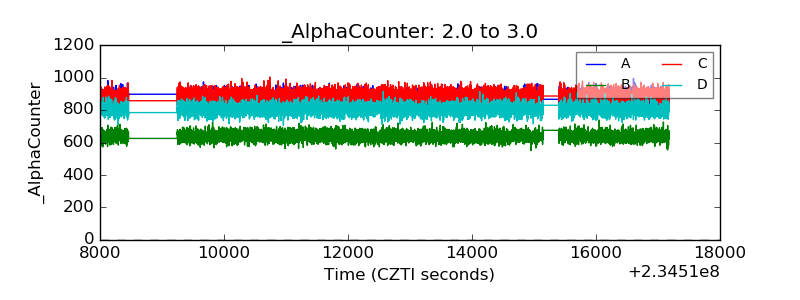 |
| _CPM_Rate | 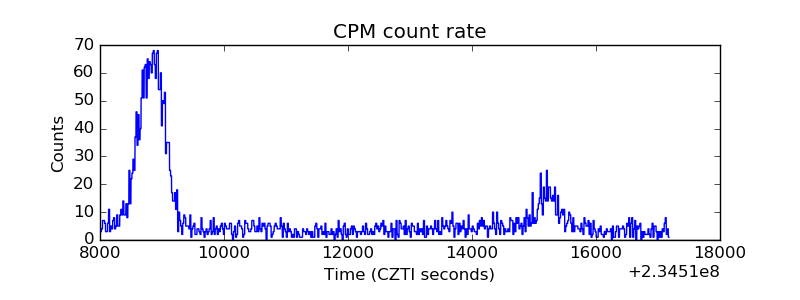 |
| CZT Counter | 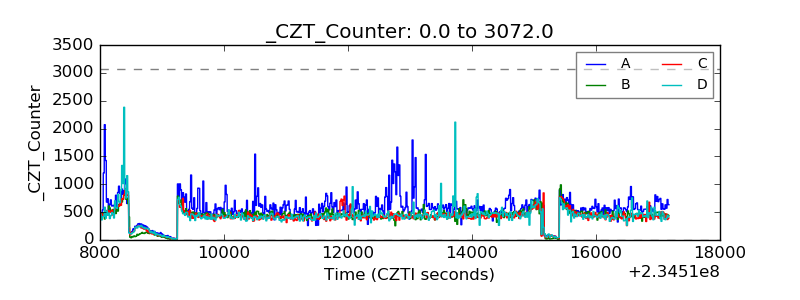 |
| +2.5 Volts monitor |  |
| +5 Volts monitor |  |
| _ROLL_ROT | 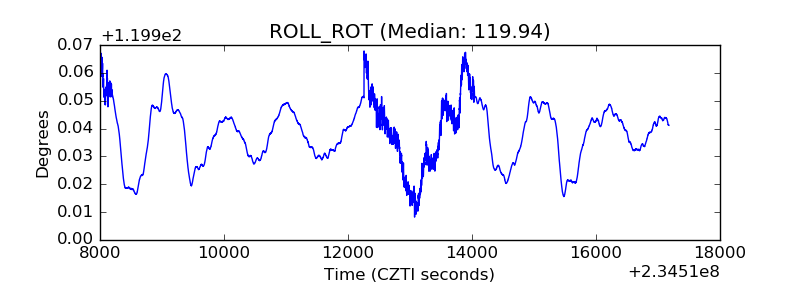 |
| _Roll_DEC | 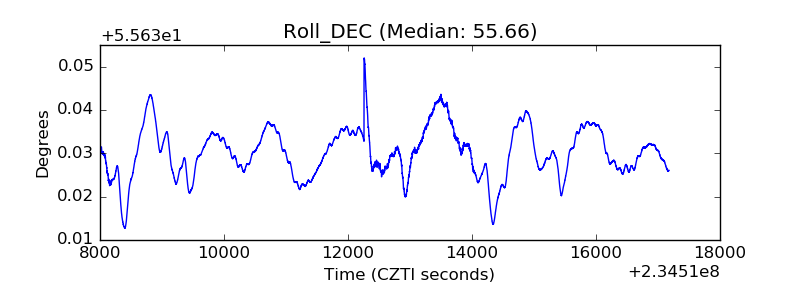 |
| _Roll_RA | 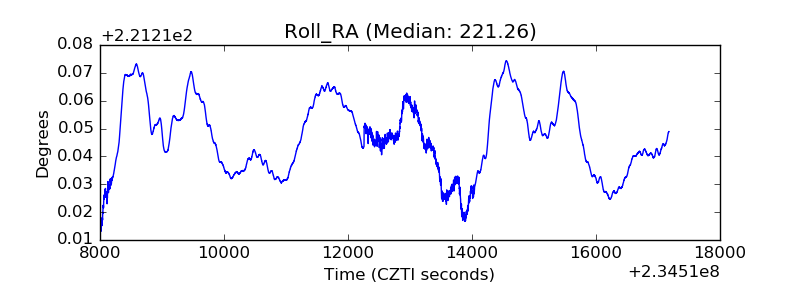 |
| Veto Counter |  |