| Param | Original file | Final file |
|---|---|---|
| Filename | modeM0/AS1C02_042T01_9000001278_09152cztM0_level2.evt | modeM0/AS1C02_042T01_9000001278_09152cztM0_level2_quad_clean.evt |
| Size (bytes) | 537,675,840 | 99,840,960 |
| Size | 512.8 MB | 95.2 MB |
| Events in quadrant A | 4,863,235 | 620,917 |
| Events in quadrant B | 3,637,902 | 633,124 |
| Events in quadrant C | 3,536,985 | 620,603 |
| Events in quadrant D | 3,710,243 | 601,129 |
| Mode M0 | |||
|---|---|---|---|
| Quadrant | BADHDUFLAG | Total packets | Discarded packets |
| A | 0 | 19668 | 2 |
| B | 0 | 16263 | 6 |
| C | 0 | 16212 | 3 |
| D | 0 | 16801 | 3 |
| Mode SS | |||
|---|---|---|---|
| Quadrant | BADHDUFLAG | Total packets | Discarded packets |
| A | 0 | 158 | 0 |
| B | 0 | 158 | 0 |
| C | 0 | 158 | 0 |
| D | 0 | 158 | 0 |
| Quadrant | Total seconds | Saturated seconds | Saturation percentage |
|---|---|---|---|
| A | 7880 | 227 | 2.880711% |
| B | 7878 | 158 | 2.005585% |
| C | 7879 | 108 | 1.370732% |
| D | 7879 | 165 | 2.094174% |
Noise dominated data is calculated using 1-second bins in cleaned event files. If a bin has >2000 counts, and if more than 50% of those come from <1% of pixels, then it is considered to be noise-dominated and hence unusable.
| Quadrant | # 1 sec bins | Bins with >0 counts | Bins with >2000 counts | High rate bins dominated by noise | Noise dominated (total time) | Noise dominated (detector-on time) | Marked lightcurve |
|---|---|---|---|---|---|---|---|
| A | 7880 | 7880 | 2 | 2 | 0.03% | 0.03% | 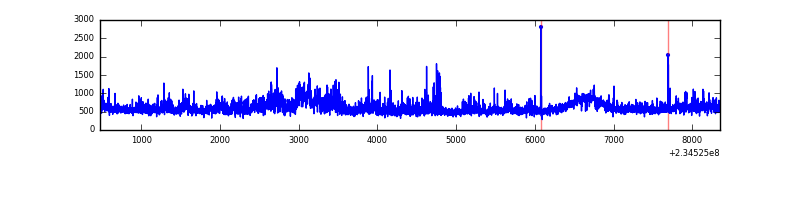 |
| B | 7880 | 7880 | 1 | 1 | 0.01% | 0.01% | 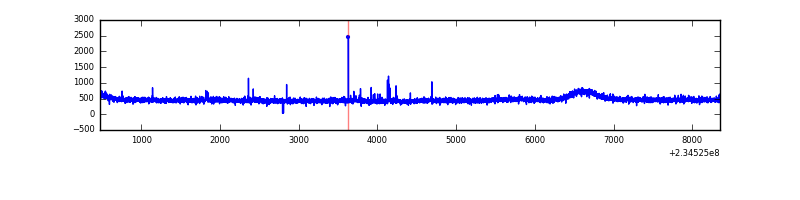 |
| C | 7880 | 7880 | 1 | 1 | 0.01% | 0.01% | 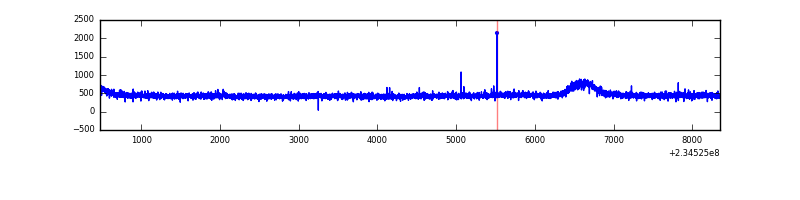 |
| D | 7880 | 7880 | 41 | 41 | 0.52% | 0.52% | 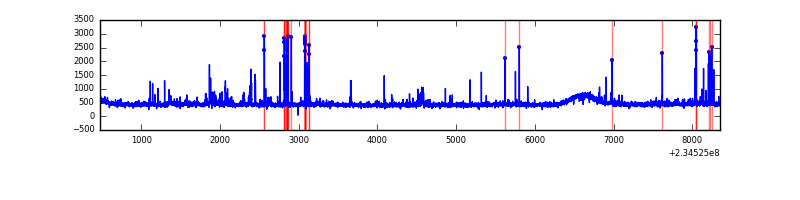 |
Top three noisy pixels from each quadrant. If the there are fewer than three noisy pixels in the level2.evt file, extra rows are filled as -1
| Pixel properties | Quadrant properties | ||||||
|---|---|---|---|---|---|---|---|
| Quadrant | DetID | PixID | Counts | Sigma | Mean | Median | Sigma |
| A | 8 | 5 | 1192752 | 6311.94 | 917 | 895 | 188.8 |
| A | 1 | 162 | 49113 | 255.36 | 917 | 895 | 188.8 |
| A | 5 | 16 | 36764 | 189.96 | 917 | 895 | 188.8 |
| B | 12 | 111 | 19752 | 106.9 | 924 | 899 | 176.4 |
| B | 11 | 111 | 15943 | 85.3 | 924 | 899 | 176.4 |
| B | 0 | 213 | 13543 | 71.7 | 924 | 899 | 176.4 |
| C | 8 | 128 | 18460 | 85.2 | 894 | 895 | 206.2 |
| C | 8 | 112 | 9269 | 40.62 | 894 | 895 | 206.2 |
| C | 8 | 144 | 7022 | 29.72 | 894 | 895 | 206.2 |
| D | 7 | 71 | 141393 | 604.86 | 890 | 864 | 232.3 |
| D | 1 | 52 | 82182 | 350.01 | 890 | 864 | 232.3 |
| D | 2 | 14 | 43637 | 184.1 | 890 | 864 | 232.3 |
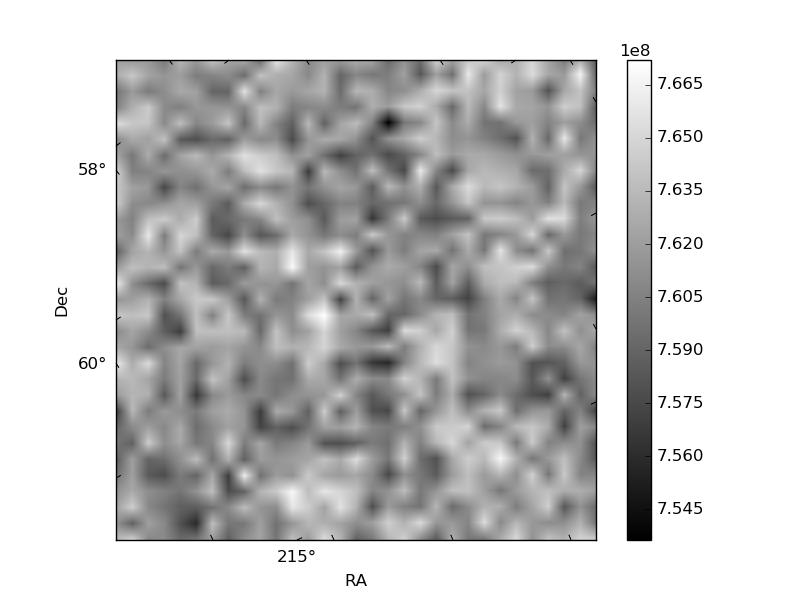
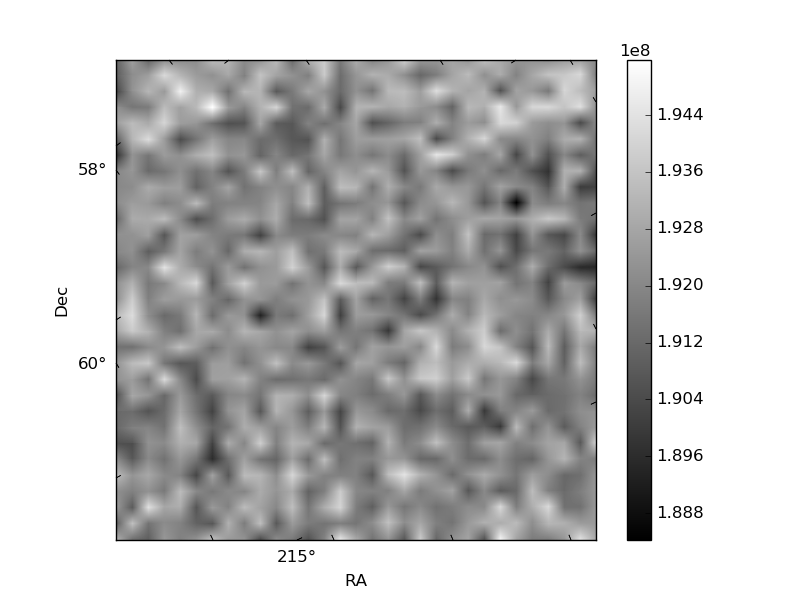
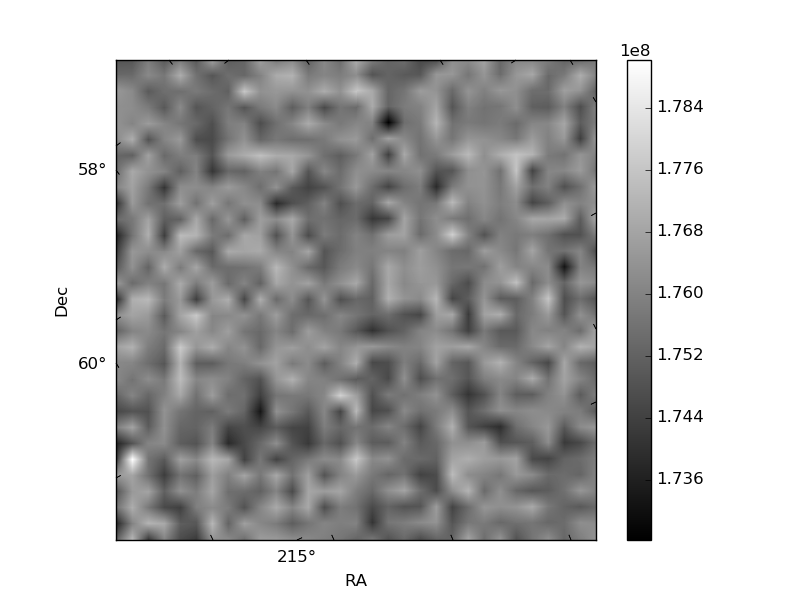
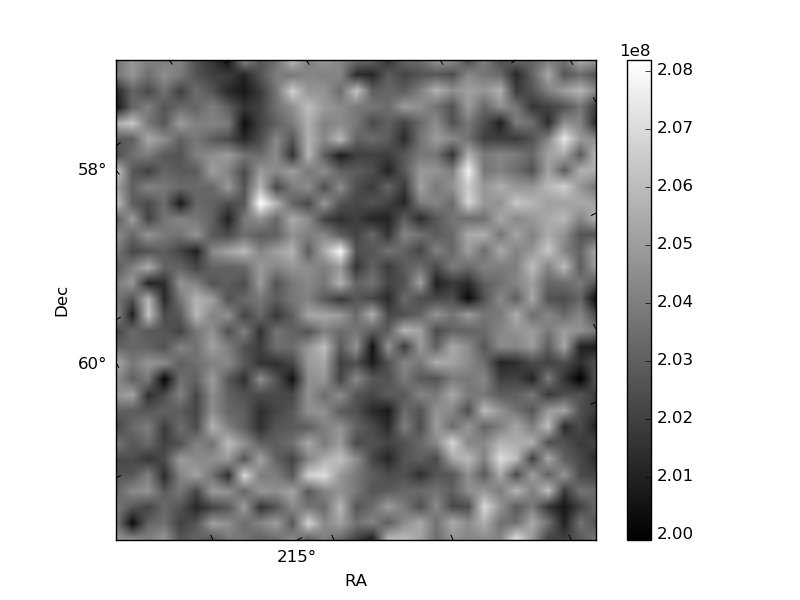
Histogram calculated using DETX and DETY for each event in the final _common_clean file
| Quadrant A | 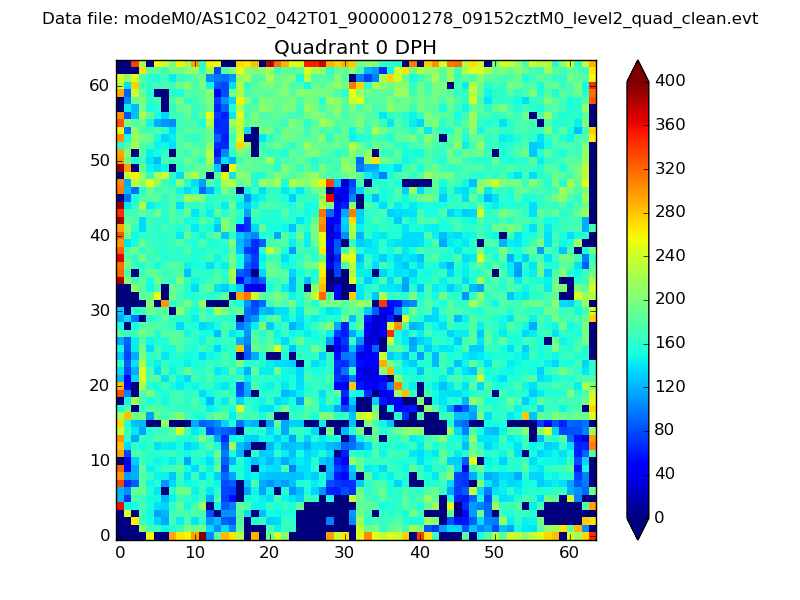 |
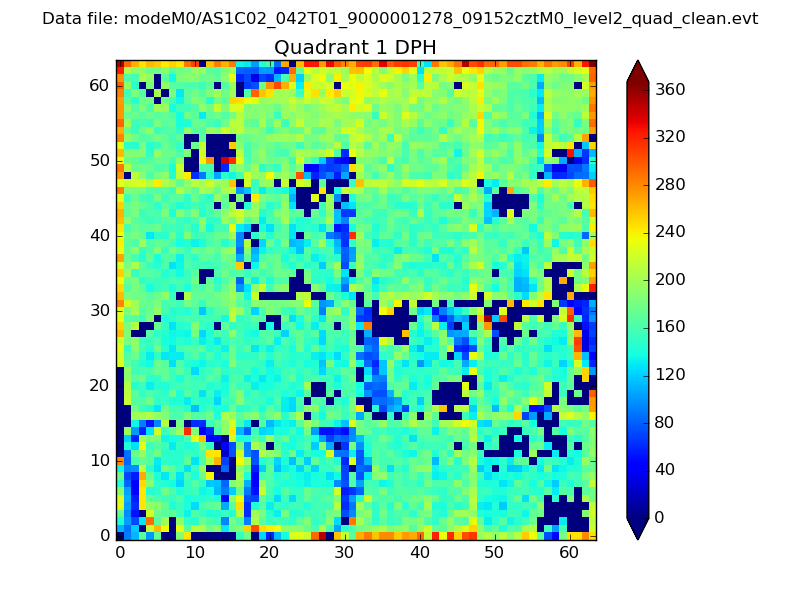 |
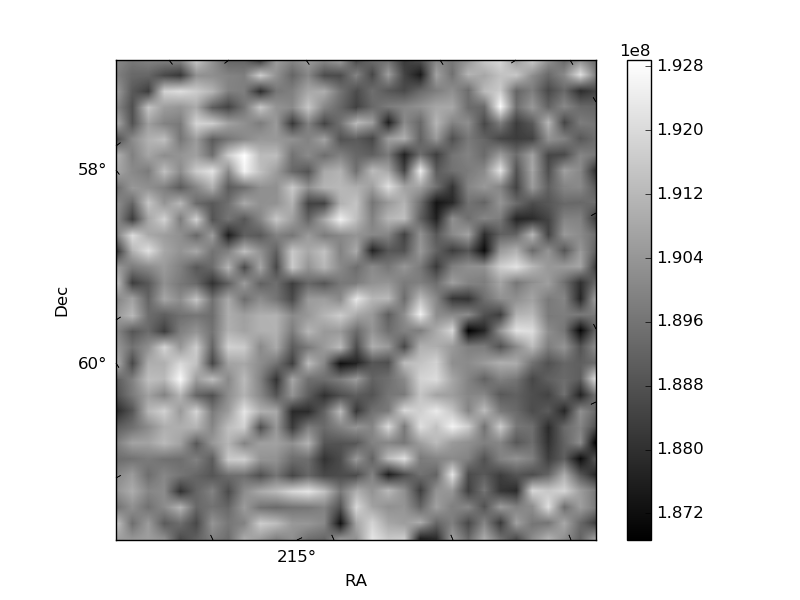
Quadrant B |
|---|---|---|---|
| Quadrant D | 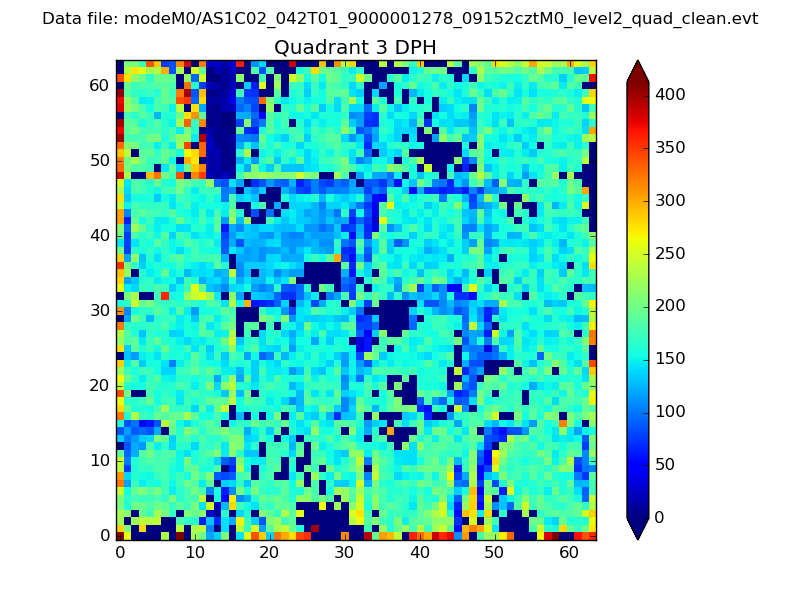 |
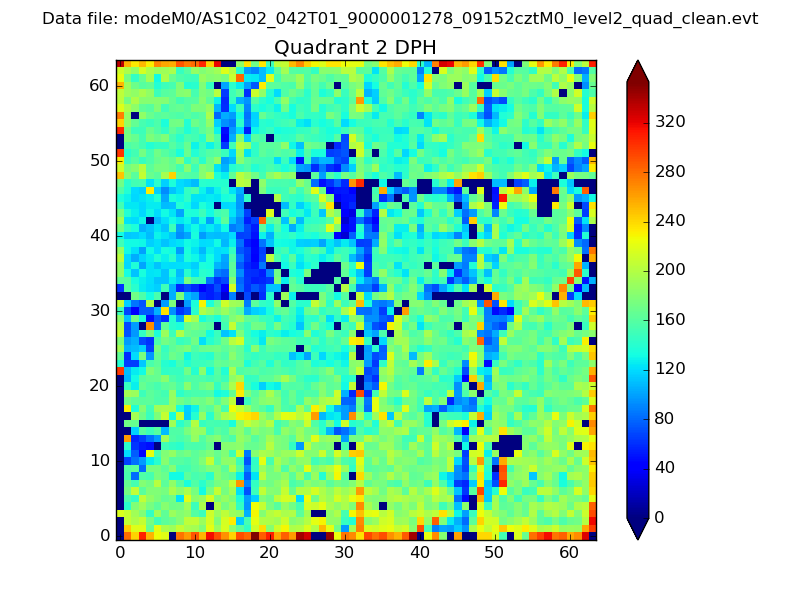 |
Quadrant C |
| Plot type | Count rate plots | Images |
|---|---|---|
| Comparison with Poisson distribution Blue bars denote a histogram of data divided into 1 sec bins. Red curve is a Poisson curve with rate = median count rate of data. |
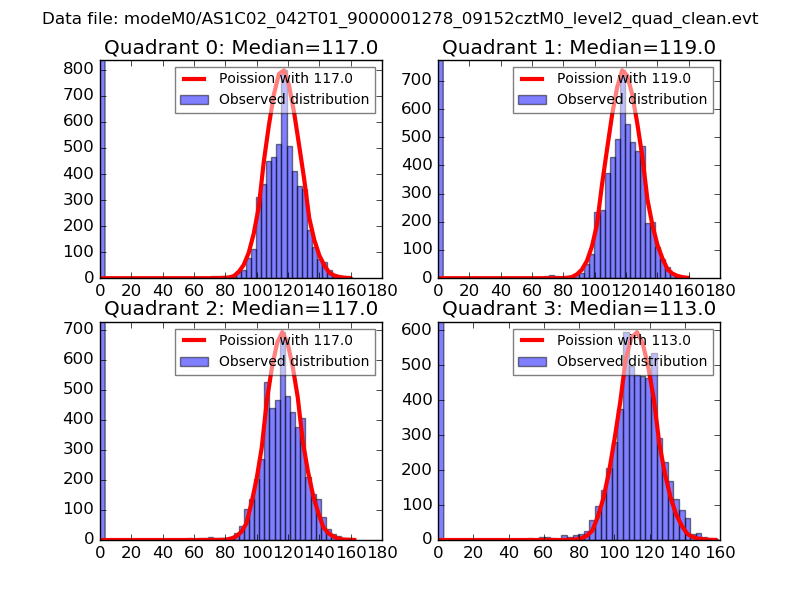 |
 |
| Quadrant-wise count rates Data is divided into 100 sec bins |
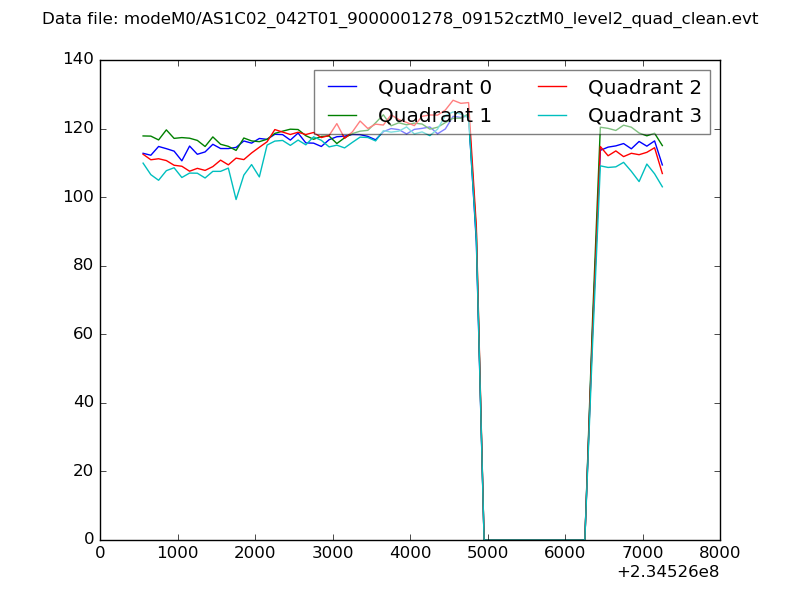 |
|
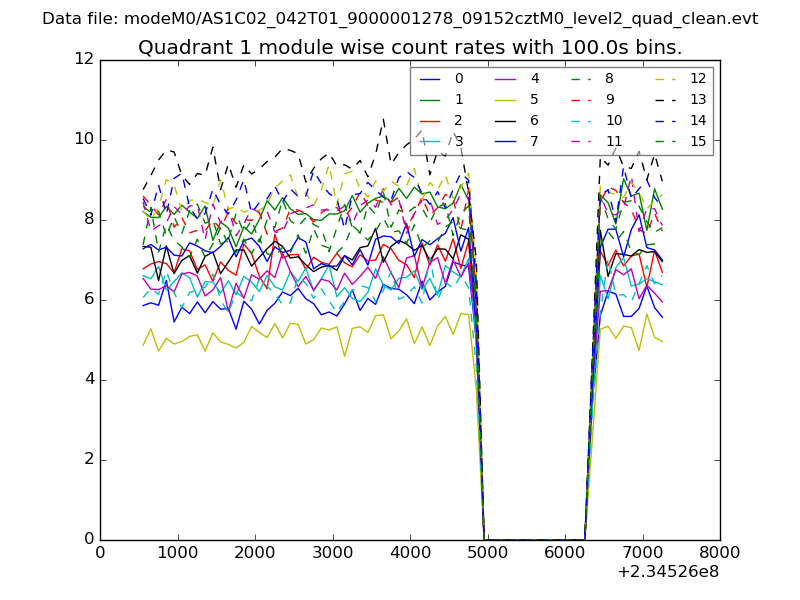
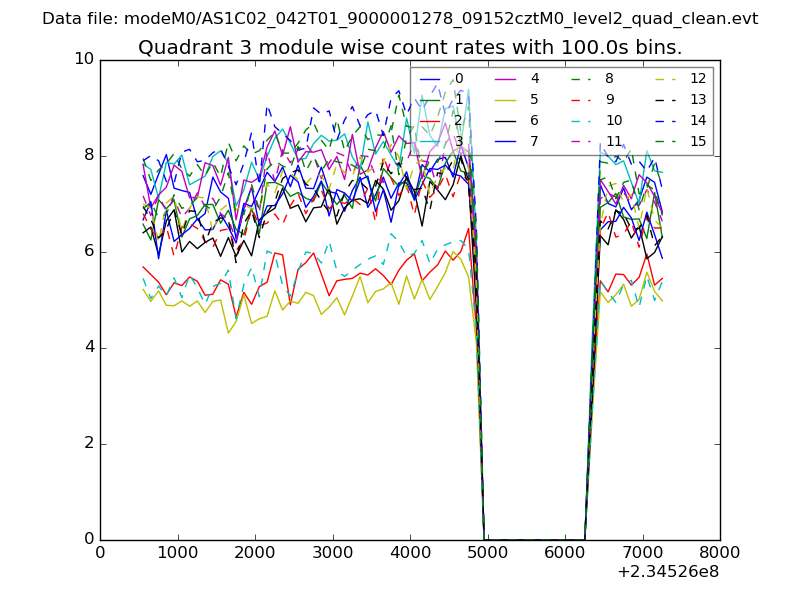
| Module-wise count rates for Quadrant A Data is divided into 100 sec bins |
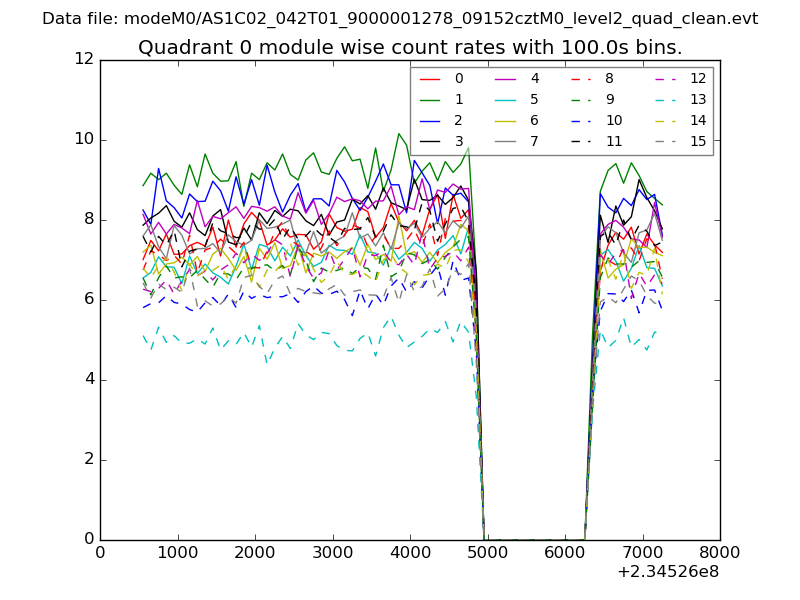 |
 |
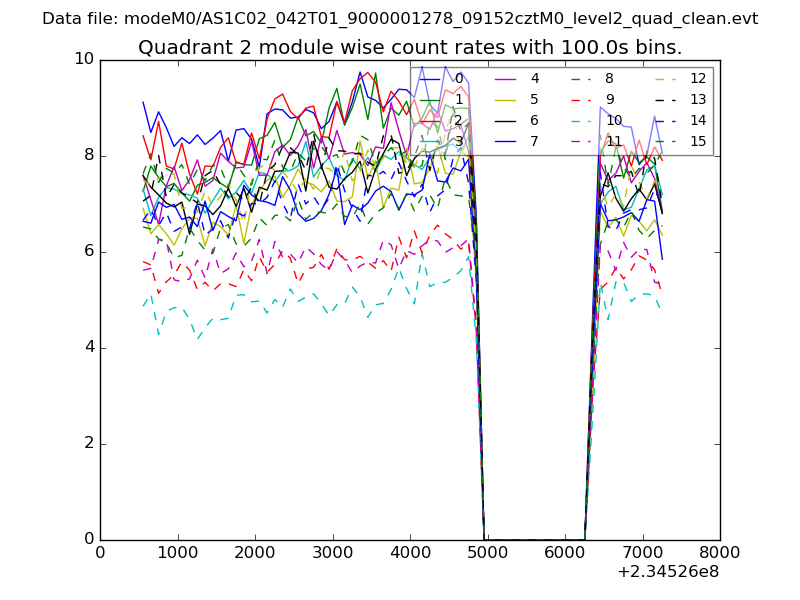
| Module-wise count rates for Quadrant B Data is divided into 100 sec bins |
 |
 |
| Module-wise count rates for Quadrant C Data is divided into 100 sec bins |
 |
 |
| Module-wise count rates for Quadrant D Data is divided into 100 sec bins |
 |
 |
| Parameter | Plot |
|---|---|
| CZT HV Monitor | 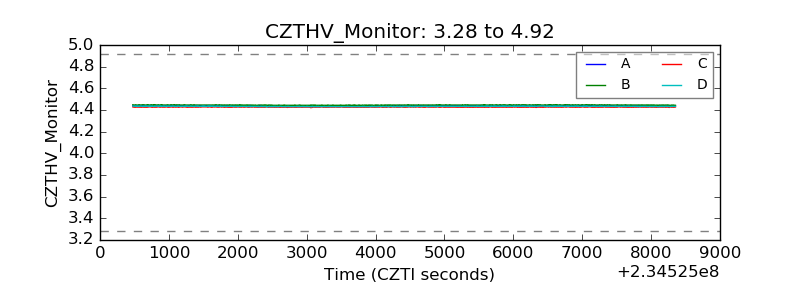 |
| D_VDD |  |
| Temperature 1 |  |
| Veto HV Monitor | 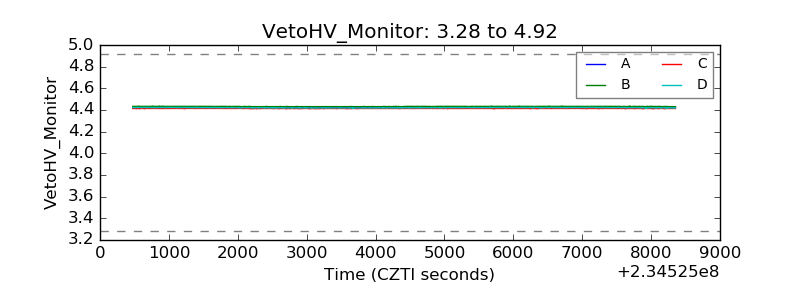 |
| Veto LLD | 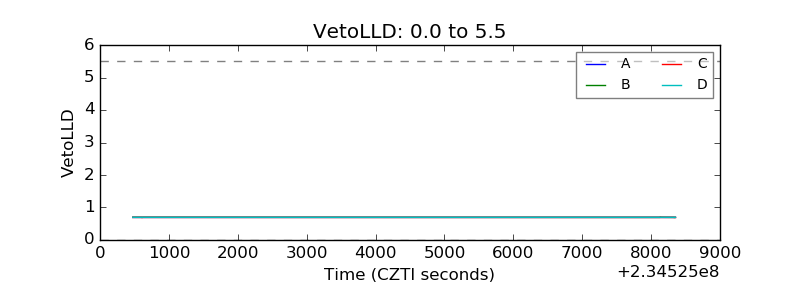 |
| Alpha Counter | 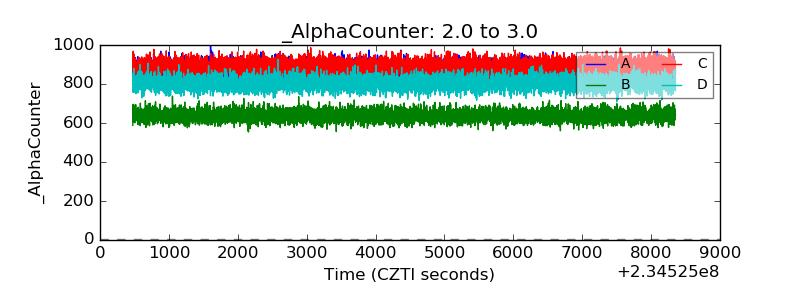 |
| _CPM_Rate | 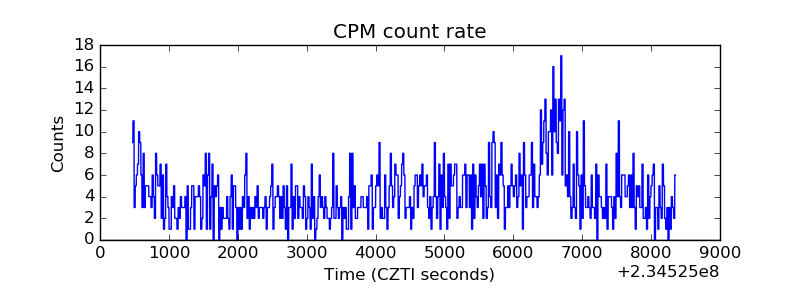 |
| CZT Counter | 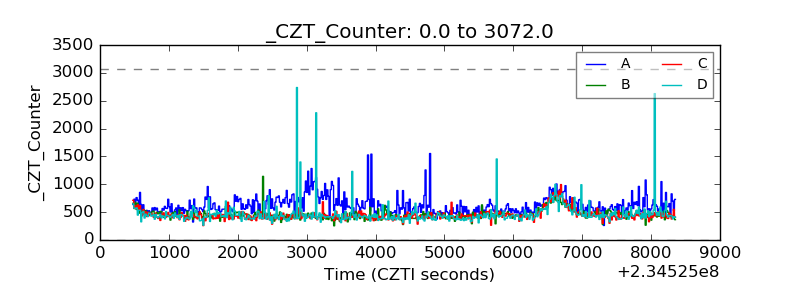 |
| +2.5 Volts monitor |  |
| +5 Volts monitor |  |
| _ROLL_ROT | 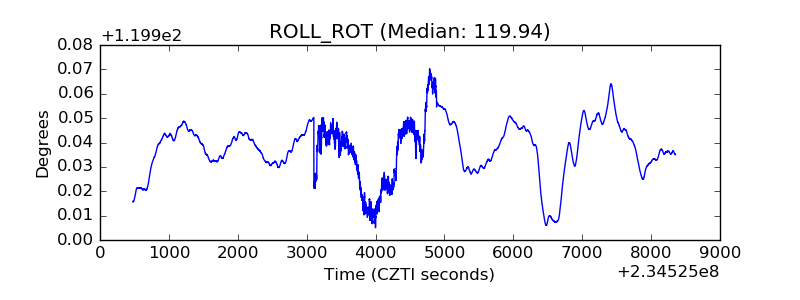 |
| _Roll_DEC | 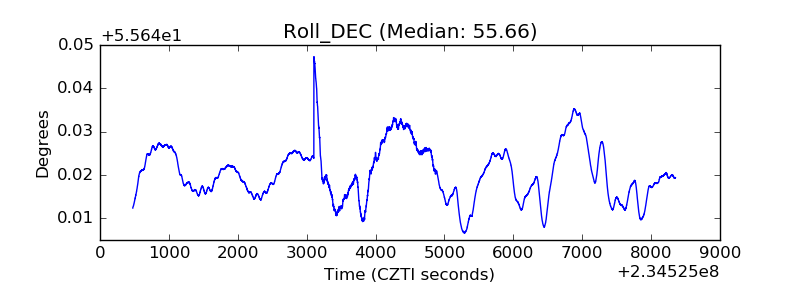 |
| _Roll_RA | 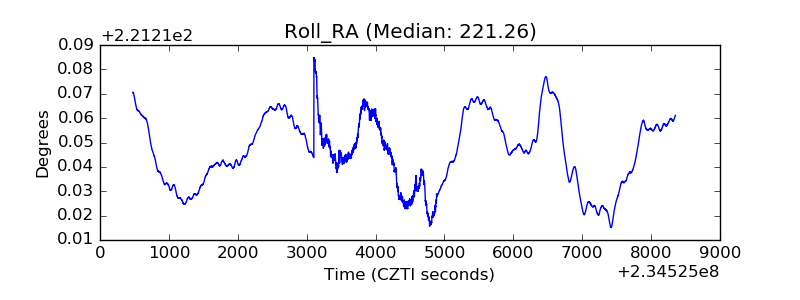 |
| Veto Counter |  |