| Param | Original file | Final file |
|---|---|---|
| Filename | modeM0/AS1C02_042T01_9000001278_09153cztM0_level2.evt | modeM0/AS1C02_042T01_9000001278_09153cztM0_level2_quad_clean.evt |
| Size (bytes) | 599,106,240 | 105,946,560 |
| Size | 571.4 MB | 101.0 MB |
| Events in quadrant A | 4,950,381 | 672,147 |
| Events in quadrant B | 3,838,886 | 683,544 |
| Events in quadrant C | 3,700,535 | 671,360 |
| Events in quadrant D | 5,107,351 | 621,307 |
| Mode M0 | |||
|---|---|---|---|
| Quadrant | BADHDUFLAG | Total packets | Discarded packets |
| A | 0 | 20085 | 2 |
| B | 0 | 16893 | 1 |
| C | 0 | 16766 | 4 |
| D | 0 | 20854 | 3 |
| Mode M9 | |||
|---|---|---|---|
| Quadrant | BADHDUFLAG | Total packets | Discarded packets |
| A | 0 | 2 | 0 |
| B | 0 | 2 | 0 |
| C | 0 | 2 | 0 |
| D | 0 | 2 | 0 |
| Mode SS | |||
|---|---|---|---|
| Quadrant | BADHDUFLAG | Total packets | Discarded packets |
| A | 0 | 164 | 0 |
| B | 0 | 164 | 0 |
| C | 0 | 164 | 0 |
| D | 0 | 164 | 0 |
| Quadrant | Total seconds | Saturated seconds | Saturation percentage |
|---|---|---|---|
| A | 8054 | 329 | 4.084927% |
| B | 8054 | 258 | 3.203377% |
| C | 8053 | 207 | 2.570471% |
| D | 8053 | 608 | 7.549981% |
Noise dominated data is calculated using 1-second bins in cleaned event files. If a bin has >2000 counts, and if more than 50% of those come from <1% of pixels, then it is considered to be noise-dominated and hence unusable.
| Quadrant | # 1 sec bins | Bins with >0 counts | Bins with >2000 counts | High rate bins dominated by noise | Noise dominated (total time) | Noise dominated (detector-on time) | Marked lightcurve |
|---|---|---|---|---|---|---|---|
| A | 8274 | 8054 | 2 | 2 | 0.02% | 0.02% | 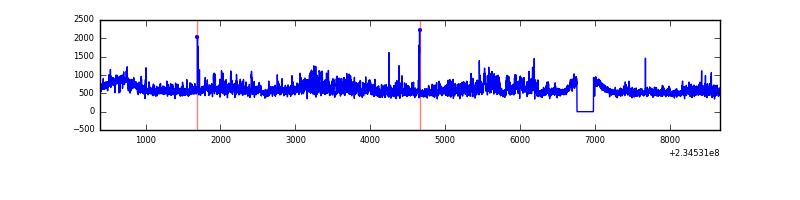 |
| B | 8274 | 8054 | 5 | 5 | 0.06% | 0.06% | 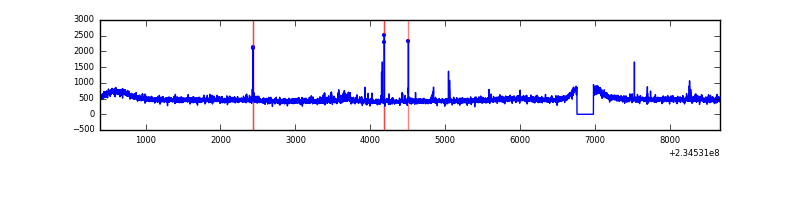 |
| C | 8274 | 8053 | 0 | 0 | 0.00% | 0.00% | 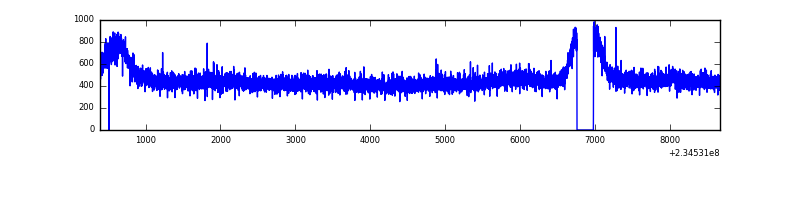 |
| D | 8274 | 8054 | 384 | 384 | 4.64% | 4.77% | 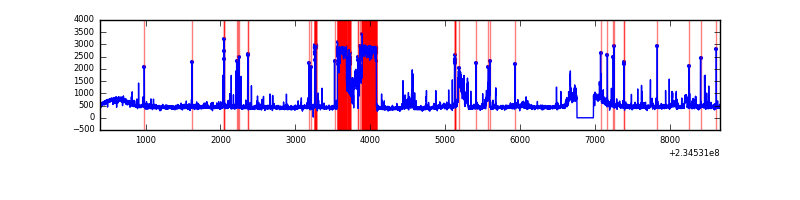 |
Top three noisy pixels from each quadrant. If the there are fewer than three noisy pixels in the level2.evt file, extra rows are filled as -1
| Pixel properties | Quadrant properties | ||||||
|---|---|---|---|---|---|---|---|
| Quadrant | DetID | PixID | Counts | Sigma | Mean | Median | Sigma |
| A | 8 | 5 | 1084991 | 5499.74 | 959 | 935 | 197.1 |
| A | 1 | 162 | 81991 | 411.22 | 959 | 935 | 197.1 |
| A | 5 | 16 | 40004 | 198.21 | 959 | 935 | 197.1 |
| B | 0 | 219 | 44919 | 239.47 | 963 | 938 | 183.7 |
| B | 12 | 111 | 20211 | 104.94 | 963 | 938 | 183.7 |
| B | 11 | 111 | 16663 | 85.62 | 963 | 938 | 183.7 |
| C | 8 | 128 | 13130 | 56.16 | 939 | 938 | 217.1 |
| C | 8 | 112 | 7448 | 29.99 | 939 | 938 | 217.1 |
| C | 13 | 61 | 7334 | 29.46 | 939 | 938 | 217.1 |
| D | 1 | 52 | 1191194 | 4899.97 | 913 | 887 | 242.9 |
| D | 2 | 14 | 243034 | 996.81 | 913 | 887 | 242.9 |
| D | 7 | 71 | 74234 | 301.94 | 913 | 887 | 242.9 |
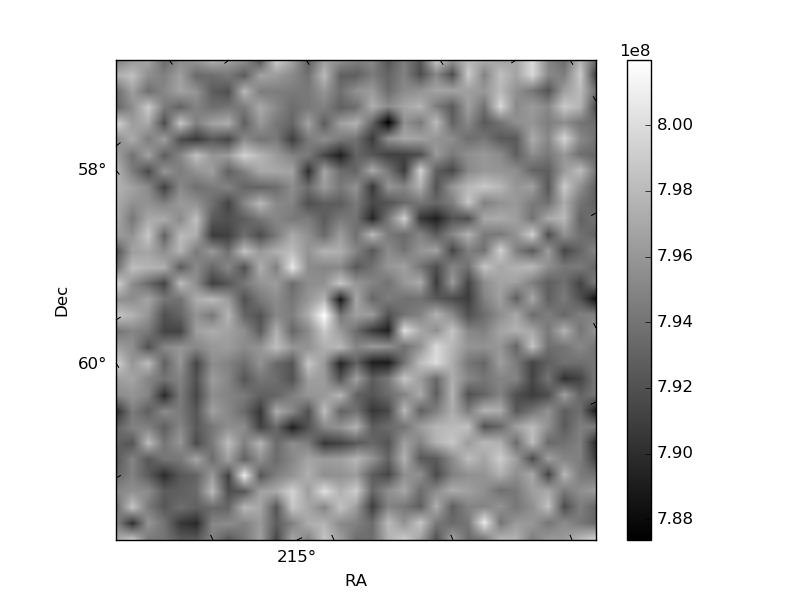
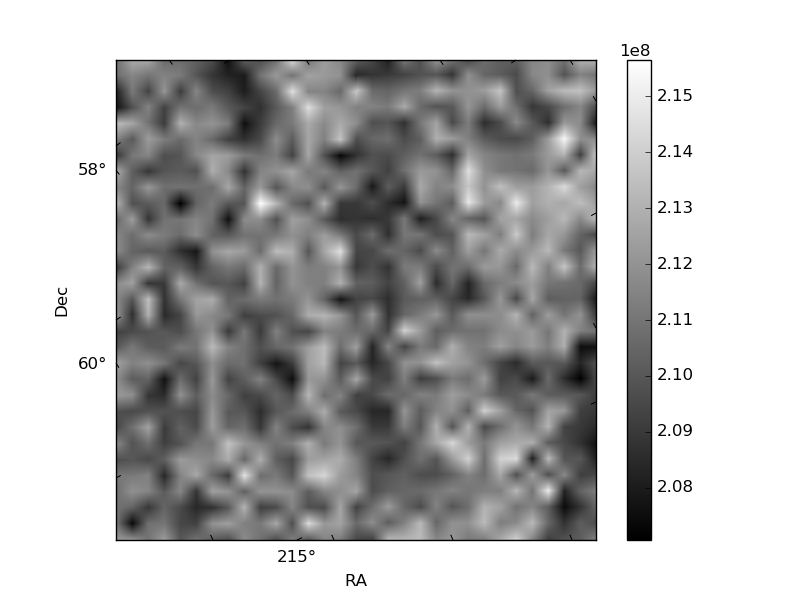
Histogram calculated using DETX and DETY for each event in the final _common_clean file
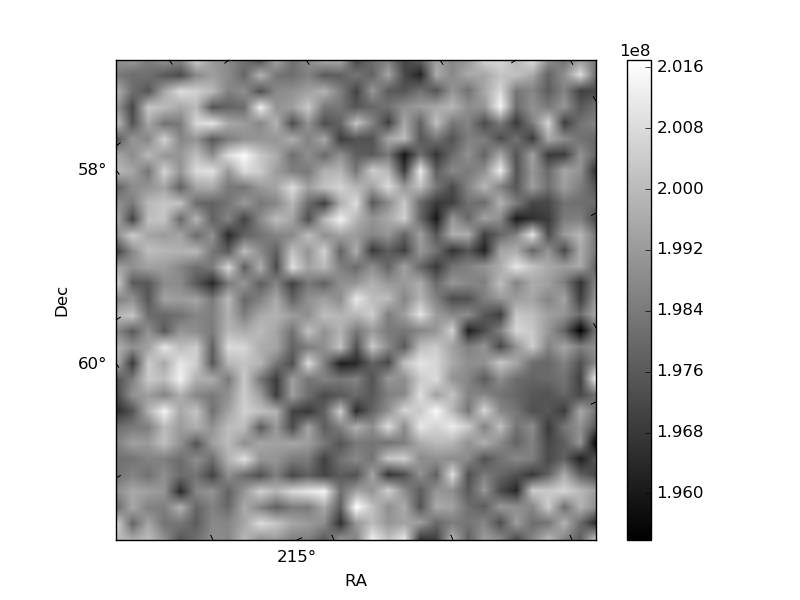
| Quadrant A | 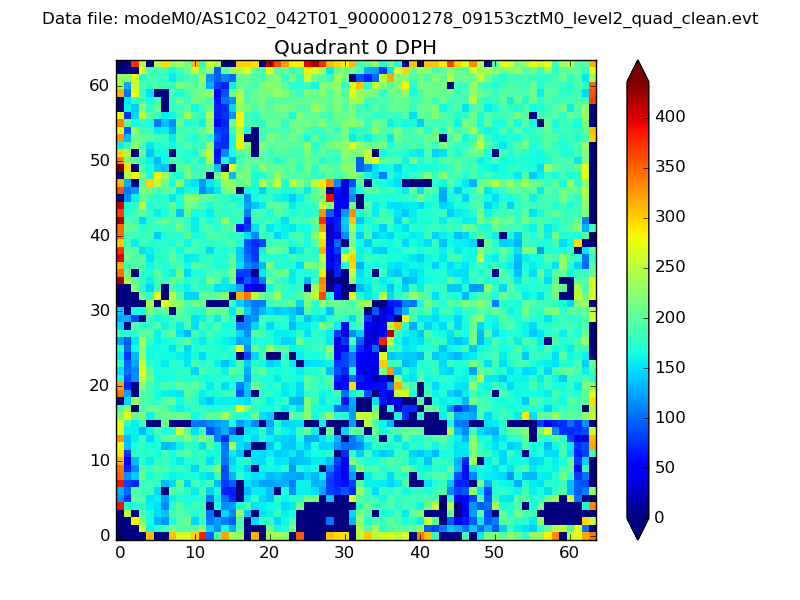 |
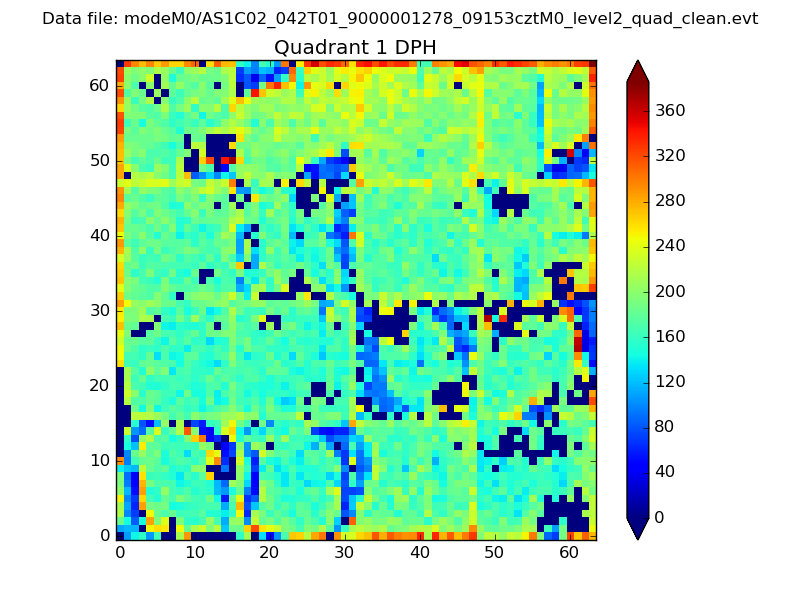 |
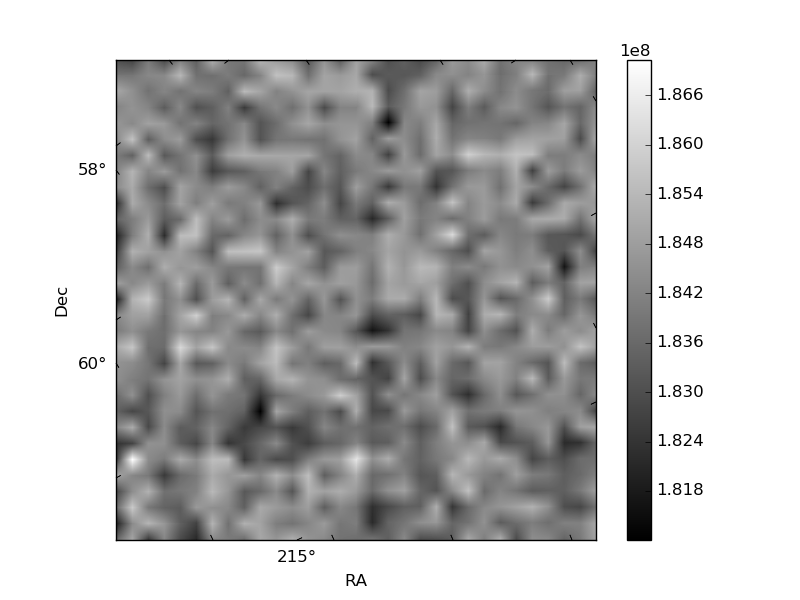
Quadrant B |
|---|---|---|---|
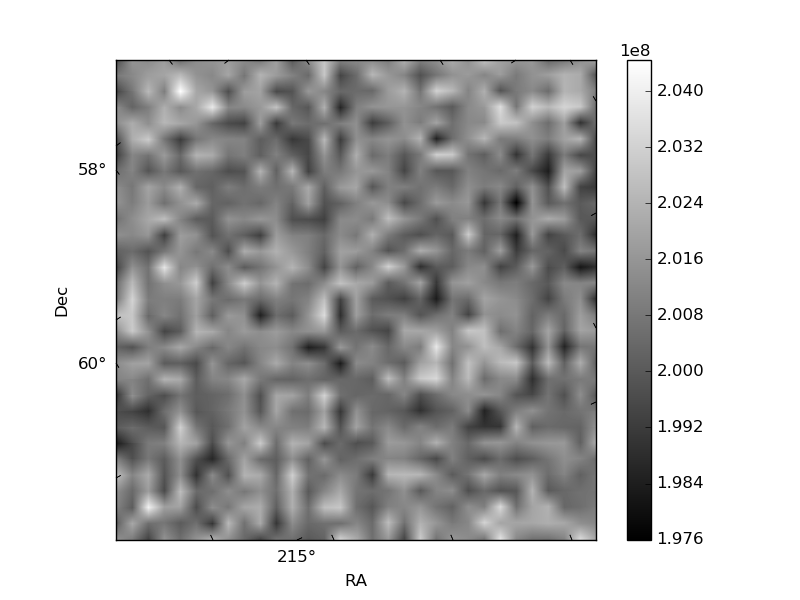
| Quadrant D | 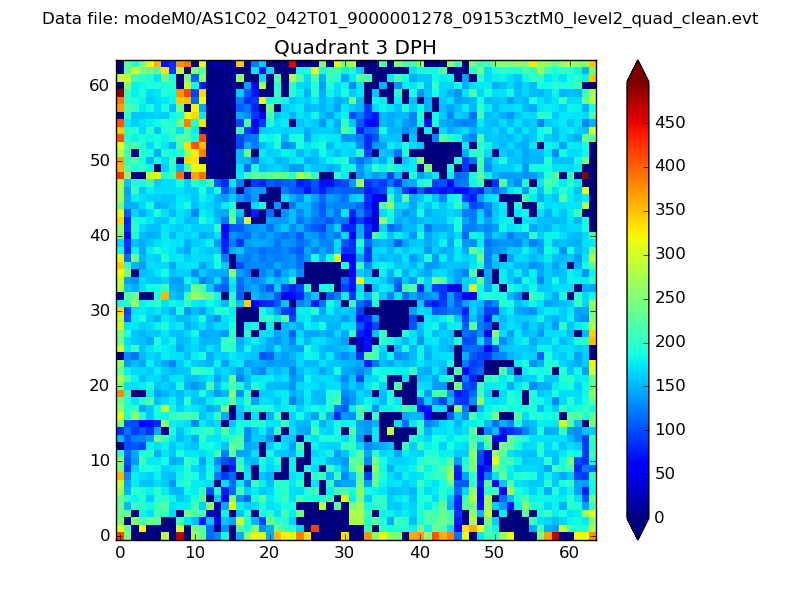 |
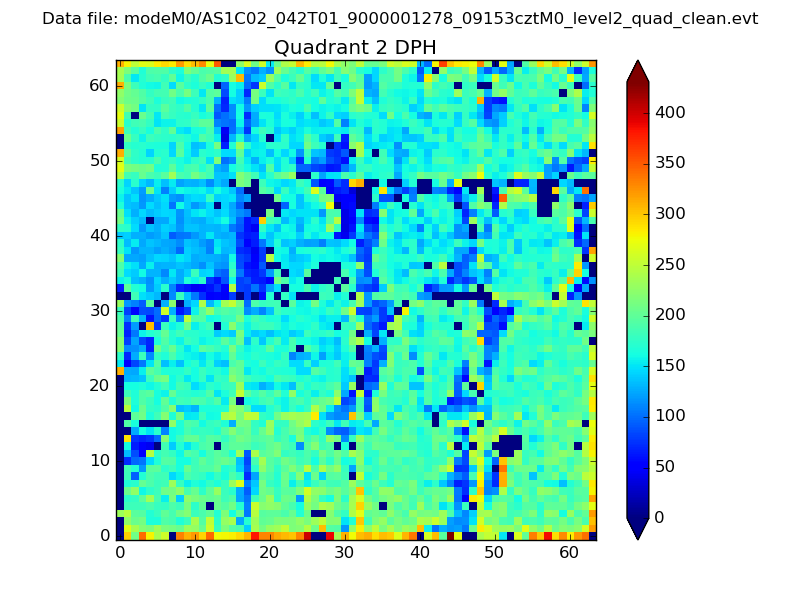 |
Quadrant C |
| Plot type | Count rate plots | Images |
|---|---|---|
| Comparison with Poisson distribution Blue bars denote a histogram of data divided into 1 sec bins. Red curve is a Poisson curve with rate = median count rate of data. |
 |
 |
| Quadrant-wise count rates Data is divided into 100 sec bins |
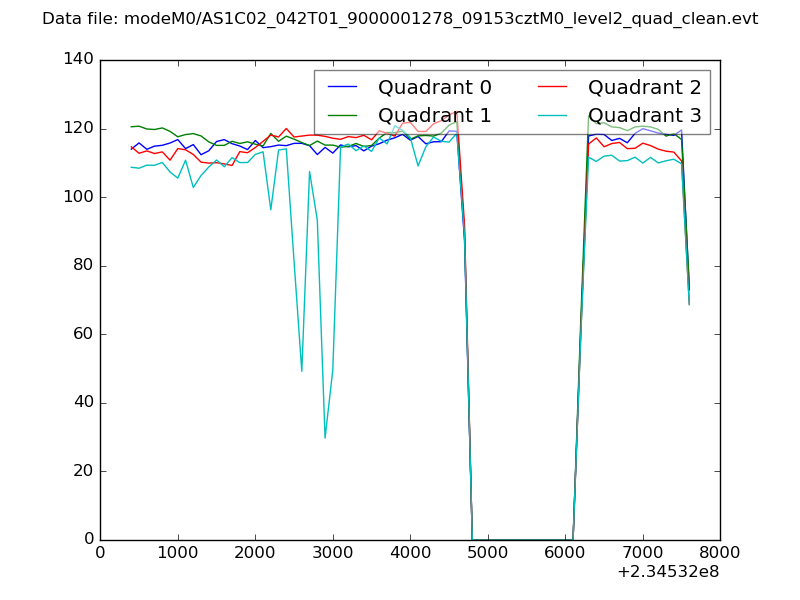 |
|
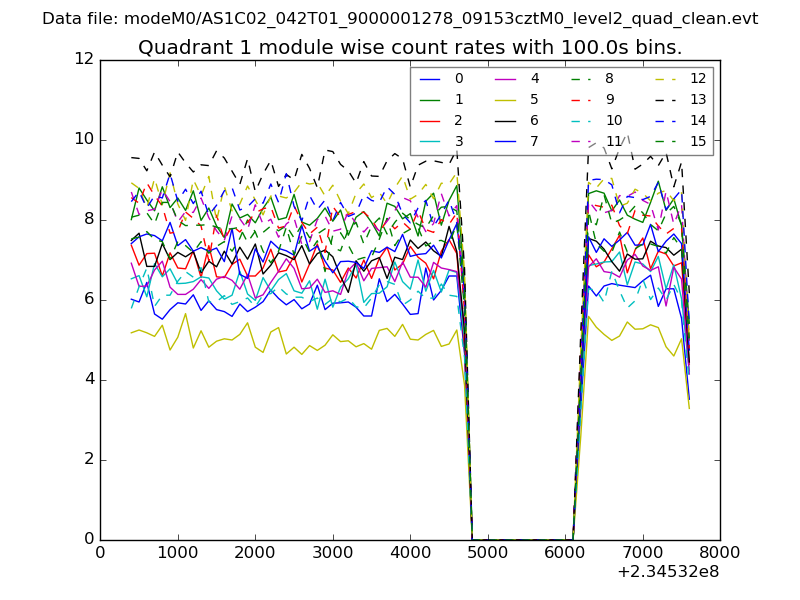
| Module-wise count rates for Quadrant A Data is divided into 100 sec bins |
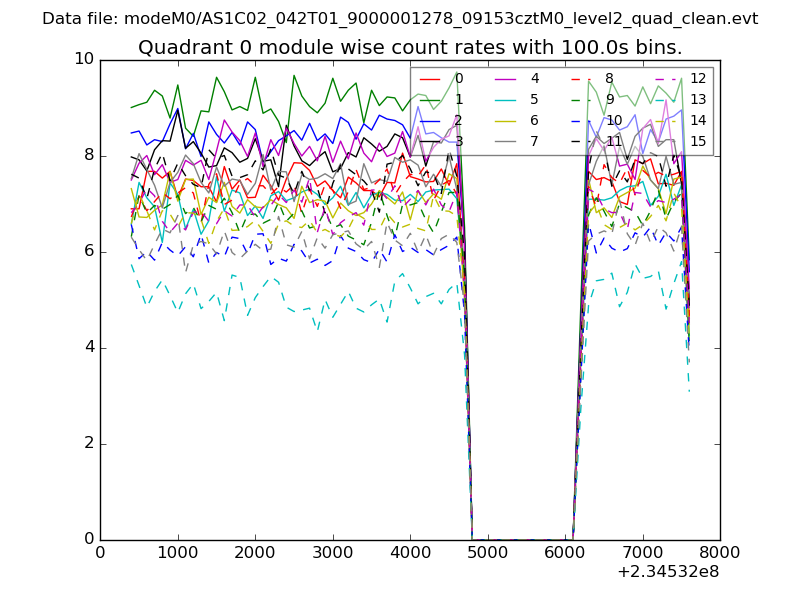 |
 |
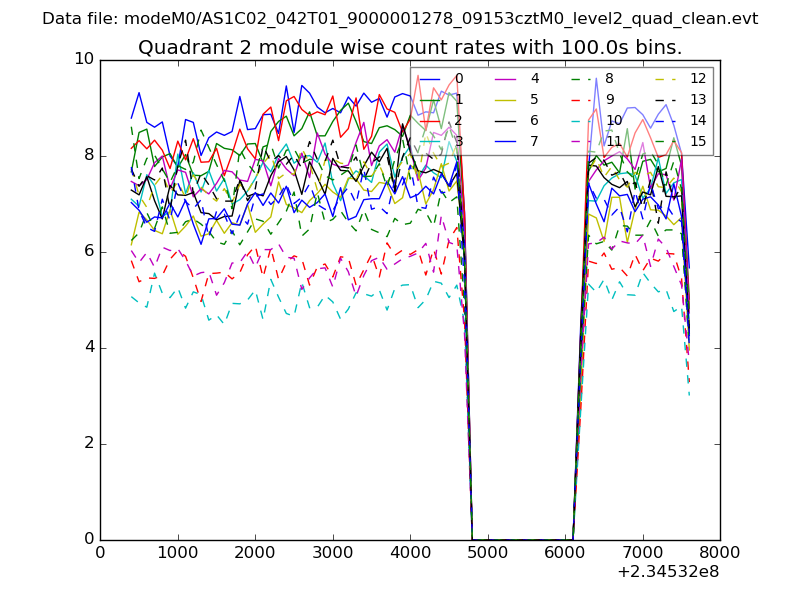
| Module-wise count rates for Quadrant B Data is divided into 100 sec bins |
 |
 |
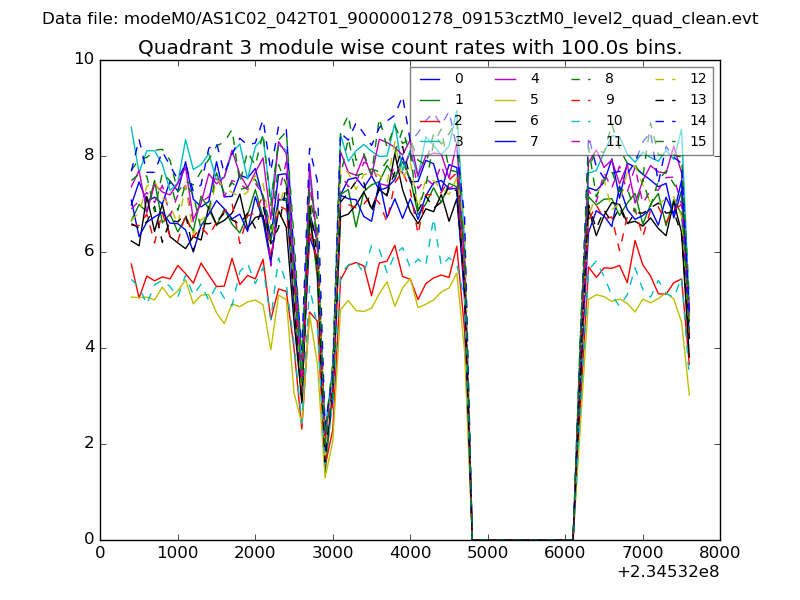
| Module-wise count rates for Quadrant C Data is divided into 100 sec bins |
 |
 |
| Module-wise count rates for Quadrant D Data is divided into 100 sec bins |
 |
 |
| Parameter | Plot |
|---|---|
| CZT HV Monitor | 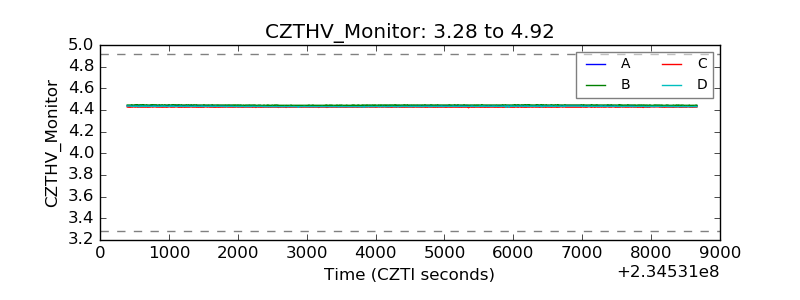 |
| D_VDD | 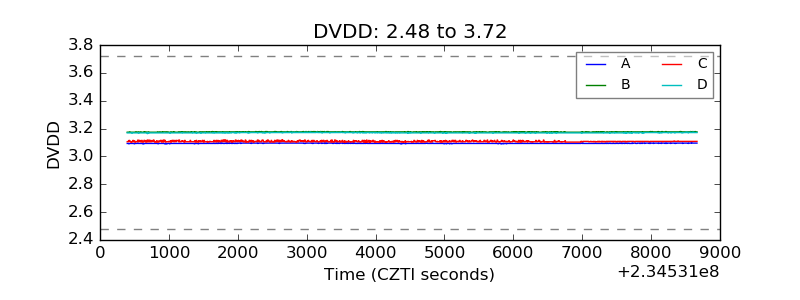 |
| Temperature 1 | 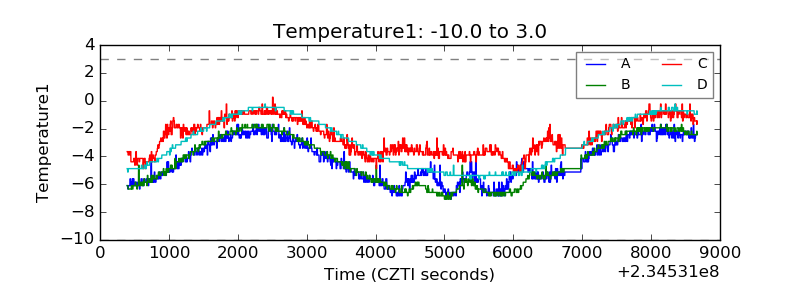 |
| Veto HV Monitor | 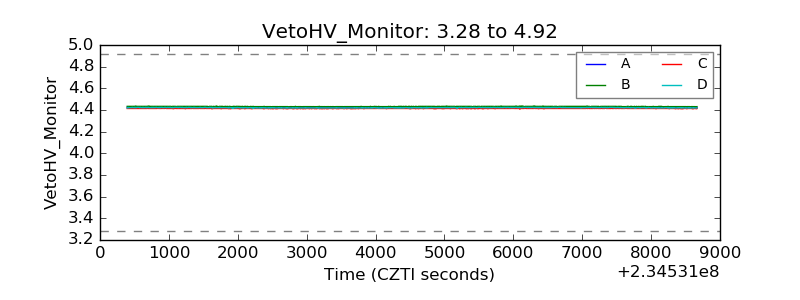 |
| Veto LLD | 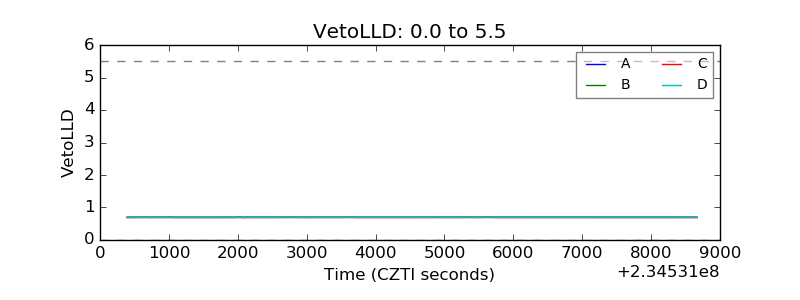 |
| Alpha Counter |  |
| _CPM_Rate | 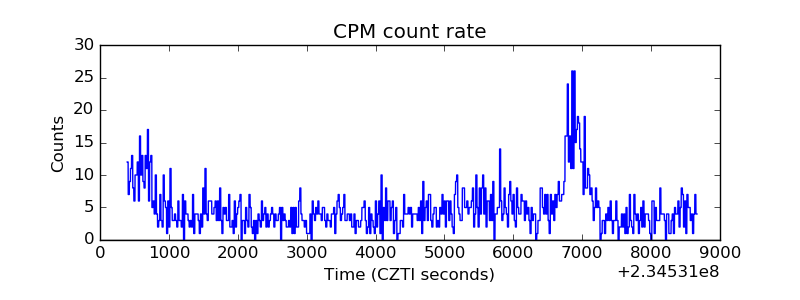 |
| CZT Counter | 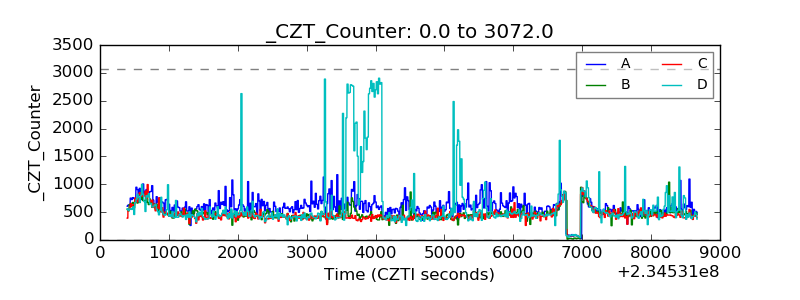 |
| +2.5 Volts monitor |  |
| +5 Volts monitor |  |
| _ROLL_ROT | 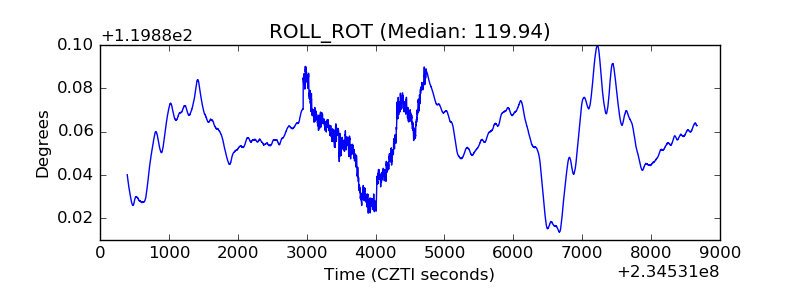 |
| _Roll_DEC | 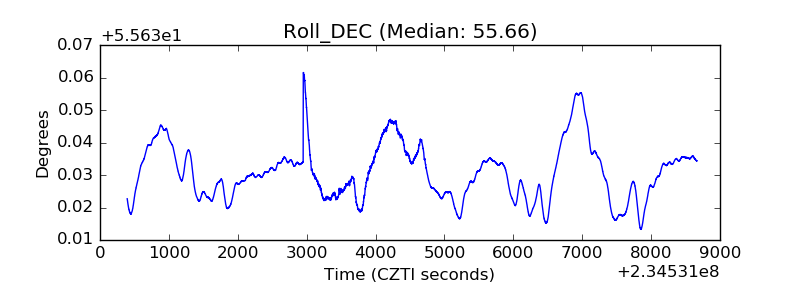 |
| _Roll_RA | 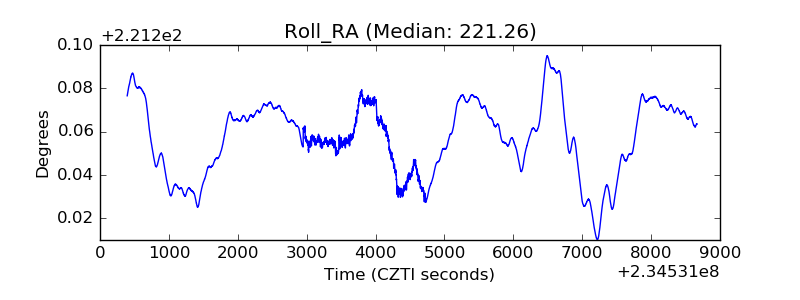 |
| Veto Counter | 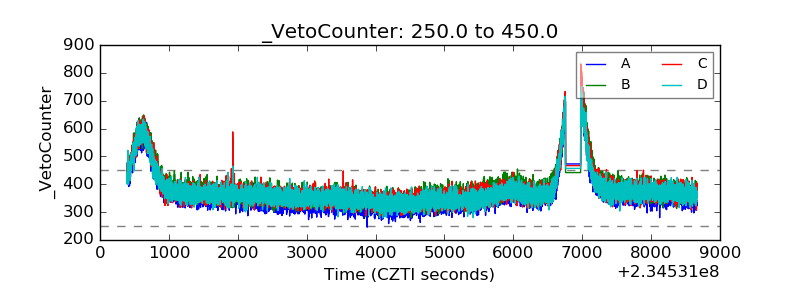 |